ISO 17025–ACCREDITED LABORATORY ENVIRONMENT

Endogenous Interference Resolution | LC-MS/MS Services for Reliable Biomarker Quantification

Accurate quantification of endogenous biomarkers and metabolites in complex biological matrices requires specialized strategies to resolve background analyte interference. We provide validated surrogate matrix approaches, isotope dilution workflows, and parallelism-tested methods to deliver reliable, publishable-quality data for your early discovery and translational research.

Validated Surrogate Matrix & Surrogate Analyte Approaches

Expert calibration strategies for the blank matrix dilemma.

SIL-IS Corrected Quantification

Stable isotope dilution for accurate endogenous target measurement.

Parallelism Testing for Matrix-Matched Accuracy

Rigorous cross-validation of surrogate vs. authentic matrix responses.

Interference Challenge Surrogate Approaches IDMS & Chromatography Parallelism & Validation Free vs. Total HRMS & Ion Mobility Sample Requirements Demo Results Case Study FAQ

Understanding the Endogenous Interference Challenge in LC-MS/MS Bioanalysis
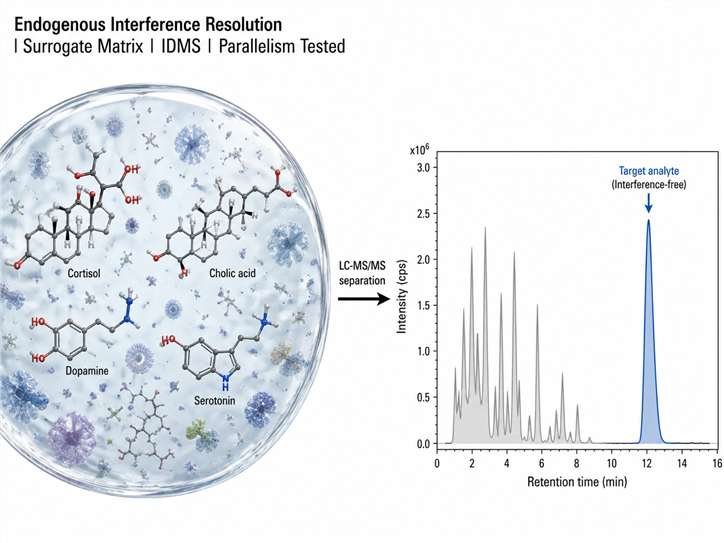
Endogenous interference resolution workflow showing complex biological matrix with endogenous molecules separated by LC-MS/MS

Quantifying an endogenous compound — an analyte that is naturally present in the sample matrix — presents a fundamentally different analytical challenge compared to quantifying an exogenous drug. When the target analyte itself exists in the background of every control sample, the standard bioanalytical workflow of "blank matrix plus spiked calibrator" collapses.

For example, cortisol is naturally present in human serum at concentrations ranging from 50 to 250 ng/mL. A calibration curve prepared in authentic human serum would, at the zero calibrator, already contain a significant endogenous cortisol signal. This makes it impossible to distinguish between "zero" and "low" concentrations without specialized strategies. Similarly, bile acids in liver tissue, neurotransmitters in brain homogenates, and steroid hormones in plasma all exhibit this same blank-matrix dilemma.

Beyond the calibration challenge, endogenous compounds frequently co-elute with structurally similar species — isobaric lipids, phase II conjugates, or degradation products — that produce overlapping MS/MS transitions, further degrading selectivity and accuracy at the Lower Limit of Quantification (LLOQ).

We specialize in resolving these challenges through a structured, evidence-based approach combining surrogate matrix strategies, isotope dilution mass spectrometry (IDMS), and rigorous parallelism validation. Our work is performed in an ISO 17025-accredited laboratory environment, ensuring traceability and reproducibility for every research study.

The "Blank Matrix" Dilemma: Why Traditional Calibration Fails

In conventional LC-MS/MS bioanalysis, the calibration curve is prepared by spiking known concentrations of the analyte into a "blank matrix" — a sample of the same biological material that is confirmed to contain no detectable analyte. For exogenous drugs, this is straightforward: pre-dose plasma or control tissue provides a clean blank.

For endogenous compounds, no natural blank exists. Every matrix sample already contains the target analyte. Attempting to subtract the endogenous level mathematically (background subtraction) introduces significant uncertainty, particularly at low concentrations where the endogenous signal dominates the total measured response.

Ion Suppression from Co-Eluting Endogenous Species

Endogenous compounds such as phospholipids, bile acids, and fatty acids are present at orders-of-magnitude higher concentrations than the target analyte. These species compete for ionization in the electrospray source, causing matrix effects that suppress or enhance the analyte signal. The effect is matrix-dependent and batch-dependent, making it impossible to correct through simple internal standard normalization alone.

The Gold Standard: Surrogate Matrix and Surrogate Analyte Approaches

The core solution to the blank-matrix dilemma lies in replacing the authentic biological matrix with an artificial or substitute matrix for calibration curve preparation. The surrogate matrix must mimic the physical and chemical properties of the authentic matrix closely enough that the ionization efficiency, extraction recovery, and chromatography of the target analyte are preserved.

We deploy three established approaches, selecting the optimal strategy based on the analyte characteristics, matrix availability, study phase, and regulatory intent.

Surrogate Matrix Approach: Best for Well-Characterized Targets

The surrogate matrix approach involves preparing calibration standards in a synthetic matrix — typically bovine serum albumin (BSA) dissolved in phosphate-buffered saline (PBS) at a concentration matching the protein content of the authentic matrix, or stripped plasma from which endogenous small molecules have been removed via charcoal stripping.

This approach is preferred when:

  • A suitable SIL internal standard is available for the target analyte.
  • The analytes are well-characterized and the protein-binding behavior is understood.
  • Sufficient authentic matrix is available for parallelism and QC verification.

The surrogate matrix calibration curve is cross-validated against authentic matrix QC samples at low, medium, and high concentration levels to confirm equivalency.

Surrogate Analyte Approach: Preferred for Rare or Precious Matrices

When the authentic matrix is extremely limited (e.g., human CSF, rare biopsy tissue) and cannot be spared for QC purposes, the surrogate analyte approach is a valuable alternative. Here, a stable isotope-labeled (SIL) version of the target analyte — which is chemically and chromatographically near-identical to the native analyte but distinguishable by mass shift — is used as the calibrator in authentic matrix.

The native endogenous level is then calculated by comparing the native-to-SIL ratio in the study sample to the calibration curve constructed from the SIL analog. This method is particularly useful for matrices where obtaining sufficient volume for parallelism testing is impractical.

Background Subtraction vs. Parallelism-Based Approaches

Background subtraction — simply measuring the endogenous level in a control sample and subtracting it from spiked calibrator values — is the simplest approach but also the most error-prone. Variation in endogenous baseline between samples, across time, or between experimental groups introduces systematic bias that is not captured by QC samples.

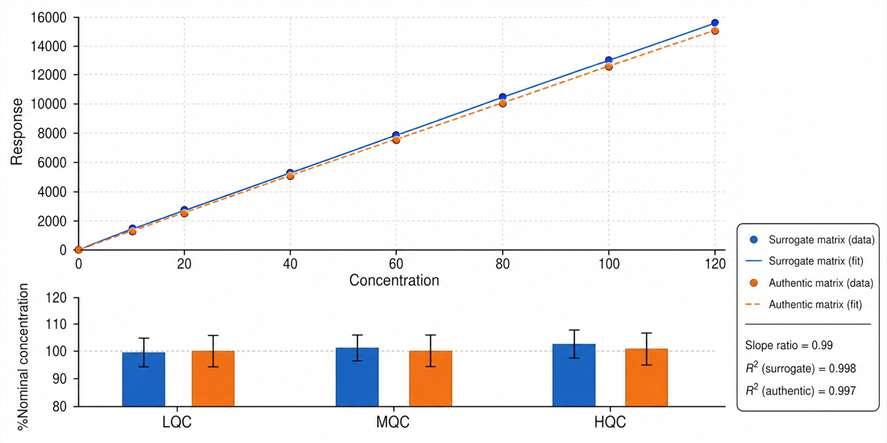
Parallelism-based approaches, where the surrogate matrix calibration curve is mathematically or experimentally shown to have equivalent slope and recovery to the authentic matrix response, provide a more robust foundation. The key metric is the slope ratio (surrogate slope divided by authentic matrix slope), which should fall within 0.8–1.2 for method acceptance.

Endogenous Quantification Approach Comparison

Approach When to Use Parallelism Requirement SIL-IS Required Regulatory Readiness Implementation Complexity
Surrogate Matrix Blank matrix unavailable; well-characterized target Mandatory (slope comparison) Recommended High (fit-for-purpose) Medium
Surrogate Analyte Endogenous target; structural analog available Mandatory (spike recovery) Optional Medium Medium-High
Background Subtraction (Origin-Adjusted) Consistent endogenous baseline; QC systems in place Not required; stability proof needed Not required Low-Medium Low
IDMS + Background Subtraction High precision needed; variable baseline Recommended Essential High Medium
Enzymatic Hydrolysis + Total Quantification Conjugated endogenous species Proof of hydrolysis completion needed Recommended High Medium-High

Isotope Dilution Mass Spectrometry (IDMS) and Chromatographic Resolution

Isotope dilution mass spectrometry (IDMS) is the gold-standard technique for correcting matrix effects in endogenous compound quantification. By spiking a known amount of stable isotope-labeled (SIL) internal standard into every sample — calibrator, QC, and unknown — any variation in ionization efficiency, extraction recovery, or chromatographic performance is normalized to the SIL response.

SIL-IS Selection Strategies for Endogenous Analytes

The ideal SIL internal standard for endogenous quantification is one that:

  • Differs from the native analyte by at least 3 Da (to avoid isotopic cross-talk from the natural abundance of 13C, 15N, or 2H).
  • Co-elutes with the native analyte chromatographically (ensuring identical matrix effect exposure).
  • Shows no detectable endogenous signal in authentic samples.

We maintain an in-house library of 200+ verified SIL compounds covering common endogenous targets including steroids (cortisol-d4, testosterone-d3, estradiol-d5), neurotransmitters (dopamine-d4, serotonin-d4, norepinephrine-d6), bile acids (cholic acid-d4, deoxycholic acid-d4), amino acids (tryptophan-d5, kynurenine-d4), and vitamins (25-hydroxyvitamin D3-d6, folic acid-d4). Custom SIL synthesis is available for novel targets.

Chromatographic Conditions for Baseline Separation from Interfering Peaks

We optimize the LC conditions — column chemistry (C18, HILIC, F5, or mixed-mode), mobile phase composition (pH, buffer strength, organic modifier), and gradient profile — to achieve baseline separation of the target endogenous analyte from co-eluting isobaric species. For highly challenging separations, we employ two-dimensional LC (2D-LC) or heart-cutting approaches.

To assist in your endogenous quantification method development, we provide detailed chromatographic guidance as part of our Custom LC-MS/MS Method Development service, ensuring that the separation strategy is tailored to your specific endogenous target and matrix combination.

Alternative Mass Transitions and MRM Optimization

For endogenous analytes that share a common product ion with an abundant interferent, we explore alternative fragmentation pathways — including in-source fragmentation, adduct ion formation (NH4+, Na+, CH3COO), and charge-state switching — to identify a unique, interference-free MRM transition. When triple-quadrupole resolution is insufficient, we escalate to high-resolution accurate mass (HRAM) on Q-TOF or Orbitrap platforms for the High-Resolution Metabolite Quantification workflow.

Parallelism Testing and Fit-for-Purpose Validation Workflow

Parallelism assessment workflow showing surrogate matrix versus authentic matrix calibration curve comparison across QC levels

Trust in surrogate matrix calibration is established through rigorous parallelism testing. We follow a structured QC workflow with defined acceptance criteria at each checkpoint.

Slope Comparison as Quantitative Parallelism Metric

Parallelism is assessed by preparing calibration curves in both the surrogate matrix and the authentic matrix, then comparing the slopes. The slope ratio (surrogate slope divided by authentic matrix slope) must fall within 0.80–1.20. If the ratio falls outside this range, systematic bias in quantification is indicated, and the surrogate matrix formulation must be adjusted or an alternative approach selected.

Multi-Level QC Verification Across the Analytical Range

After establishing parallelism, we prepare authentic matrix QC samples at three concentration levels — low (LQC, within 3× the LLOQ), medium (MQC, mid-range), and high (HQC, near the upper limit of quantification). These QC samples are analyzed against the surrogate matrix calibration curve. Accuracy must be within ±20% (±25% at LLOQ) and precision within 20% RSD for the method to be considered validated for fit-for-purpose use.

Dilution Linearity and Stability Evaluation in Authentic Matrix

For samples falling above the calibration range, we validate dilution integrity in authentic matrix at 2× and 5× dilution factors. Stability is evaluated in authentic matrix under relevant conditions (bench-top, freeze-thaw, and long-term storage), recognizing that endogenous compound stability may differ significantly from exogenous drug stability due to the presence of metabolic enzymes in the matrix.

All validation work is documented under ISO 17025 quality standards, and we offer comprehensive Method Validation (ISO 17025-Compliant) services for studies requiring full fit-for-purpose validation.

Free vs. Total Endogenous Analyte Differentiation via Enzymatic Hydrolysis

Many endogenous compounds exist in both free (unconjugated) and conjugated forms — glucuronides, sulfates, and glutathione adducts — that together constitute the "total" pool. Differentiating free from total concentration is critical for understanding the biologically active fraction and the compound's disposition.

We perform controlled enzymatic hydrolysis using β-glucuronidase (for glucuronide conjugates) or sulfatase (for sulfate conjugates). Total concentration is measured after complete hydrolysis, free concentration is measured without hydrolysis, and the conjugated fraction is calculated by difference.

Key QC points include:

  • Confirmation of hydrolysis completion using time-course monitoring.
  • Evaluation of analyte stability under hydrolysis conditions (pH, temperature, incubation time).
  • Matrix-specific recovery verification for both free and total workflows.

This is particularly relevant for steroid hormones (estradiol glucuronide, cortisol sulfate), bile acids (glycocholic acid, taurocholic acid), and catecholamine metabolites.

High-Resolution MS and Ion Mobility Separation for Isobaric Interferences

When nominal mass resolution (unit resolution on triple-quadrupole instruments) cannot separate the target endogenous analyte from an isobaric interferent — for example, leucine/isoleucine isomers, testosterone/epitestosterone, or cortisol/prednisolone — we escalate to high-resolution accurate mass (HRAM) spectrometry or ion mobility separation (IMS).

HRMS on Q-TOF or Orbitrap platforms provides mass resolution of 30,000–240,000 FWHM, enabling separation of nominally isobaric species based on exact mass. IMS adds an orthogonal separation dimension based on collision cross-section (CCS), which can resolve structural isomers and conformers that are indistinguishable by mass alone.

These advanced techniques are particularly valuable for the LC-MS/MS Drug Quantification in Tissue and Cell Lysates where the complexity of the biological background is highest.

Sample Requirements & Shipping Guidelines for Endogenous Compound Analysis

Proper sample collection and handling are critical for endogenous compound quantification. Endogenous analytes are subject to rapid ex vivo degradation, enzymatic conversion, and adsorption to container surfaces. Please follow these guidelines when preparing and shipping your samples.

Sample Type Minimum Volume / Weight Container Specification Shipping Conditions Critical Notes
Serum / Plasma (Endogenous Steroids) 50 µL EDTA or heparin tubes Dry Ice (-80°C) Avoid repeated freeze-thaw cycles. Record collection time for diurnal biomarkers.
CSF 20 µL Polypropylene microcentrifuge tubes (low-protein binding) Dry Ice (-80°C) Minimize freeze-thaw cycles. Avoid vortexing.
Tissue Homogenate (Endogenous Metabolites) 50–100 mg equivalent Pre-weighed cryovials Dry Ice (-80°C) Record exact wet weight. For neurotransmitters: use ice-cold acidified homogenization buffer.
Urine 100 µL Sterile containers Dry Ice (-80°C) Record collection time. For acid-labile analytes: add preservative.
Cell Lysate (Intracellular Metabolites) 100 µL (~1×10⁶ cells) Microcentrifuge tubes Dry Ice (-80°C) Wash with ice-cold PBS. Provide lysis buffer composition for MS compatibility.

Note: These are general guidelines. Specific requirements depend on the target analyte's chemical stability and the matrix characteristics. We provide project-specific instructions during the method development consultation.

Demo Results: What Your Endogenous Quantification Data Package Includes

We believe in complete data transparency. Each project deliverable includes the following components, designed to provide full confidence in your endogenous quantification results.

  • Parallelism Comparison Plot: A side-by-side overlay of the surrogate matrix calibration curve and the authentic matrix calibration curve, annotated with slope equations, R² values, and the slope ratio. This plot provides visual proof that the surrogate matrix accurately reflects the authentic matrix response across the full calibration range.
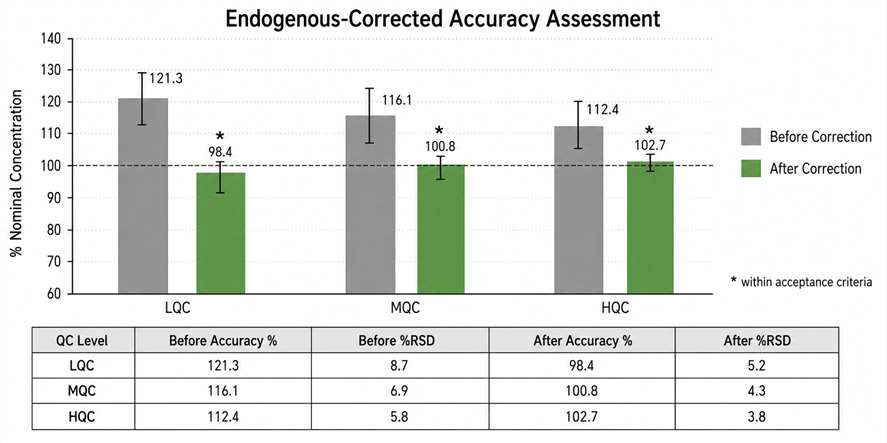
  • Endogenous-Corrected Accuracy/Precision Table: QC results presented in tabular format, showing the measured concentration in authentic matrix QC samples before and after endogenous baseline correction. Any bias introduced by the correction method is explicitly quantified and documented.
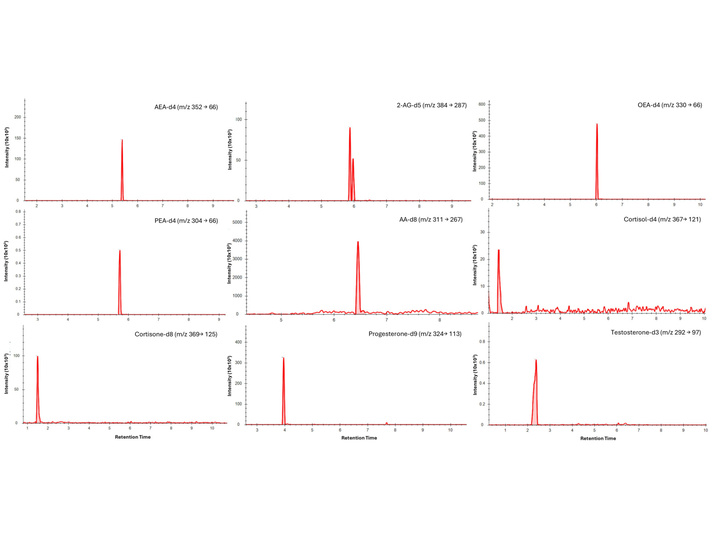
  • Representative MRM Chromatograms: Full chromatographic traces at blank, LLOQ, low QC, and high QC levels, demonstrating baseline separation from endogenous background and confirming the absence of interfering co-eluting species.

All data packages are prepared in alignment with ISO 17025-compliant documentation standards.

Demo results showing parallelism comparison plot between surrogate and authentic matrix calibration curves

Case Study (Research Summary)

Source Paper

Biosensors (2026) 16(3):147. Hargreaves J, Eddes G, Nichols DS, Ney LJ. doi:10.3390/bios16030147

What the Paper Reports

This paper describes a validated LC-MS/MS method using a surrogate analyte approach for quantifying endogenous cannabinoids (AEA, 2-AG) in human saliva and finger-prick capillary blood microsamples (Mitra® VAMS). The method achieved an LOD of 0.001 ng/mL (AEA) with precision ≤15% RSD and recovery ≥66% across both matrices, demonstrating that surrogate analyte workflows can deliver reliable quantification from minimal sample volumes.

This article is licensed under a Creative Commons Attribution 4.0 International License (CC BY 4.0).

LC-MS/MS MRM chromatograms of endogenous cannabinoid internal standards in saliva and blood microsamples

Frequently Asked Questions

How do you choose between surrogate matrix and surrogate analyte approaches for my endogenous target?

The selection depends on (1) availability of suitable SIL internal standard, (2) rarity and volume of the authentic matrix, (3) whether the endogenous background level is stable across samples, and (4) the study's regulatory intent. We evaluate these factors in a pre-study consultation and recommend the optimal approach, documenting the rationale.

What is the minimum validation I can expect for an exploratory biomarker study?

For early discovery studies, we typically perform: calibration curve linearity (5–8 points), accuracy and precision at 3 QC levels (LQC, MQC, HQC), parallelism assessment, and dilution integrity. Full fit-for-purpose validation (selectivity, carryover, stability, recovery, matrix factor) is performed for later-stage studies.

Can you handle rare human CSF or biopsy samples for endogenous biomarker quantification?

Yes. Our low-volume method development expertise allows quantification from as little as 5–20 µL of CSF or a single biopsy punch (<5 mg). We use microflow LC-MS and µL-scale SPE to maximize sensitivity from limited material.

How do you differentiate between free and conjugated endogenous analyte species?

We employ controlled enzymatic hydrolysis (β-glucuronidase or sulfatase) to convert conjugated species into their free form. Total concentration is measured after hydrolysis, while free concentration is measured without hydrolysis. The difference represents the conjugated fraction.

What SIL-IS are available in-house for common endogenous targets?

Our in-house inventory includes 200+ stable isotope-labeled compounds covering common endogenous targets: steroids (cortisol-d4, testosterone-d3), neurotransmitters (dopamine-d4, serotonin-d4), bile acids (cholic acid-d4), amino acids (tryptophan-d5), and vitamins (25-OH vitamin D3-d6). Custom SIL-IS can be synthesized for novel targets.

Ready to Quantify Your Lead Compound or Metabolite?

Share your matrix type, sample count, and expected range—feasibility routing will confirm whether direct quantification is fit-for-purpose or method development is recommended.

inquiry
Online Inquiry