ISO 17025–ACCREDITED LABORATORY ENVIRONMENT

Phase I and II Metabolite Characterization Services

Phase I and Phase II metabolism are the two primary stages where the body transforms a foreign compound into a more water-soluble form for excretion. Mapping these pathways is essential for identifying metabolic "soft spots," assessing drug safety, and predicting potential drug-drug interactions (DDI) during early drug discovery.

We provide highly customized Phase I and Phase II metabolite characterization services within an ISO 17025 certified laboratory environment. By combining advanced high-resolution mass spectrometry (HRMS) with diverse in vitro models—including liver microsomes, cryopreserved hepatocytes, and S9 fractions—we deliver a comprehensive biotransformation map of your lead compounds. Our goal is to provide the high-quality bioanalytical data needed to drive your research programs forward with scientific confidence.

Comprehensive Pathway Mapping

Track the chemical evolution from Phase I functionalization through Phase II conjugation to provide a complete metabolic tree.

High-Resolution Precision

Sub-ppm mass accuracy to distinguish isobaric metabolites and exact modification sites.

Soft-Spot Identification

Pinpoint the specific chemical bonds vulnerable to metabolic attack for structural optimization.

Integrated Bioinformatics

Utilize predictive algorithms and mass defect filtering to ensure no low-abundance metabolite goes undetected.

Systematic Workflow Bioinformatics-Enhanced Identification Technical Challenges Demo Results Sample Requirements Selection of Metabolic Models Case Study Scientific Discussion Frequently Asked Questions

Systematic Workflow for Metabolite Characterization

Our workflow is designed to maximize metabolite recovery and ensure the scientific integrity of every data point. Each step includes specific Quality Control (QC) checkpoints to maintain high standards throughout our In Vitro Drug Metabolism Profiling services.

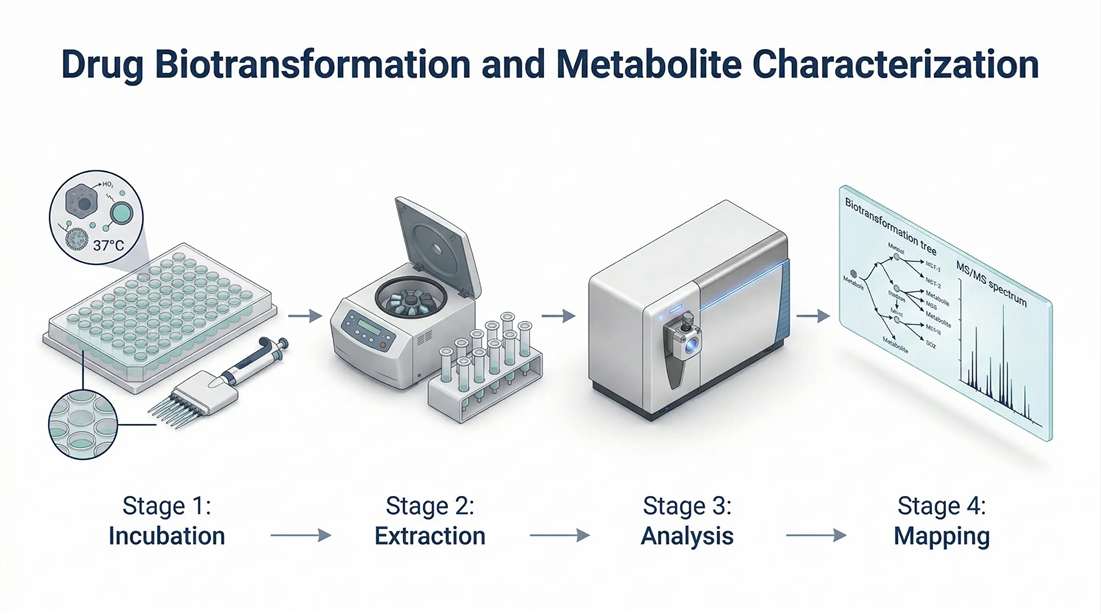
Workflow Infographic - From Sample Incubation to Structural Elucidation

Image 1: Workflow Infographic - Drug biotransformation workflow showing compound incubation, metabolite extraction, LC-MS/MS analysis, and final pathway mapping.

1. Study Design & Model Selection

The process begins with selecting the most appropriate in vitro system based on the compound's chemical structure and the researcher's specific goals.

  • Microsomes: Optimal for investigating P450-mediated Phase I reactions.
  • Hepatocytes: Essential for observing the interplay between Phase I and Phase II metabolism in a physiologically relevant environment.
  • QC Checkpoint: Baseline stability testing is performed to ensure the compound is compatible with the incubation media and does not undergo non-enzymatic degradation.

2. Compound Incubation & Sample Preparation

Compounds are incubated under controlled conditions (37°C, pH 7.4) with the necessary cofactors, such as NADPH for Phase I or UDPGA for Phase II reactions.

  • Quenching: Reactions are terminated at multiple time points (e.g., 0, 15, 30, 60 minutes) to capture transient intermediate metabolites and track the kinetics of biotransformation.
  • Extraction: We utilize optimized protein precipitation or solid-phase extraction (SPE) protocols tailored to the compound's polarity, ensuring maximum recovery of even the most polar conjugates.

3. HR-LC-MS/MS Data Acquisition

Samples are analyzed using state-of-the-art Orbitrap or Q-TOF mass spectrometers.

  • Full Scan MS: Captures the accurate mass of all ions in the sample, providing a "digital map" of the metabolic profile.
  • Data-Dependent Acquisition (DDA): The system automatically triggers MS/MS fragmentation for potential metabolites based on pre-defined inclusion lists and real-time intensity thresholds.
  • QC Checkpoint: Post-analysis system suitability checks ensure the mass accuracy remained within the required sub-2 ppm range throughout the run.

4. Data Processing & Structural Elucidation

Our experts use specialized software to mine the raw data for drug-related signals, effectively separating them from the thousands of endogenous signals present in biological matrices.

  • Mass Defect Filtering (MDF): This technique filters out background noise and endogenous compounds based on their unique mass defect, highlighting potential metabolites.
  • Fragment Pattern Analysis: By comparing the MS/MS spectra of the metabolite with the parent drug, we can determine the exact site of biotransformation.

Bioinformatics-Enhanced Metabolite Identification

Identifying metabolites in complex biological matrices is often compared to finding a needle in a haystack. To overcome the risk of "false negatives" and ensure total coverage, we integrate advanced bioinformatics tools into our Advanced MetID Services analysis pipeline.

Predictive Modeling with BioTransformer and SyGMa

Before the laboratory work begins, our team uses tools like BioTransformer to predict the most likely Phase I and Phase II metabolites based on the chemical structure of your compound. This allows our scientists to create targeted "inclusion lists" for the mass spectrometer. By pre-programming the instrument to look for these predicted masses, we significantly increase the sensitivity for low-abundance metabolites that might otherwise be missed by standard screening.

Advanced Data Filtering and Signal Processing

  • Neutral Loss Scanning: This is a powerful tool for identifying Phase II conjugates. For example, the loss of 176 Da specifically identifies glucuronides, while a loss of 80 Da points to sulfates. This allows us to find conjugates even in samples with high background interference.
  • Isotope Pattern Recognition: If your compound contains chlorine, bromine, or other unique elements, we use their distinct isotope signatures to instantly verify that a signal is drug-related.
  • Structure-Activity Recognition: We map the identified metabolites back to the compound’s scaffold, providing a structural explanation for observed metabolic pathways.

Technical Challenges: Overcoming Phase II Analytical Bottlenecks

Phase II metabolites, particularly glucuronides and sulfates, present unique analytical challenges that require specialized expertise to solve.

Solving the Instability of Acyl Glucuronides

Acyl glucuronides are known to be chemically unstable and can undergo intramolecular rearrangement or hydrolysis back to the parent drug. If not handled correctly, this can lead to an underestimation of metabolism. Our laboratory utilizes chilled sample handling and pH-adjusted extraction buffers (typically slightly acidic) to stabilize these sensitive metabolites throughout the analytical process.

Mitigating In-Source Fragmentation

A common pitfall in metabolite characterization is in-source fragmentation, where a Phase II conjugate breaks down back into the parent drug ion within the mass spectrometer's source. This can lead to false positives for the parent drug or incorrect quantification. We solve this by optimizing the chromatographic separation, ensuring that the conjugate and the parent drug elute at different retention times, and by fine-tuning the declustering potential (DP) and source temperature.

Demo Results: Comprehensive Biotransformation Deliverables

We provide a detailed data package that translates complex MS signals into actionable scientific insights. Typical deliverables include:

  1. Total Ion Chromatograms (TIC): An overview of the sample complexity and metabolic conversion over time.
  2. Extracted Ion Chromatograms (XIC): Targeted views showing the presence and relative abundance of specific metabolites.
  3. High-Resolution MS/MS Spectra: Detailed fragmentation patterns for every identified metabolite, providing the evidence for structural assignments.
  4. Biotransformation Map (Metabolic Tree): A visual schematic showing how the parent drug is transformed into various Phase I and Phase II products.
  5. Metabolite Summary Table: A structured table including retention times, observed mass, formula, mass error (ppm), and the proposed metabolic reaction.
  6. Soft-Spot Map: A graphical representation highlighting the chemical groups most susceptible to metabolism, directly informing the next round of medicinal chemistry.
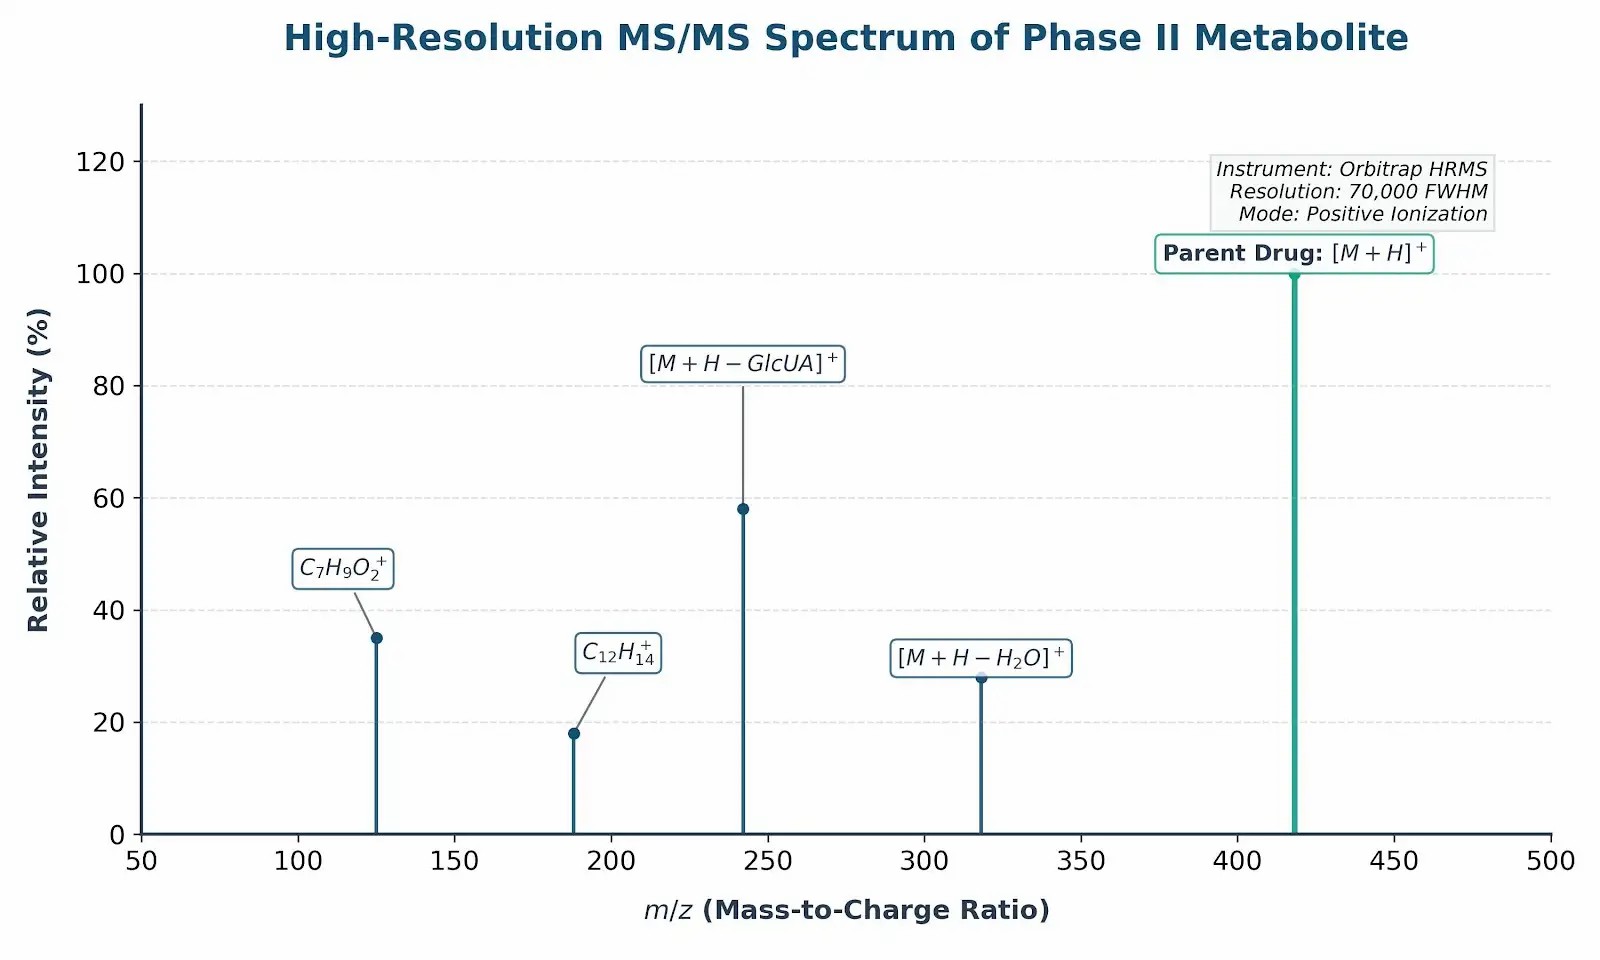
Representative MS/MS Spectrum showing fragmentation patterns

Image 2: An MS/MS spectrum showing distinct fragmentation patterns used for structural elucidation.

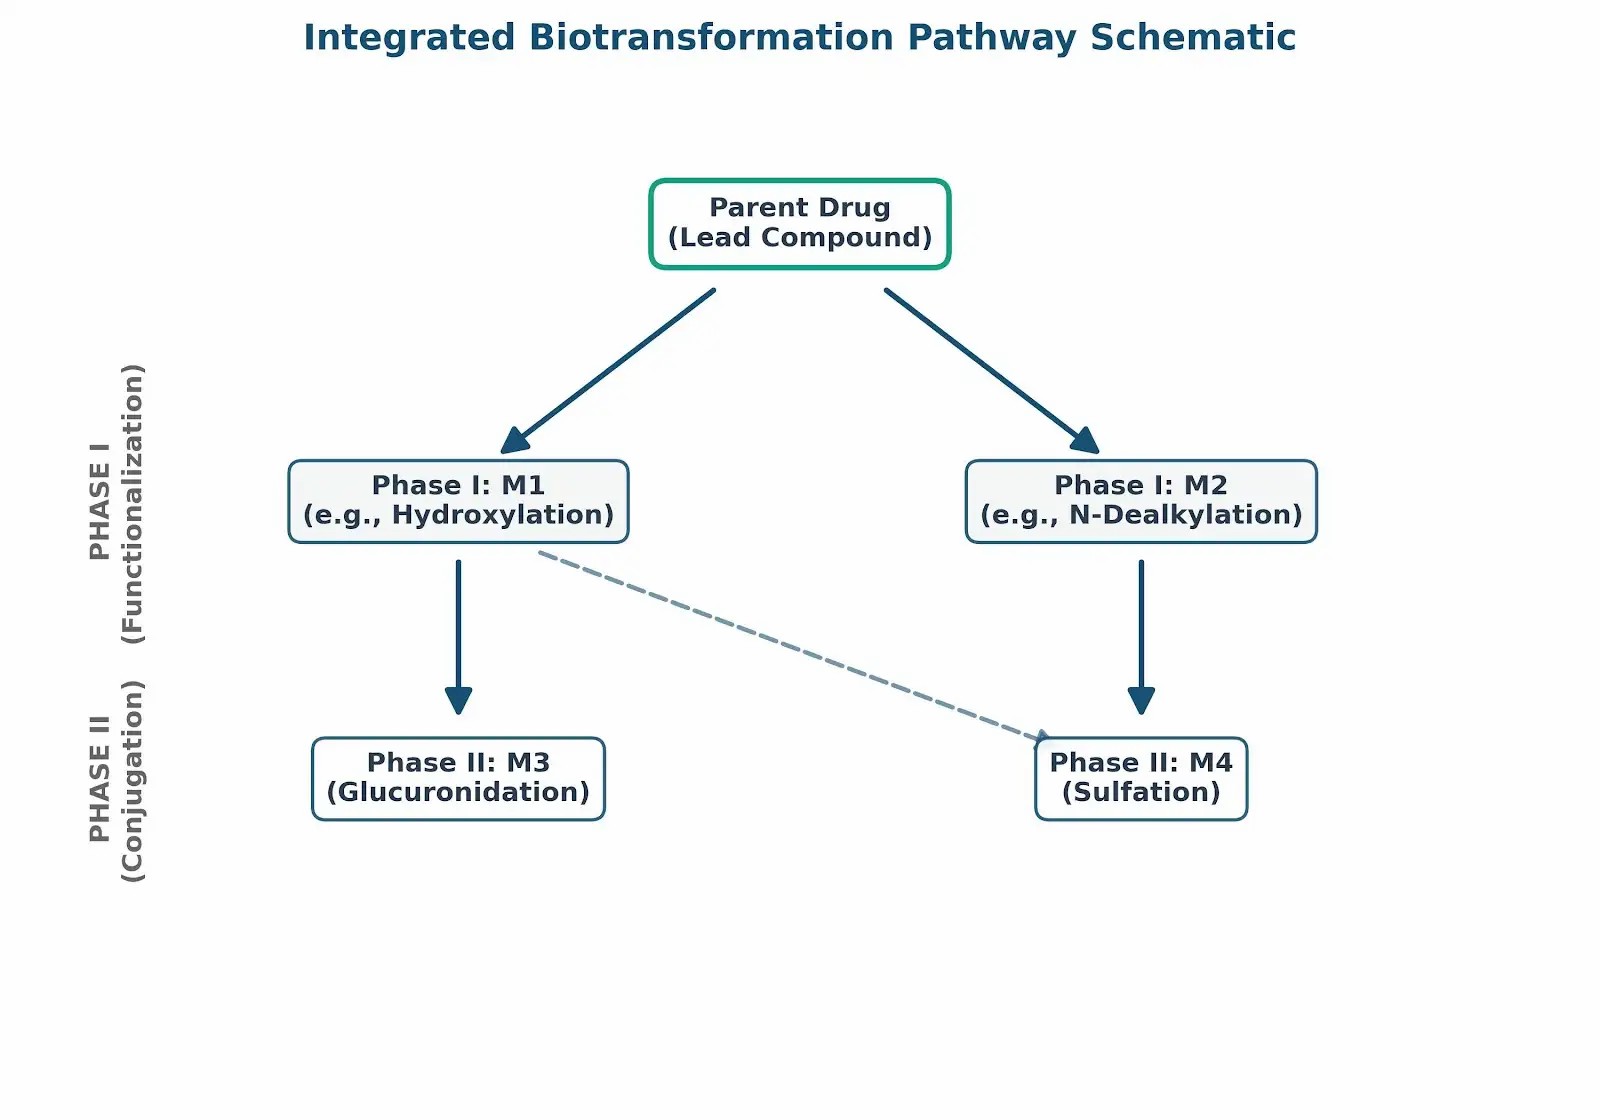
Biotransformation Map / Metabolic Pathway Tree

Image 3: Biotransformation tree showing the conversion of a parent drug into multiple metabolites.

Sample Requirements for In Vitro Studies

To ensure the highest data quality and reproducibility, we recommend the following sample specifications:

Item Requirement Remarks
Compound Amount 2–5 mg (solid preferred) Sufficient for method development and multiple incubations.
Purity >95% (HPLC/UV) High purity prevents interference from synthesis by-products.
Solubility Soluble in DMSO or MeOH Standard stock concentration is typically 10 mM.
Biological Matrix Microsomes, S9, or Hepatocytes We provide these; if providing your own, include QC data.
Shipping On dry ice Required for frozen biological matrices to maintain activity.

Strategic Selection of In Vitro Metabolic Models

Choosing the right in vitro model is critical for generating data that accurately predicts in vivo behavior. The following table compares our primary platforms:

Feature Liver Microsomes Liver S9 Fraction Cryopreserved Hepatocytes
Enzyme Content CYP450, FMO CYP450, UGT, SULT, NAT Full complement of enzymes
Phase I Capability Excellent Good Excellent
Phase II Capability Limited (requires cofactors) Comprehensive Excellent (endogenous cofactors)
Complexity Low (subcellular) Moderate High (intact cell)
Best For CYP mapping & Kinetics Broad Phase II screening In vivo-like biotransformation

Expert Selection Strategy:
If your compound is expected to undergo rapid oxidative metabolism (common for hydrophobic molecules), Liver Microsomes are the most cost-effective and sensitive starting point. However, if the compound has functional groups like hydroxyl (-OH), carboxylic acid (-COOH), or amine (-NH2), it is highly likely to undergo Phase II conjugation. In such cases, Hepatocytes are strongly recommended to observe the complete metabolic profile and the natural interplay between different metabolic pathways.

Case Study: Elucidating the Complex Metabolism of Psychotropic Drugs

Background:
A research team was developing a novel psychotropic compound but faced significant challenges in explaining its rapid clearance in animal models. Initial Phase I screening in microsomes showed minimal conversion, which did not align with the high in vivo clearance observed.

Methods:
We applied a dual-track approach using both liver microsomes and cryopreserved human hepatocytes. We utilized LC-MS/MS with Neutral Loss Scanning to specifically target Phase II conjugates that might have been missed in initial screens. Advanced Mass Defect Filtering was also applied to the hepatocyte data.

Results:
The analysis revealed that while Phase I oxidation was slow, the compound underwent rapid and extensive Glucuronidation (Phase II) directly on the parent molecule. We successfully mapped 5 distinct Phase I metabolites and 3 major Phase II conjugates.

  • Verification: The identification was confirmed via high-resolution MS/MS (sub-2 ppm mass error) and comparison with predicted fragment patterns.
  • Data Visualization: The resulting metabolic tree (as shown in Figure 4 of the reference Frontiers in Pharmacology) clearly illustrated the dominance of the UGT-mediated pathway over the CYP-mediated pathway.

Conclusion:
This study proved that the "metabolic soft spot" was a specific phenolic group vulnerable to UGT enzymes. This insight allowed the client to modify the structure to "shield" the soft spot, successfully improving the compound's metabolic stability and extending its half-life.

Metabolic Pathways derived from Figure 4 of cited case study

Image 4: Metabolic pathways of a drug, showing Phase I oxidation and Phase II glucuronidation branches.

Scientific Discussion: The Biological Significance of Phase I/II Transition

In the drug discovery journey, the transition from Phase I to Phase II is a critical gateway that dictates a compound’s safety and efficacy. Phase I reactions (oxidation, reduction, or hydrolysis) introduce polar functional groups. While this increases water solubility, it can sometimes create "reactive intermediates"—chemically active species that can bind to cellular proteins or DNA, leading to toxicity, a risk that can be specifically evaluated in parallel via our Reactive Metabolite Screening.

Phase II reactions (conjugation) act as the primary defense mechanism by "masking" these reactive groups with large, highly polar molecules like glucuronic acid, sulfate, or glutathione. Understanding the balance between these two phases is vital. For instance, if Phase II enzymes are saturated or genetically deficient in certain populations, Phase I intermediates can accumulate, leading to idiosyncratic drug-induced liver injury (DILI). Our characterization services provide the quantitative and qualitative evidence needed to assess this balance early in the R&D process, allowing researchers to de-risk their portfolios before entering costly clinical trials.

Species Differences in Phase I/II Metabolism

A common hurdle in drug discovery is the difference in metabolic preferences between species. For example, dogs are known to be deficient in certain acetylation pathways (Phase II), while cats are deficient in certain glucuronidation pathways. Relying on a single animal model can lead to misleading conclusions about human metabolic fate. Our platform allows for concurrent profiling across multiple species, enabling researchers to identify the most relevant animal model for their specific compound class.

Frequently Asked Questions (FAQ)

Why should I include Phase II characterization if my Phase I screening showed low metabolism?

Many compounds are "Phase II direct" substrates, meaning they are conjugated without needing a prior Phase I oxidation step. Furthermore, some Phase I metabolites are so short-lived that they are instantly converted into Phase II conjugates. Without analyzing both phases in intact cells (like hepatocytes), you risk missing the primary clearance mechanism of your drug candidate.

How do you distinguish between two metabolites with the exact same mass (isobaric metabolites)?

We employ a two-tiered approach. First, we use high-resolution chromatography to separate the metabolites based on their chemical properties. Second, we use high-energy collision-induced dissociation (CID) to generate unique "fingerprint" fragments. Even if the total mass is identical, the fragment patterns usually reveal the specific location of the modification.

What is the advantage of using cryopreserved hepatocytes over S9 fractions?

Hepatocytes are intact cells that maintain the natural architecture of the cell, including functional transporters and the endogenous concentration of cofactors. This provides a more accurate representation of the "in vivo-like" metabolic rate and the competition between different enzyme families compared to subcellular fractions like S9, where the cellular structure is disrupted.

Ready to Quantify Your Lead Compound or Metabolite?

Share your matrix type, sample count, and expected range—feasibility routing will confirm whether direct quantification is fit-for-purpose or method development is recommended.

inquiry
Online Inquiry