We provide objective experimental evidence of our analytical rigor. Our standard data packages include the exact quantitative metrics required by advanced researchers to verify the success of a complex stability study. We do not just present pass/fail results; we deliver the underlying chromatographic data that proves the integrity of the assay.
- Nominal vs. Observed Concentration Tables: Clear datasets showing the exact calculated concentrations of your target compounds before and after each individual thermal cycle. This table allows researchers to instantly identify at which specific cycle a compound begins to fail.
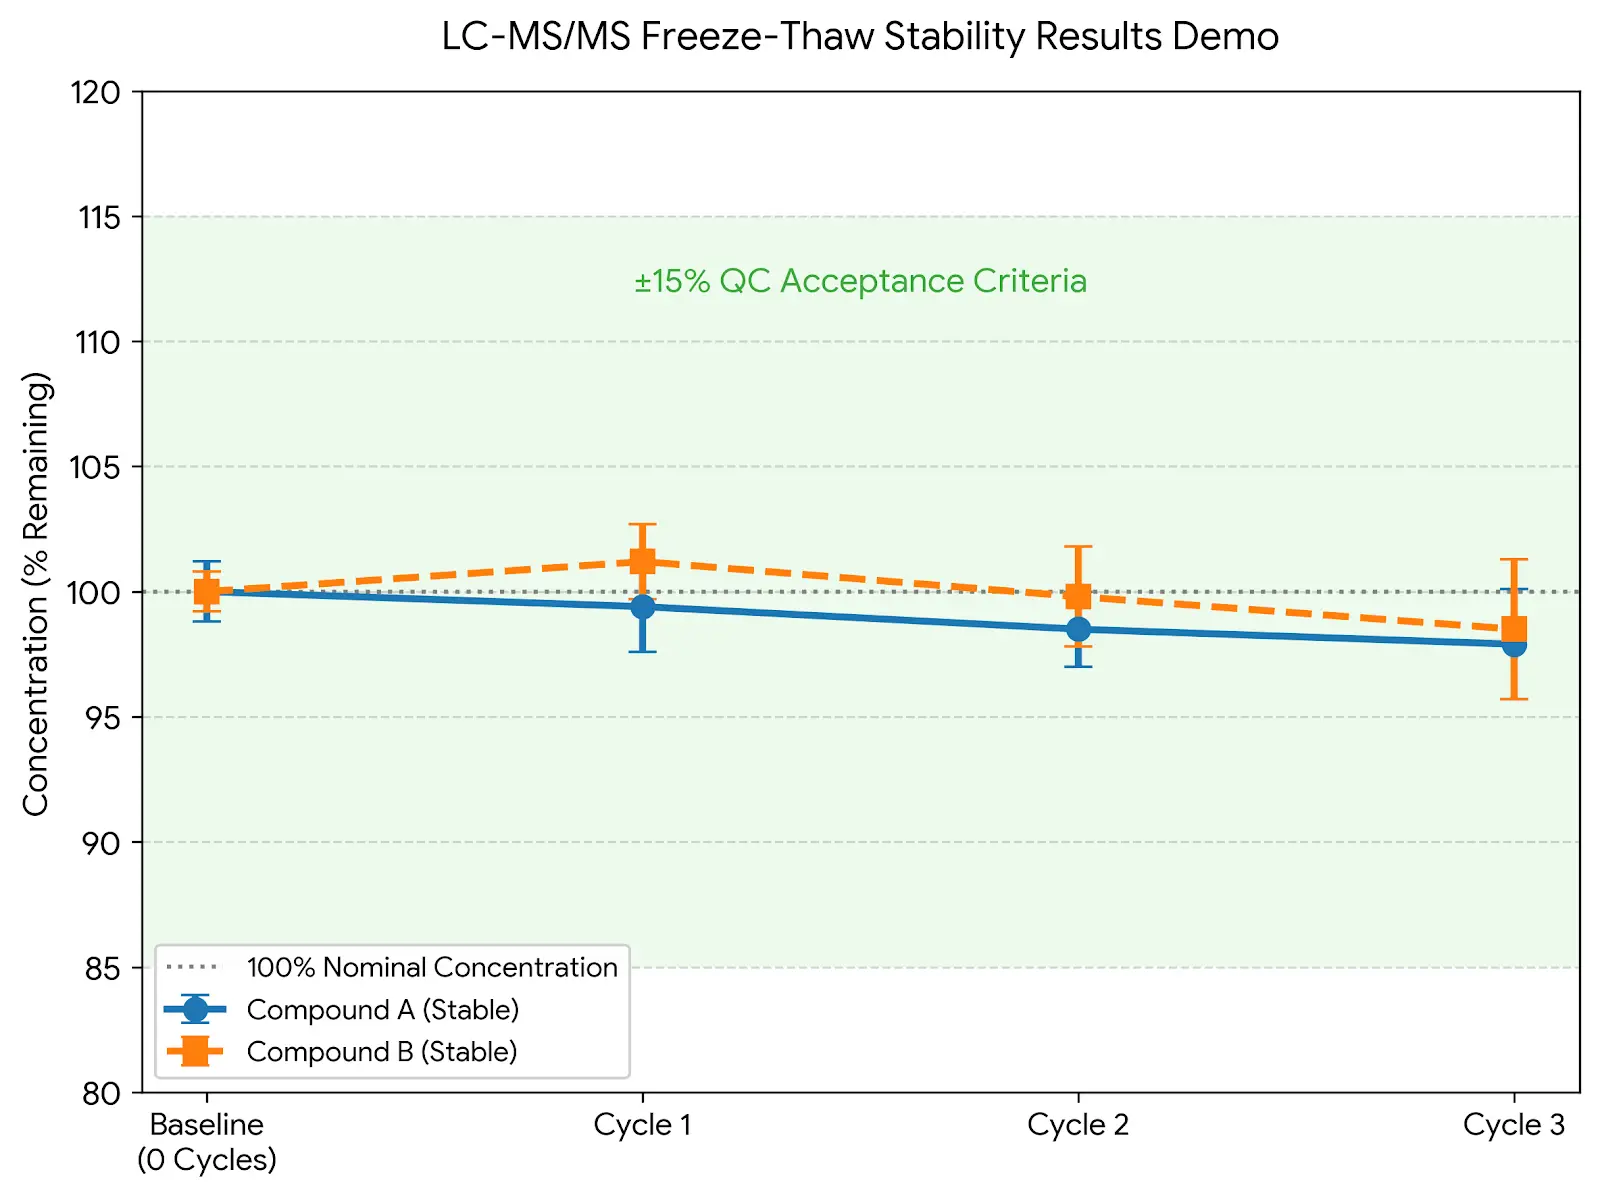
- Percentage Remaining (% Remaining) Charts: Visual degradation tracking demonstrating the exact percentage of compound integrity maintained across multiple freeze-thaw events. These charts are plotted with strict ±15% acceptance criteria bounds to provide immediate visual confirmation of stability.
- Accuracy & Precision Data: Quantitative tables summarizing the intra-day and inter-day Coefficient of Variation (CV%), proving the reproducibility of the stability assay. Consistently low CV% values guarantee that our extraction methods are not introducing artificial variance.
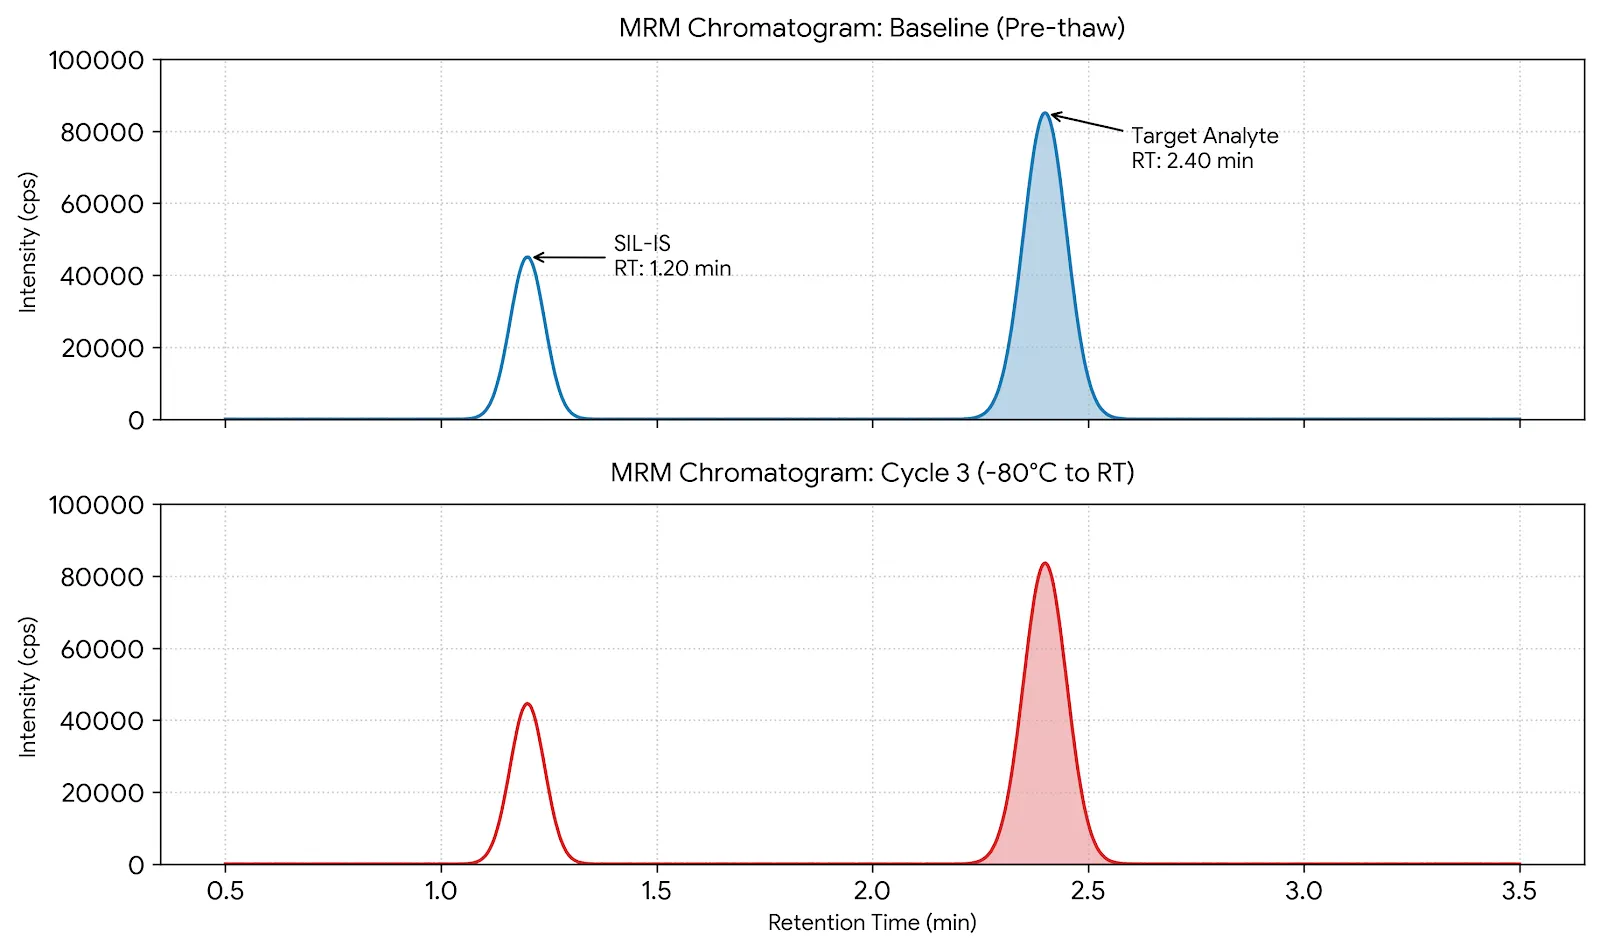
- Representative MRM Chromatograms: Visual proof demonstrating clear baseline separation of the target compound from dense endogenous background noise, recorded pre- and post-thaw. This is critical for proving that thermal degradants are not co-eluting with the parent drug.
- Summary Spreadsheet: Final calculated concentration data rigorously formatted for immediate integration into your internal research reports, formulation optimization protocols, or scientific publications.