Our data packages include the quantitative metrics required to verify the success of complex metabolic studies:
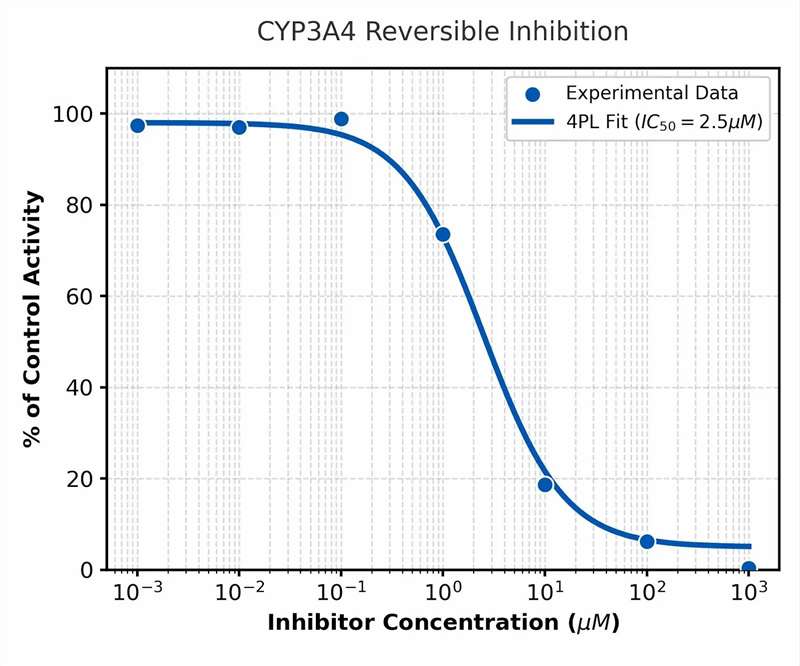
- Seven-Point IC50 Profiles: Non-linear regression plots for all major CYP isoforms.
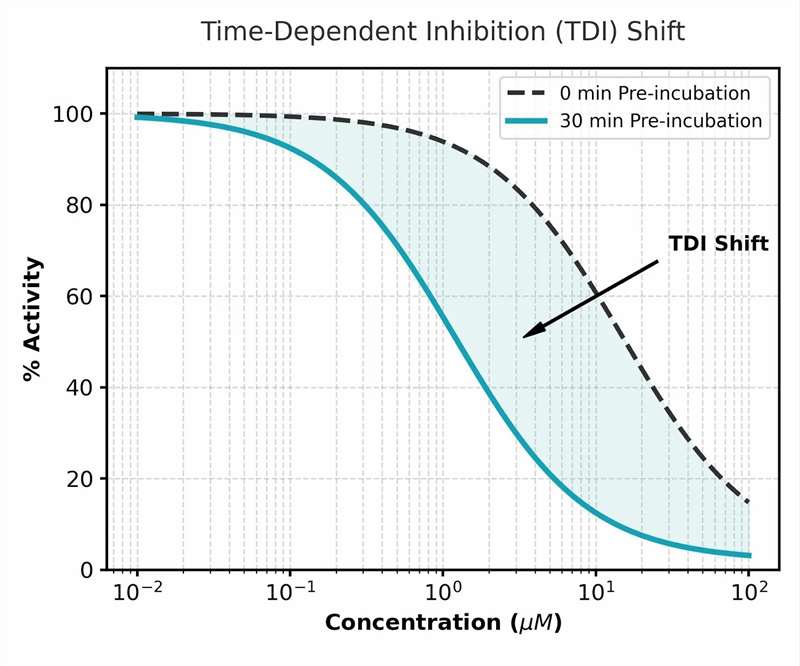
- TDI Shift Curves: Comparison of values with and without pre-incubation to identify irreversible inactivation.
- mRNA Induction Histograms: Bar charts showing fold-induction levels calibrated against positive controls.
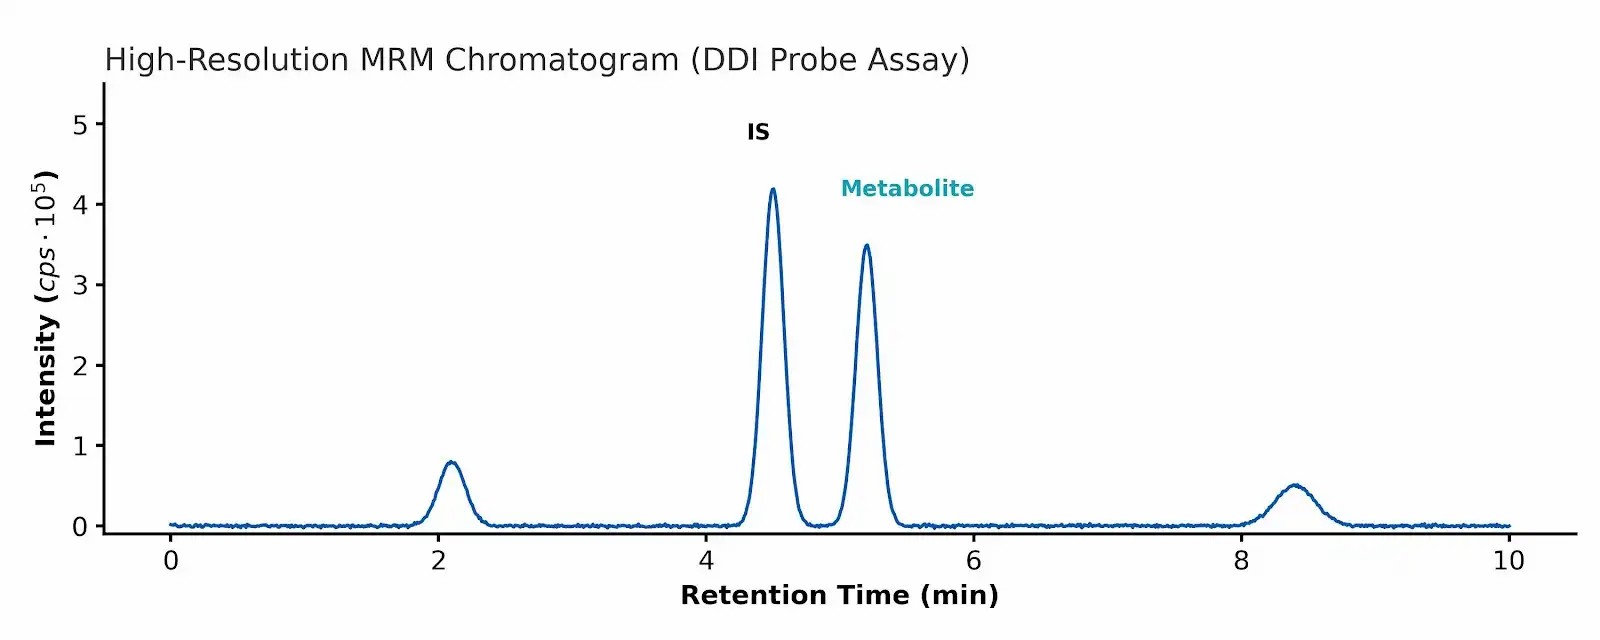
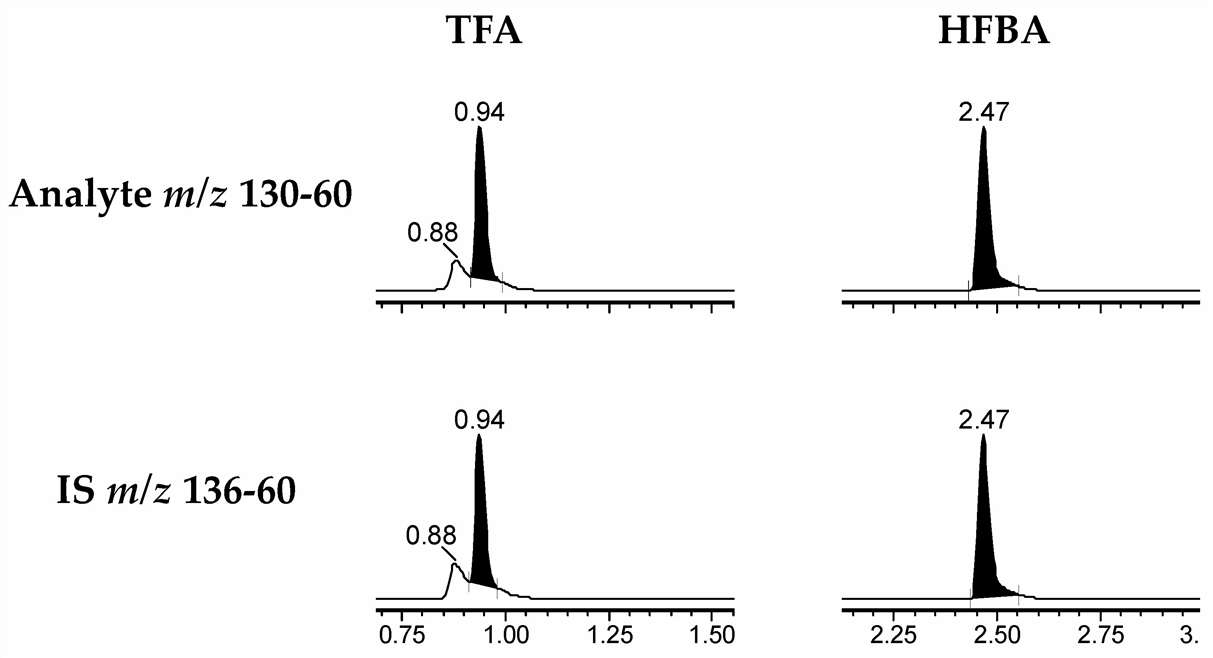
- Representative MRM Chromatograms: Visual proof of sensitivity and baseline separation in complex matrices.
- Transporter Efflux Ratios: Quantitative transport kinetics across polarized cell monolayers.
- fm Breakdown: Graphical pie charts identifying the metabolic contribution of individual enzymes.