ISO 17025–ACCREDITED LABORATORY ENVIRONMENT

LC-MS/MS Drug Quantification in Tissue and Cell Lysates

Quantifying drug exposure in solid tissues and intracellular compartments requires more than standard plasma protocols. We provide end-to-end bioanalytical services to solve severe matrix effects, thermal degradation, and lipid interference in complex biological samples.

Our specialized workflows deliver absolute certainty for your preclinical distribution and intracellular uptake studies.

Targeted Matrix Effect Resolution

Advanced extraction protocols for high-lipid and high-protein matrices.

Methodological Rigor

Validated surrogate matrix approaches for endogenous baseline correction.

Ready-to-Use Data

Final concentrations normalized to tissue weight or total cellular protein.

Matrix Challenge Extraction Methods Workflow & QC Sample Requirements Data Normalization Demo Results Case Study FAQ

The Matrix Challenge: Why Tissue & Lysate Bioanalysis Requires Specialized Methodologies

Standard blood or plasma bioanalysis methods frequently fail when applied directly to solid matrices. The physical and chemical complexity of tissue homogenates introduces significant analytical hurdles that can compromise data integrity if not properly managed.

  • Lipid-Induced Ion Suppression: Tissues such as brain, adipose, and liver contain massive amounts of endogenous phospholipids. These lipids co-elute with target analytes, causing severe ion suppression or enhancement in the mass spectrometer source.
  • Enzymatic Degradation During Processing: The mechanical friction involved in tissue homogenization generates heat. This thermal stress, combined with the release of intracellular enzymes (esterases, proteases), rapidly degrades chemically unstable or prodrug compounds before extraction even begins.
  • Non-Specific Binding: Highly lipophilic drugs often exhibit extensive non-specific binding to the plastic walls of homogenization tubes or the precipitated protein pellets, leading to artificially low recovery rates.
  • The "Blank Matrix" Dilemma: For endogenous biomarkers or specific rare tissues, obtaining a true "blank" is often impossible, necessitating complex alternative strategies.

As a specialized tissue homogenate PK bioanalysis CRO, we engineer targeted extraction and stabilization protocols to bypass these matrix-specific challenges, ensuring your limits of quantification (LLOQ) remain intact.

Overcoming Matrix Effects: Sample Preparation Strategies for Solid Matrices

Matrix effect resolution is the cornerstone of reliable tissue and cell lysate quantification. Relying solely on internal standards to correct for massive ion suppression masks underlying methodological flaws. We evaluate the physicochemical properties of your compound against the target matrix to select the optimal sample preparation strategy.

Sample Extraction Comparison for Tissue Bioanalysis

Extraction Method Lipid Removal Efficiency Suitability for Polar Compounds Processing Complexity Cost-Effectiveness Best Application Scenarios
Protein Precipitation (PPT) Low High Low High Initial screening; low-lipid tissues (e.g., muscle); hydrophilic compounds.
Liquid-Liquid Extraction (LLE) High Low to Moderate Moderate Moderate Lipid-rich matrices (e.g., brain); highly lipophilic drugs; neutral compounds.
Solid-Phase Extraction (SPE) Very High High High Lower Complex endogenous interference; simultaneous extraction of parent and multiple metabolites.

Solution Selection Strategy

Our DMPK scientists apply stringent decision rules to formulate the extraction protocol:

  • For Lipid-Rich Tissues: We mandate LLE or phospholipid-removal SPE plates for brain, adipose, and spinal cord tissues. This prevents instrument contamination and ensures baseline stability across large sample cohorts.
  • For Intracellular Drug Concentration Analysis LC-MS/MS: Cell lysates often contain high concentrations of lysis buffer salts and detergents (like SDS or Triton X-100). We utilize tailored SPE washing steps to eliminate detergent-induced ion suppression before elution.
  • For Tumor Penetration Studies: When analyzing oncology drugs in necrotic tumor core biopsies, we employ multi-step extraction to isolate the active compound from highly degraded protein fragments.

Standardized Workflow & QC Checkpoints for Tissue/Cell Samples

We implement strict quality control (QC) checkpoints at every step of the analytical workflow to prevent sample loss and ensure regulatory compliance.

1. Cryogenic Homogenization & Stabilization

Process: Tissues are weighed and homogenized using bead-beating or ultrasonication in a tightly temperature-controlled environment.

QC Checkpoint: For thermally unstable compounds, we utilize cryogenic homogenization (processing with dry ice or liquid nitrogen) and pre-spike the homogenization buffer with specific enzyme inhibitors to halt biological degradation instantly.

2. Surrogate Matrix Selection for Calibration Curves

Process: When an analyte is endogenous, or when control tissue is exceedingly rare, we execute a custom LC-MS/MS method development strategy using an alternative matrix.

QC Checkpoint: We validate either a "surrogate analyte in authentic matrix" approach or a "surrogate matrix (e.g., BSA solution, PBS, or stripped plasma) with authentic analyte" approach. Parallelism is strictly tested to confirm that the surrogate curve accurately reflects the authentic tissue extraction efficiency.

3. LC-MS/MS Analysis & Recovery QC

Process: Extracted samples are injected into high-resolution LC-MS/MS systems utilizing optimized MRM transitions.

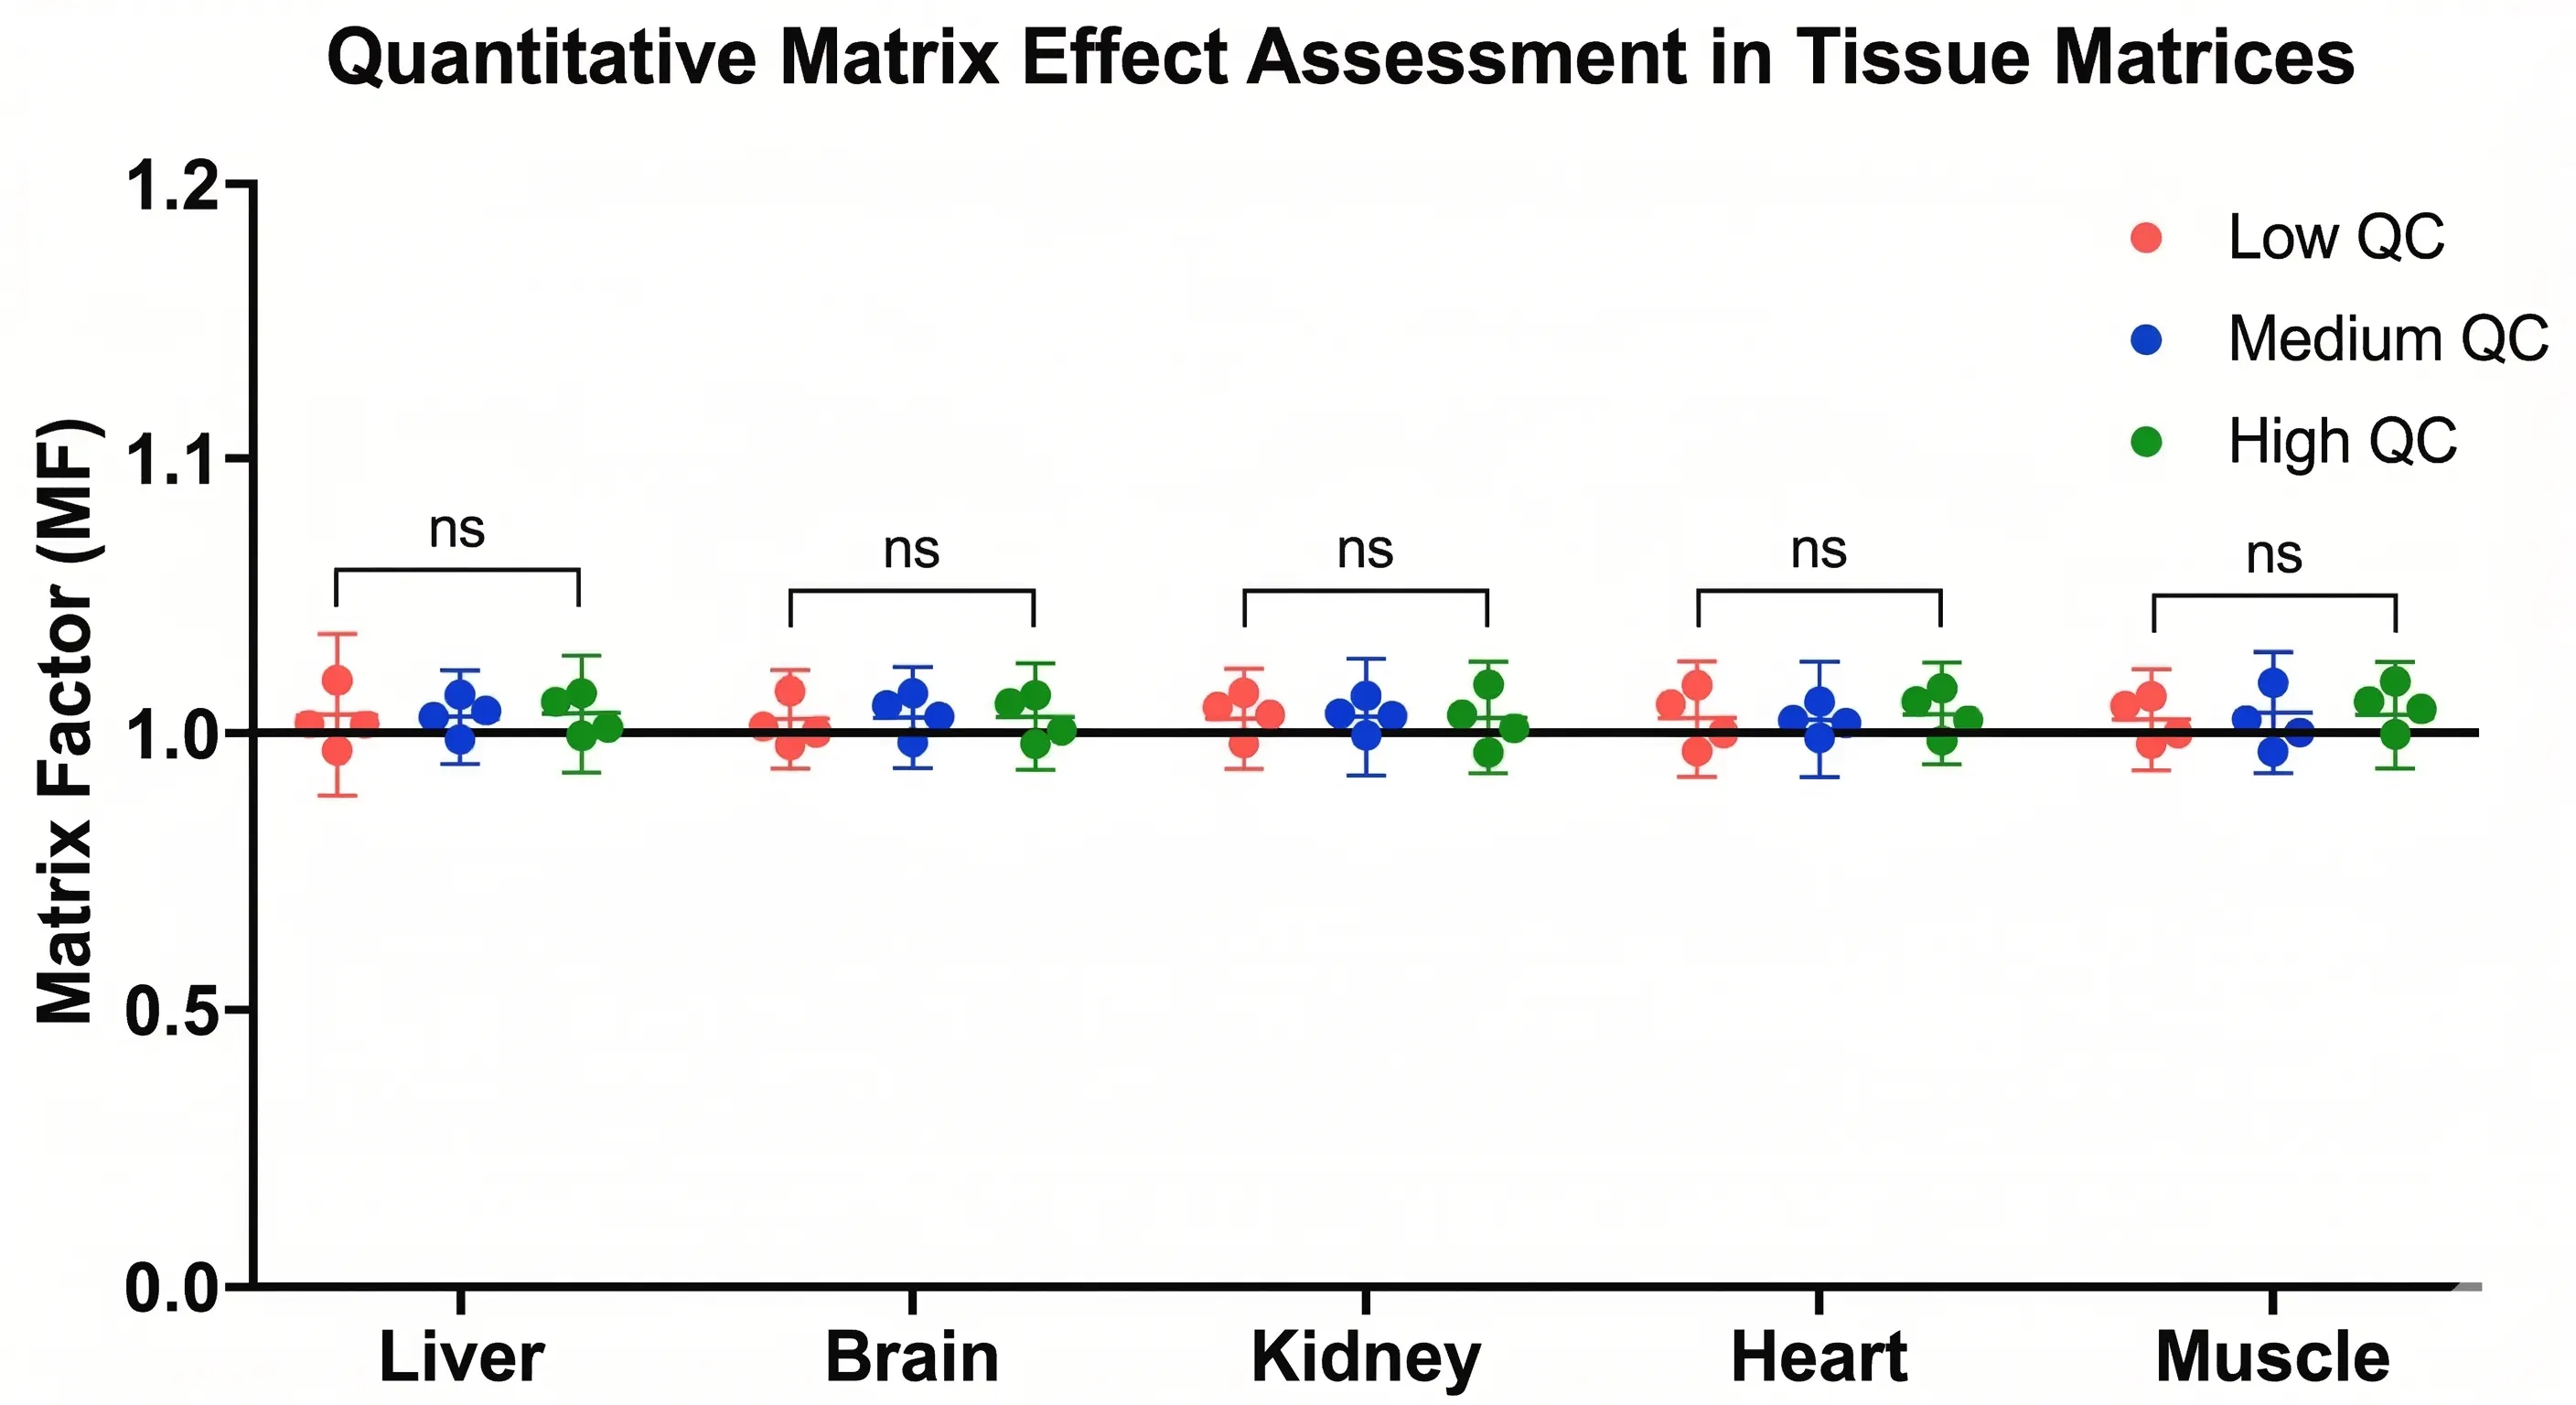
QC Checkpoint: We incorporate stable isotope-labeled (SIL) internal standards prior to homogenization whenever possible. Matrix factor (MF) and extraction recovery (RE) are calculated at Low, Medium, and High QC levels to ensure the method's robustness against varying tissue weights.

Sample Requirements & Shipping Guidelines

Proper sample collection and transit are critical for tissue bioanalysis. Degradation during shipping is a leading cause of project failure. Please adhere to the following specifications when preparing your samples.

Sample Type Minimum Recommended Input Container Specification Shipping Conditions Critical Notes
Solid Organs (Liver, Kidney, etc.) 50 - 100 mg Pre-weighed, labeled cryovials Dry Ice (-80°C) Record exact wet weight before freezing. Do not add buffer unless instructed.
Brain / Adipose Tissue 30 - 50 mg Pre-weighed, labeled cryovials Dry Ice (-80°C) Extremely lipid-rich; requires specific pre-chilled containers.
Tumor Biopsies 20 - 50 mg Tightly sealed microcentrifuge tubes Dry Ice (-80°C) Remove excess blood or necrotic tissue prior to freezing.
Cell Pellets 1 × 10⁶ cells Conical tubes Dry Ice (-80°C) Wash thoroughly with ice-cold PBS to remove extracellular drug before pelleting.
Cell Lysates 100 - 200 µL Microcentrifuge tubes Dry Ice (-80°C) Provide details of the lysis buffer composition (salts, detergents) to avoid LC-MS/MS interference.

Data Normalization & Bioinformatics Analysis

Raw LC-MS/MS data from tissue homogenates (e.g., ng/mL in the sample vial) is biologically meaningless until it is properly normalized to the original sample volume or mass. We provide comprehensive data bioinformatics, ensuring your results are immediately ready for pharmacokinetic modeling.

Minimum Deliverables

  • Raw Homogenate Concentration: Absolute drug concentration measured in the extracted vial (ng/mL).
  • Normalized Tissue/Cell Concentration: For tissues, data is mathematically converted to ng/g of wet tissue. For cell lysates, we employ BCA protein assay normalization to report intracellular exposure as ng/mg of total cellular protein, correcting for varying cell counts per well.
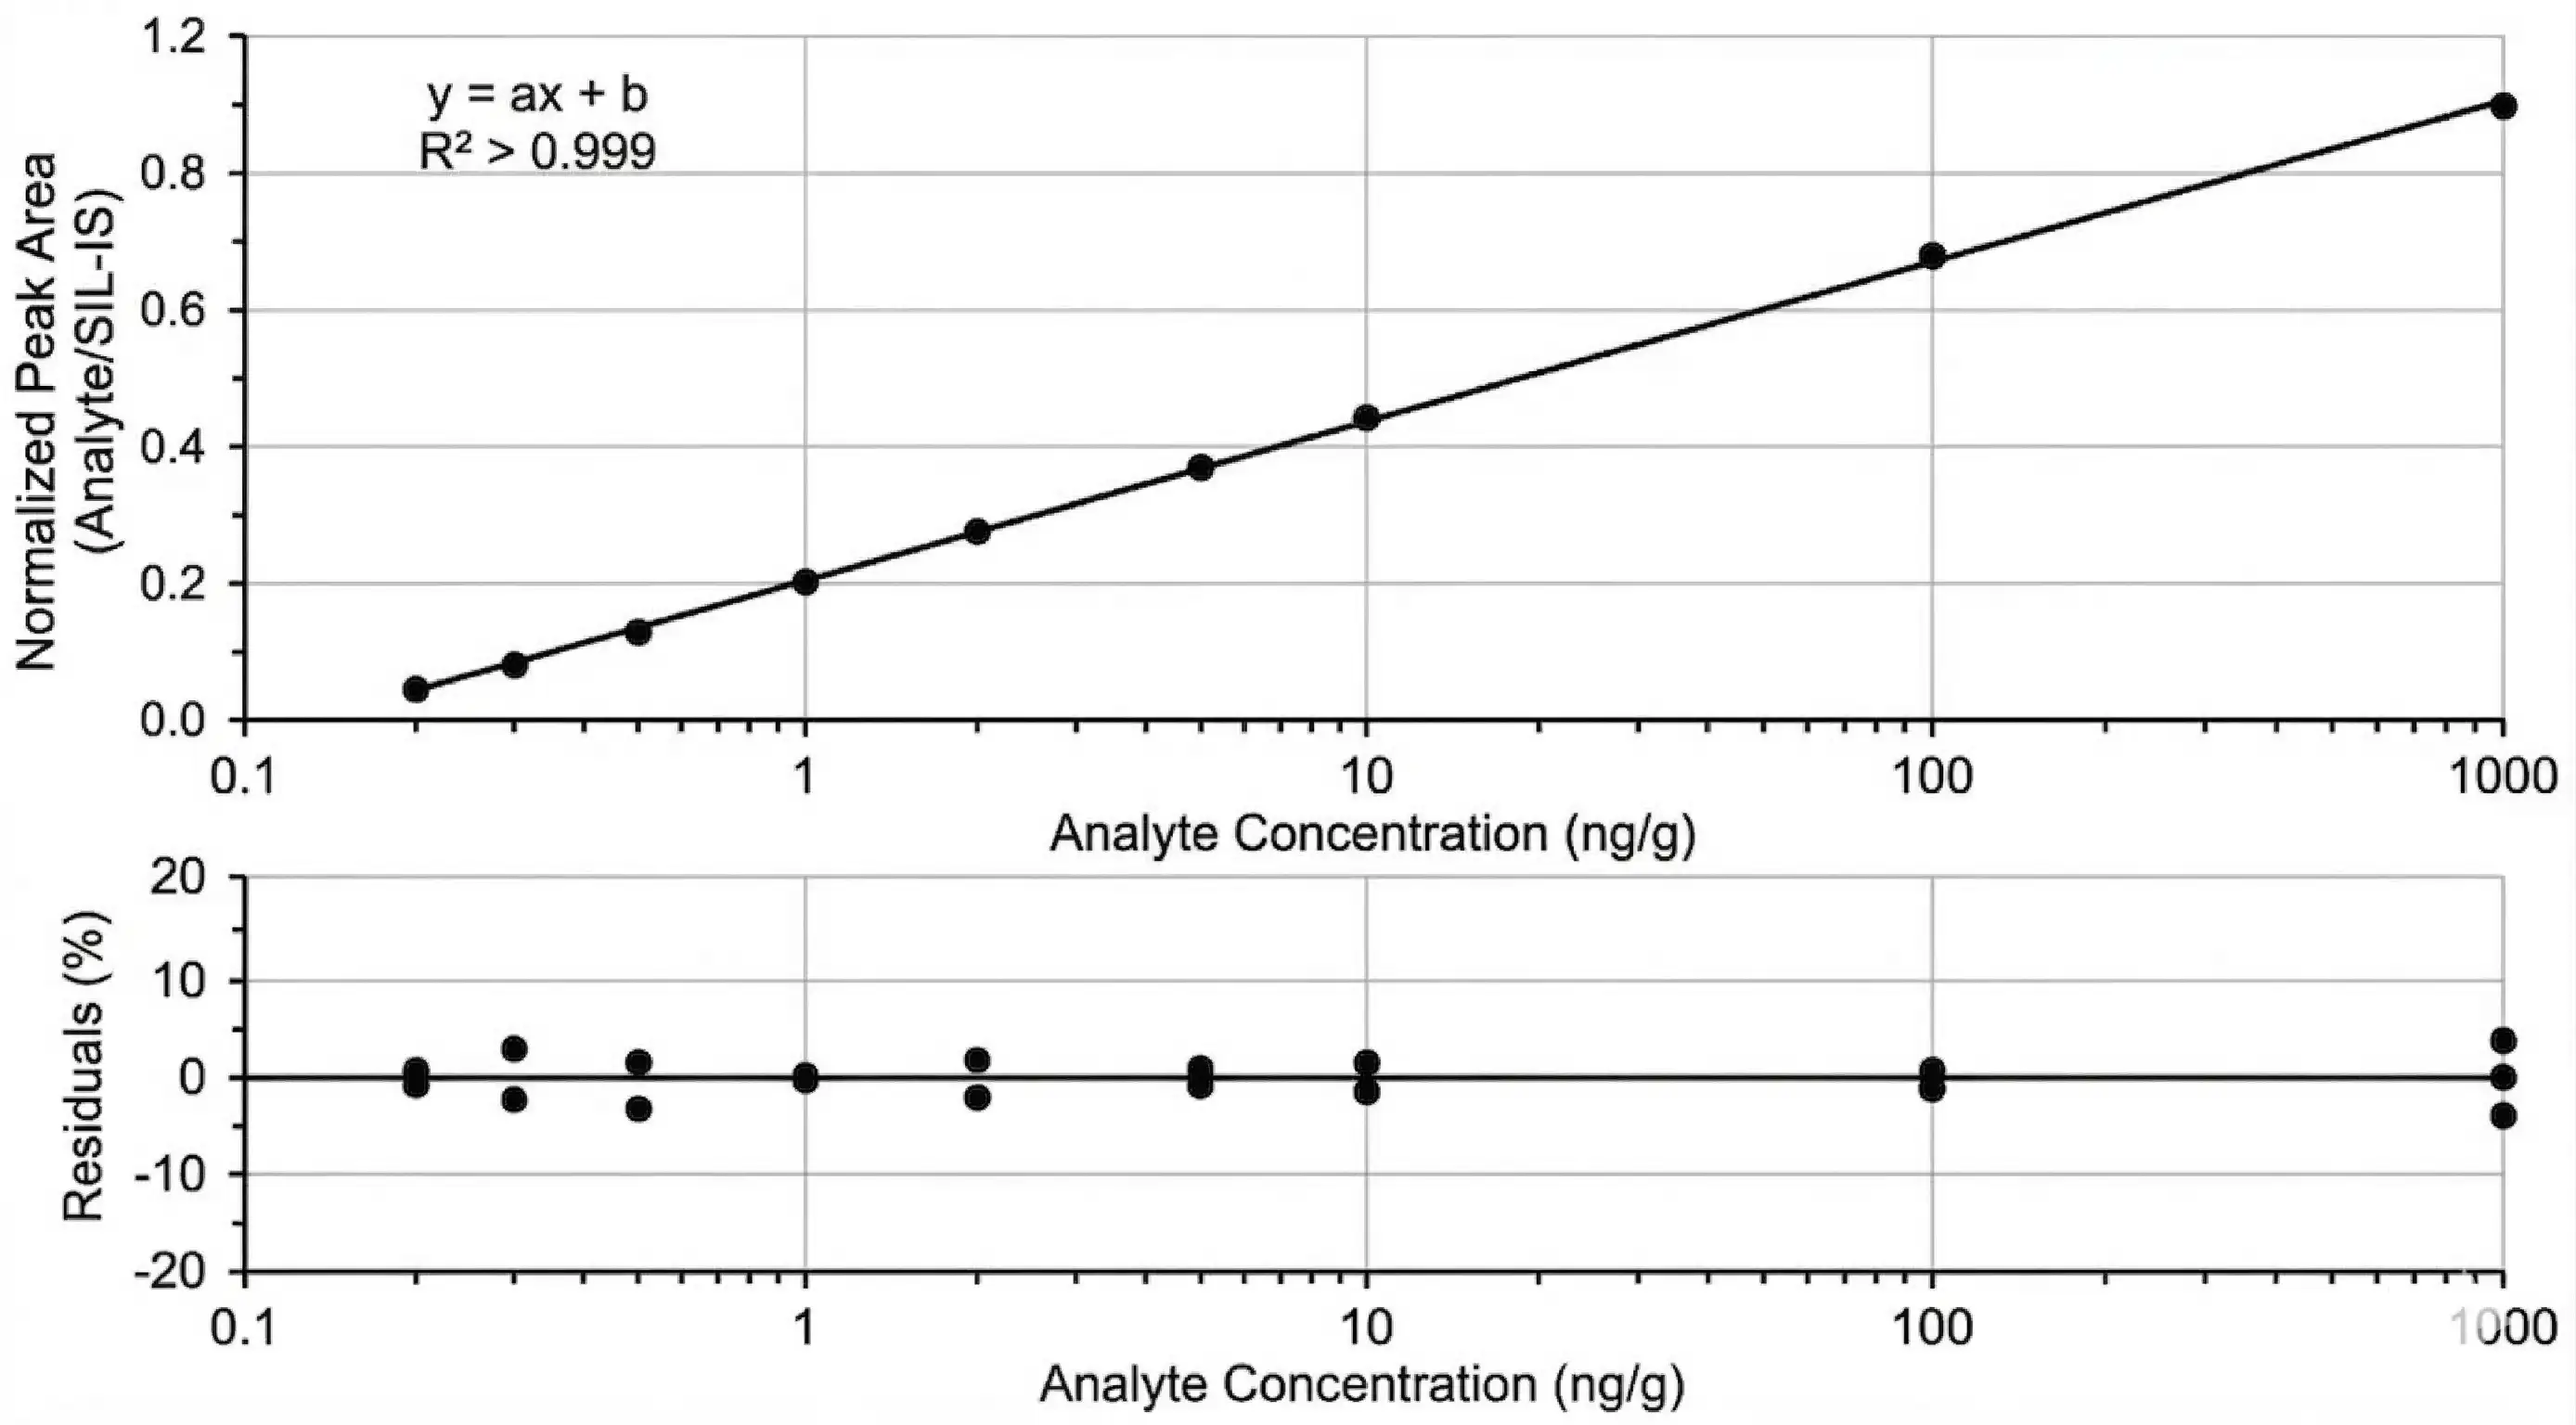
  • Method Validation & QC Summary Report: Comprehensive documentation detailing accuracy, precision, calibration curve linearity, and matrix effect evaluation.

Optional Add-Ons

  • Tissue-to-Plasma Partition Coefficient (Kp) Calculation: Essential for understanding drug distribution and potential accumulation in target organs versus systemic circulation.
  • Graphical Tissue Distribution Profiles: Visualizations mapping drug concentration across multiple organs over specific time points.

Demo Results: What Your Final Data Package Looks Like

We believe in complete data transparency. Our data packages are designed to withstand stringent internal reviews and external audits.

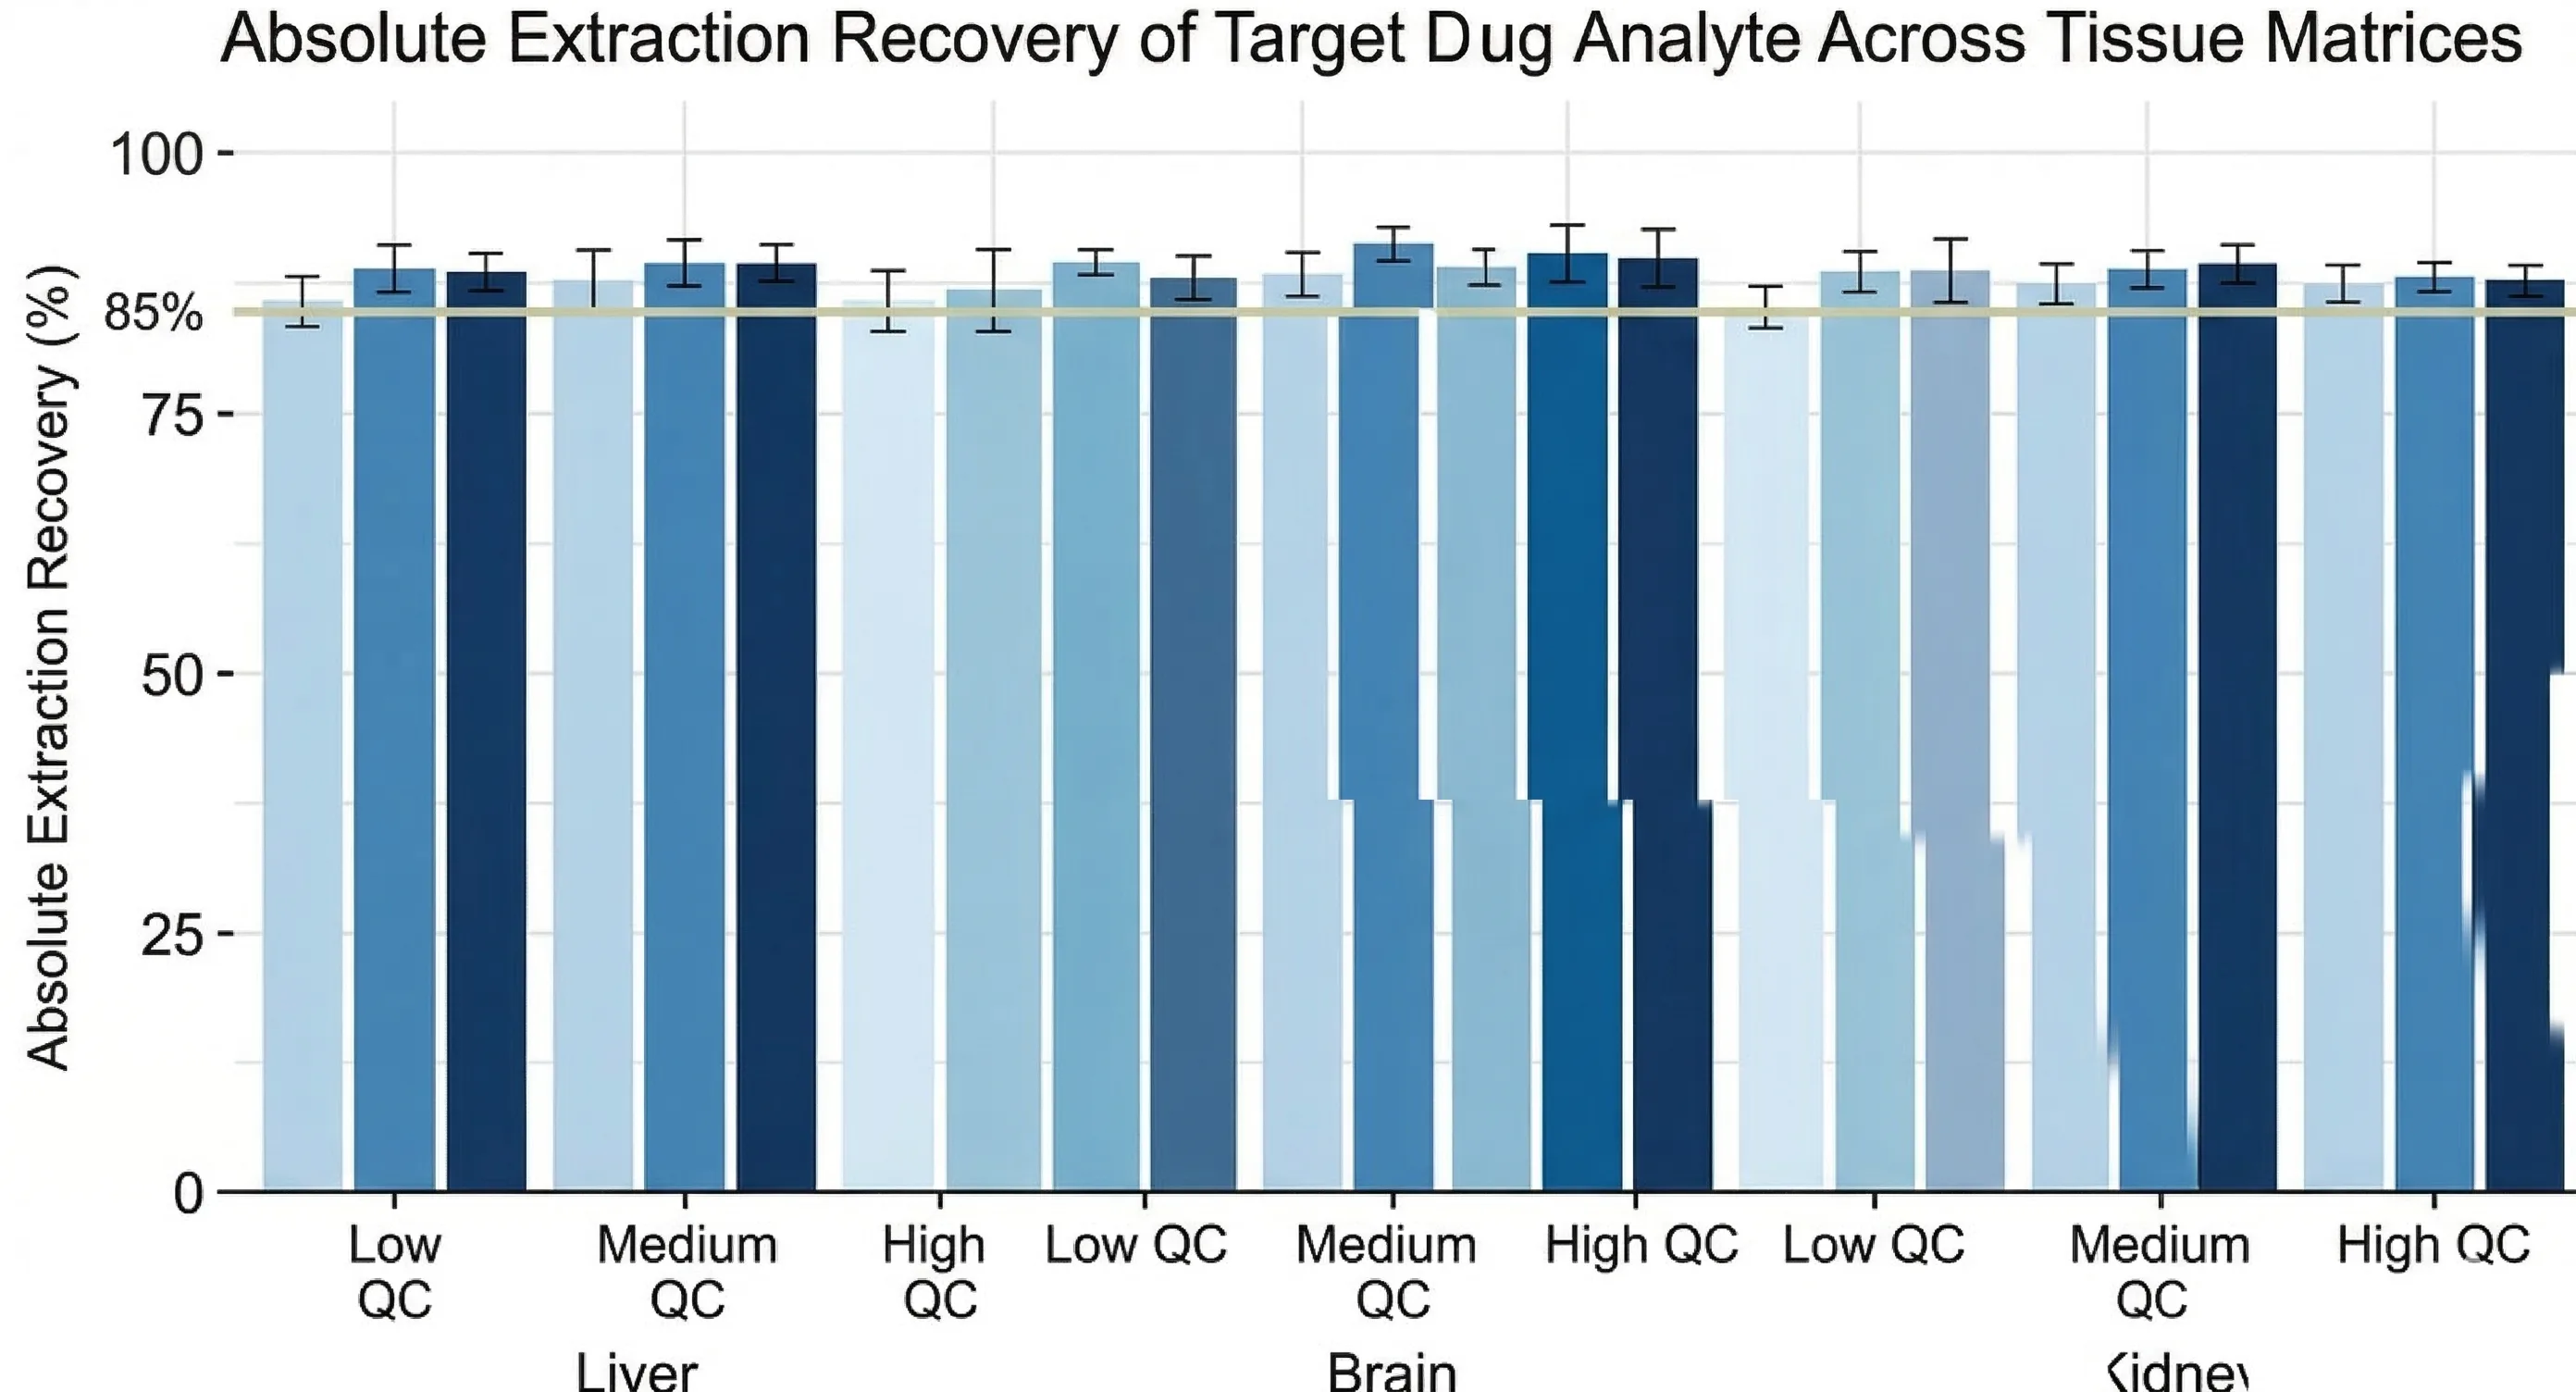
  • Matrix Effect & Recovery Metrics: You will receive detailed summary tables documenting the absolute extraction recovery and the matrix factor. We showcase performance across multiple concentration tiers (LQC, MQC, HQC), proving that our extraction efficiency remains consistent regardless of the drug load in the tissue.
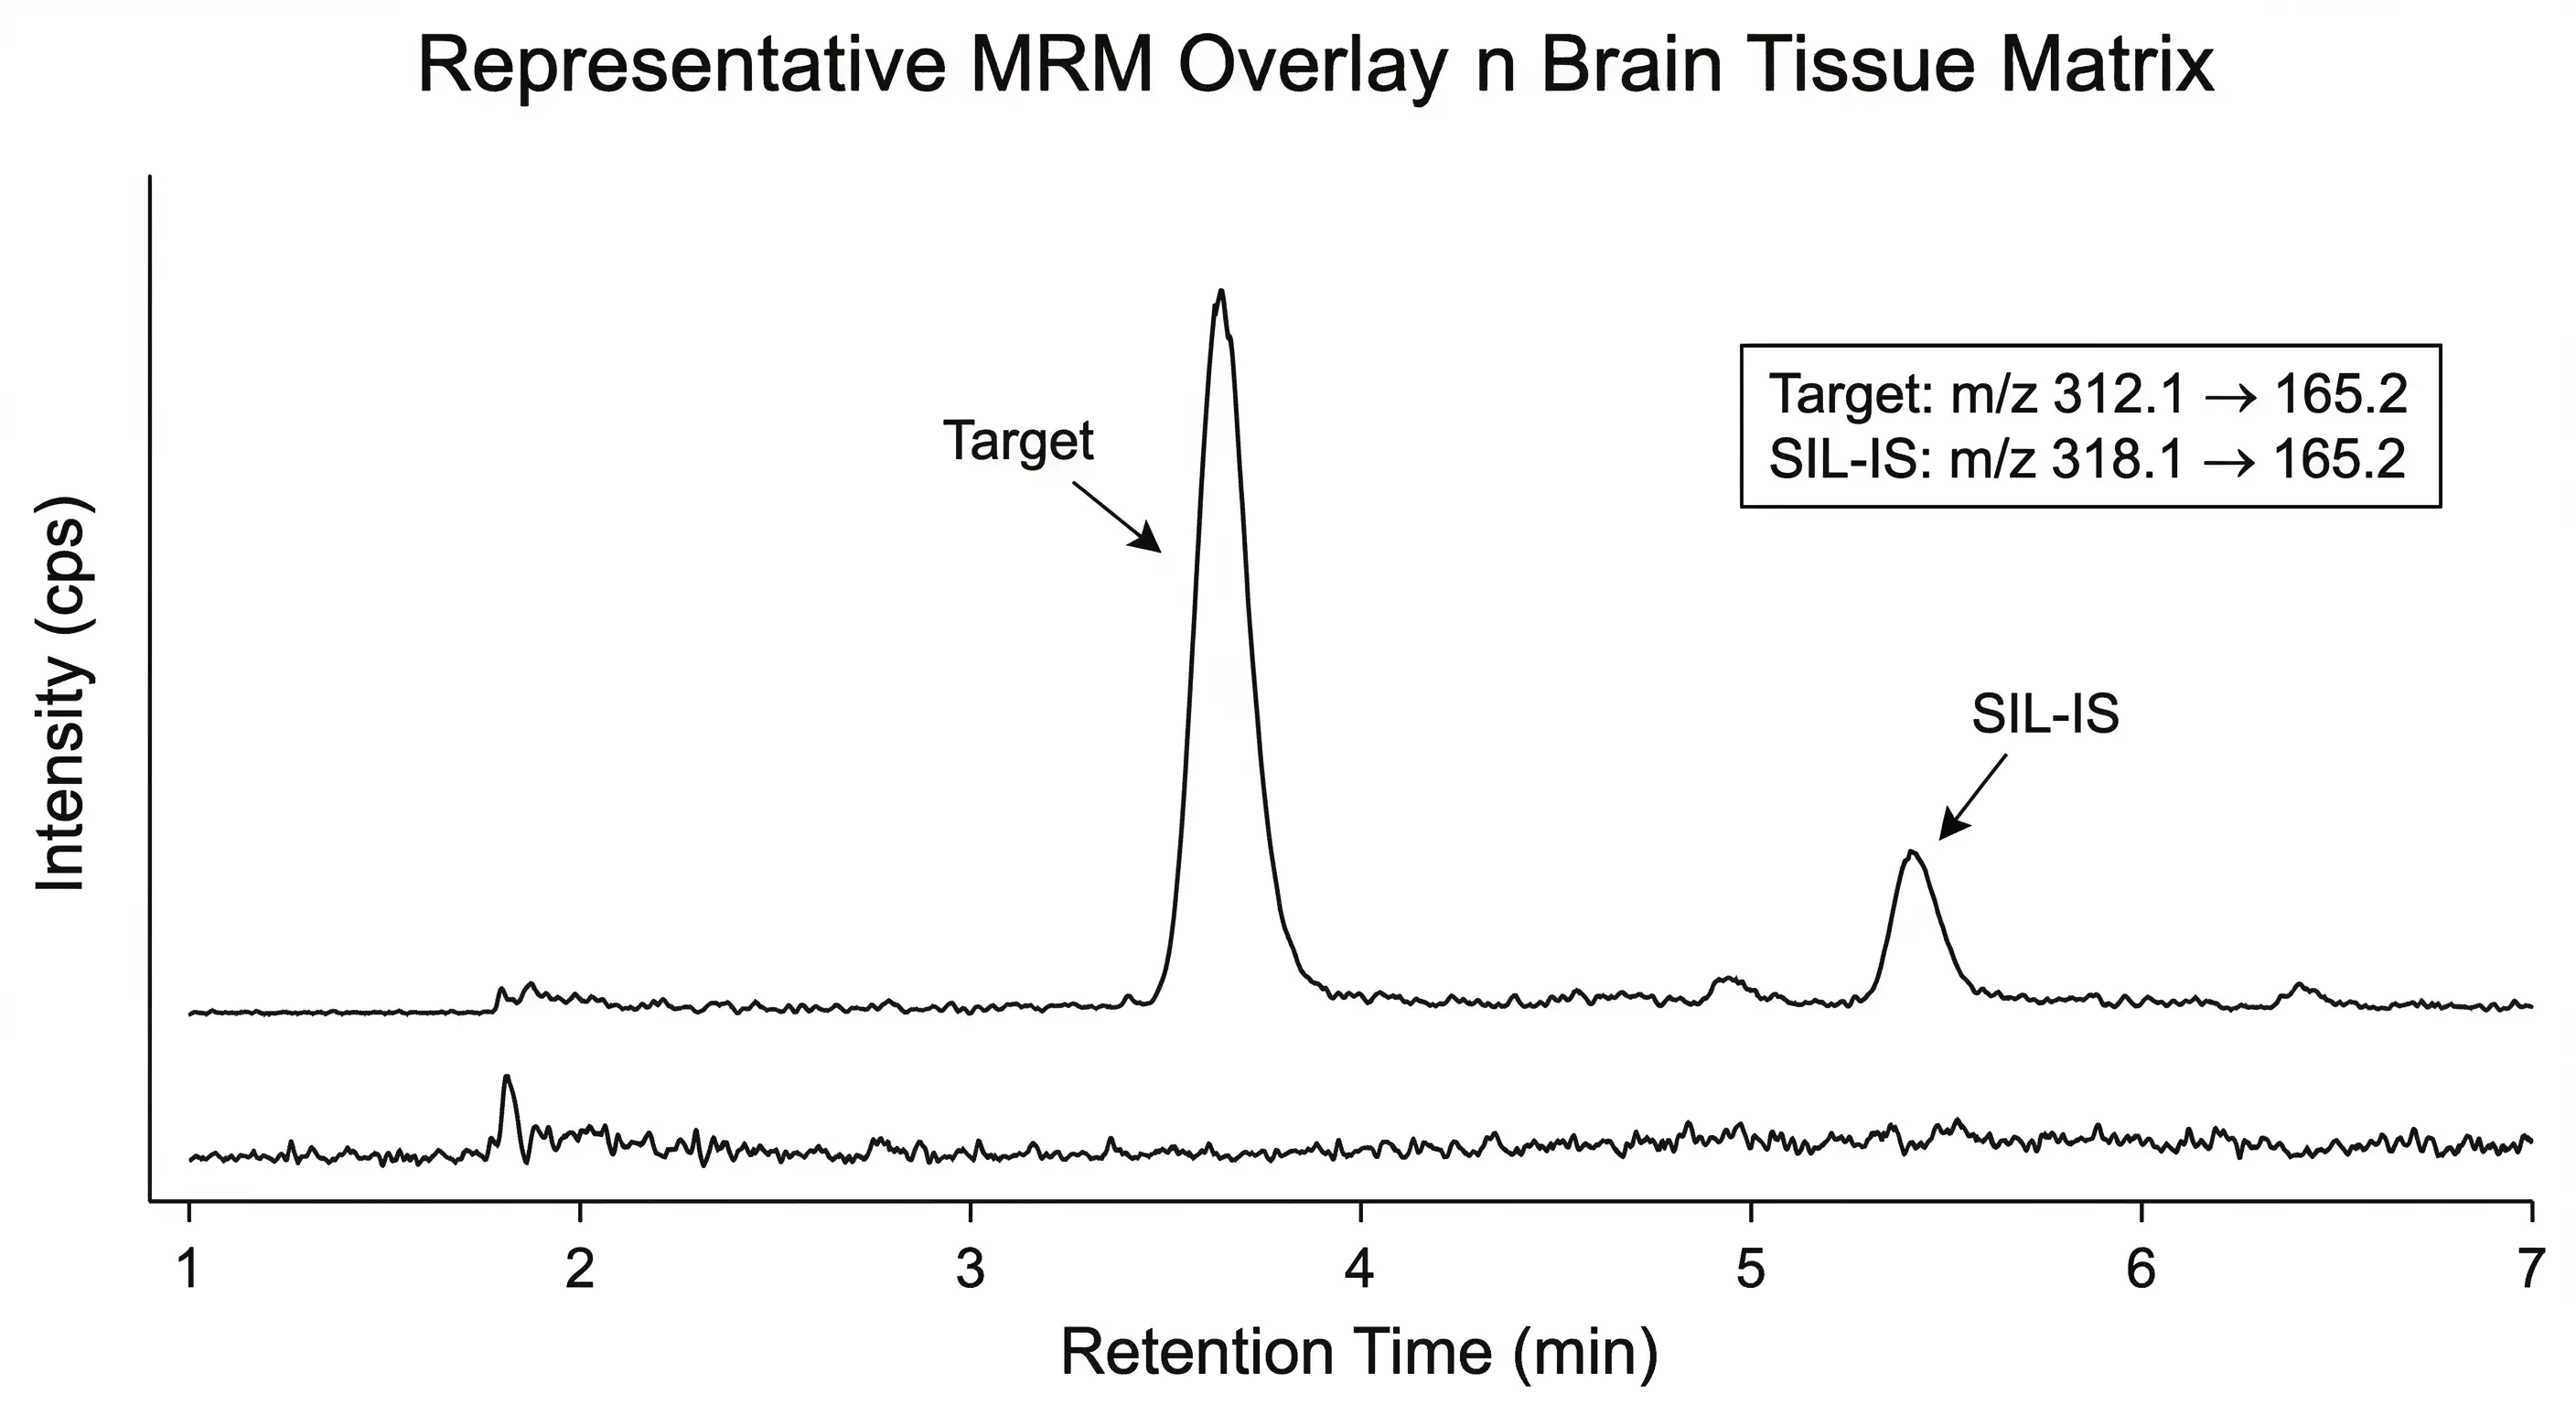
  • Representative Chromatograms: We provide visual proof of peak integration, baseline separation, and the absence of interfering endogenous peaks at the Lower Limit of Quantification (LLOQ).
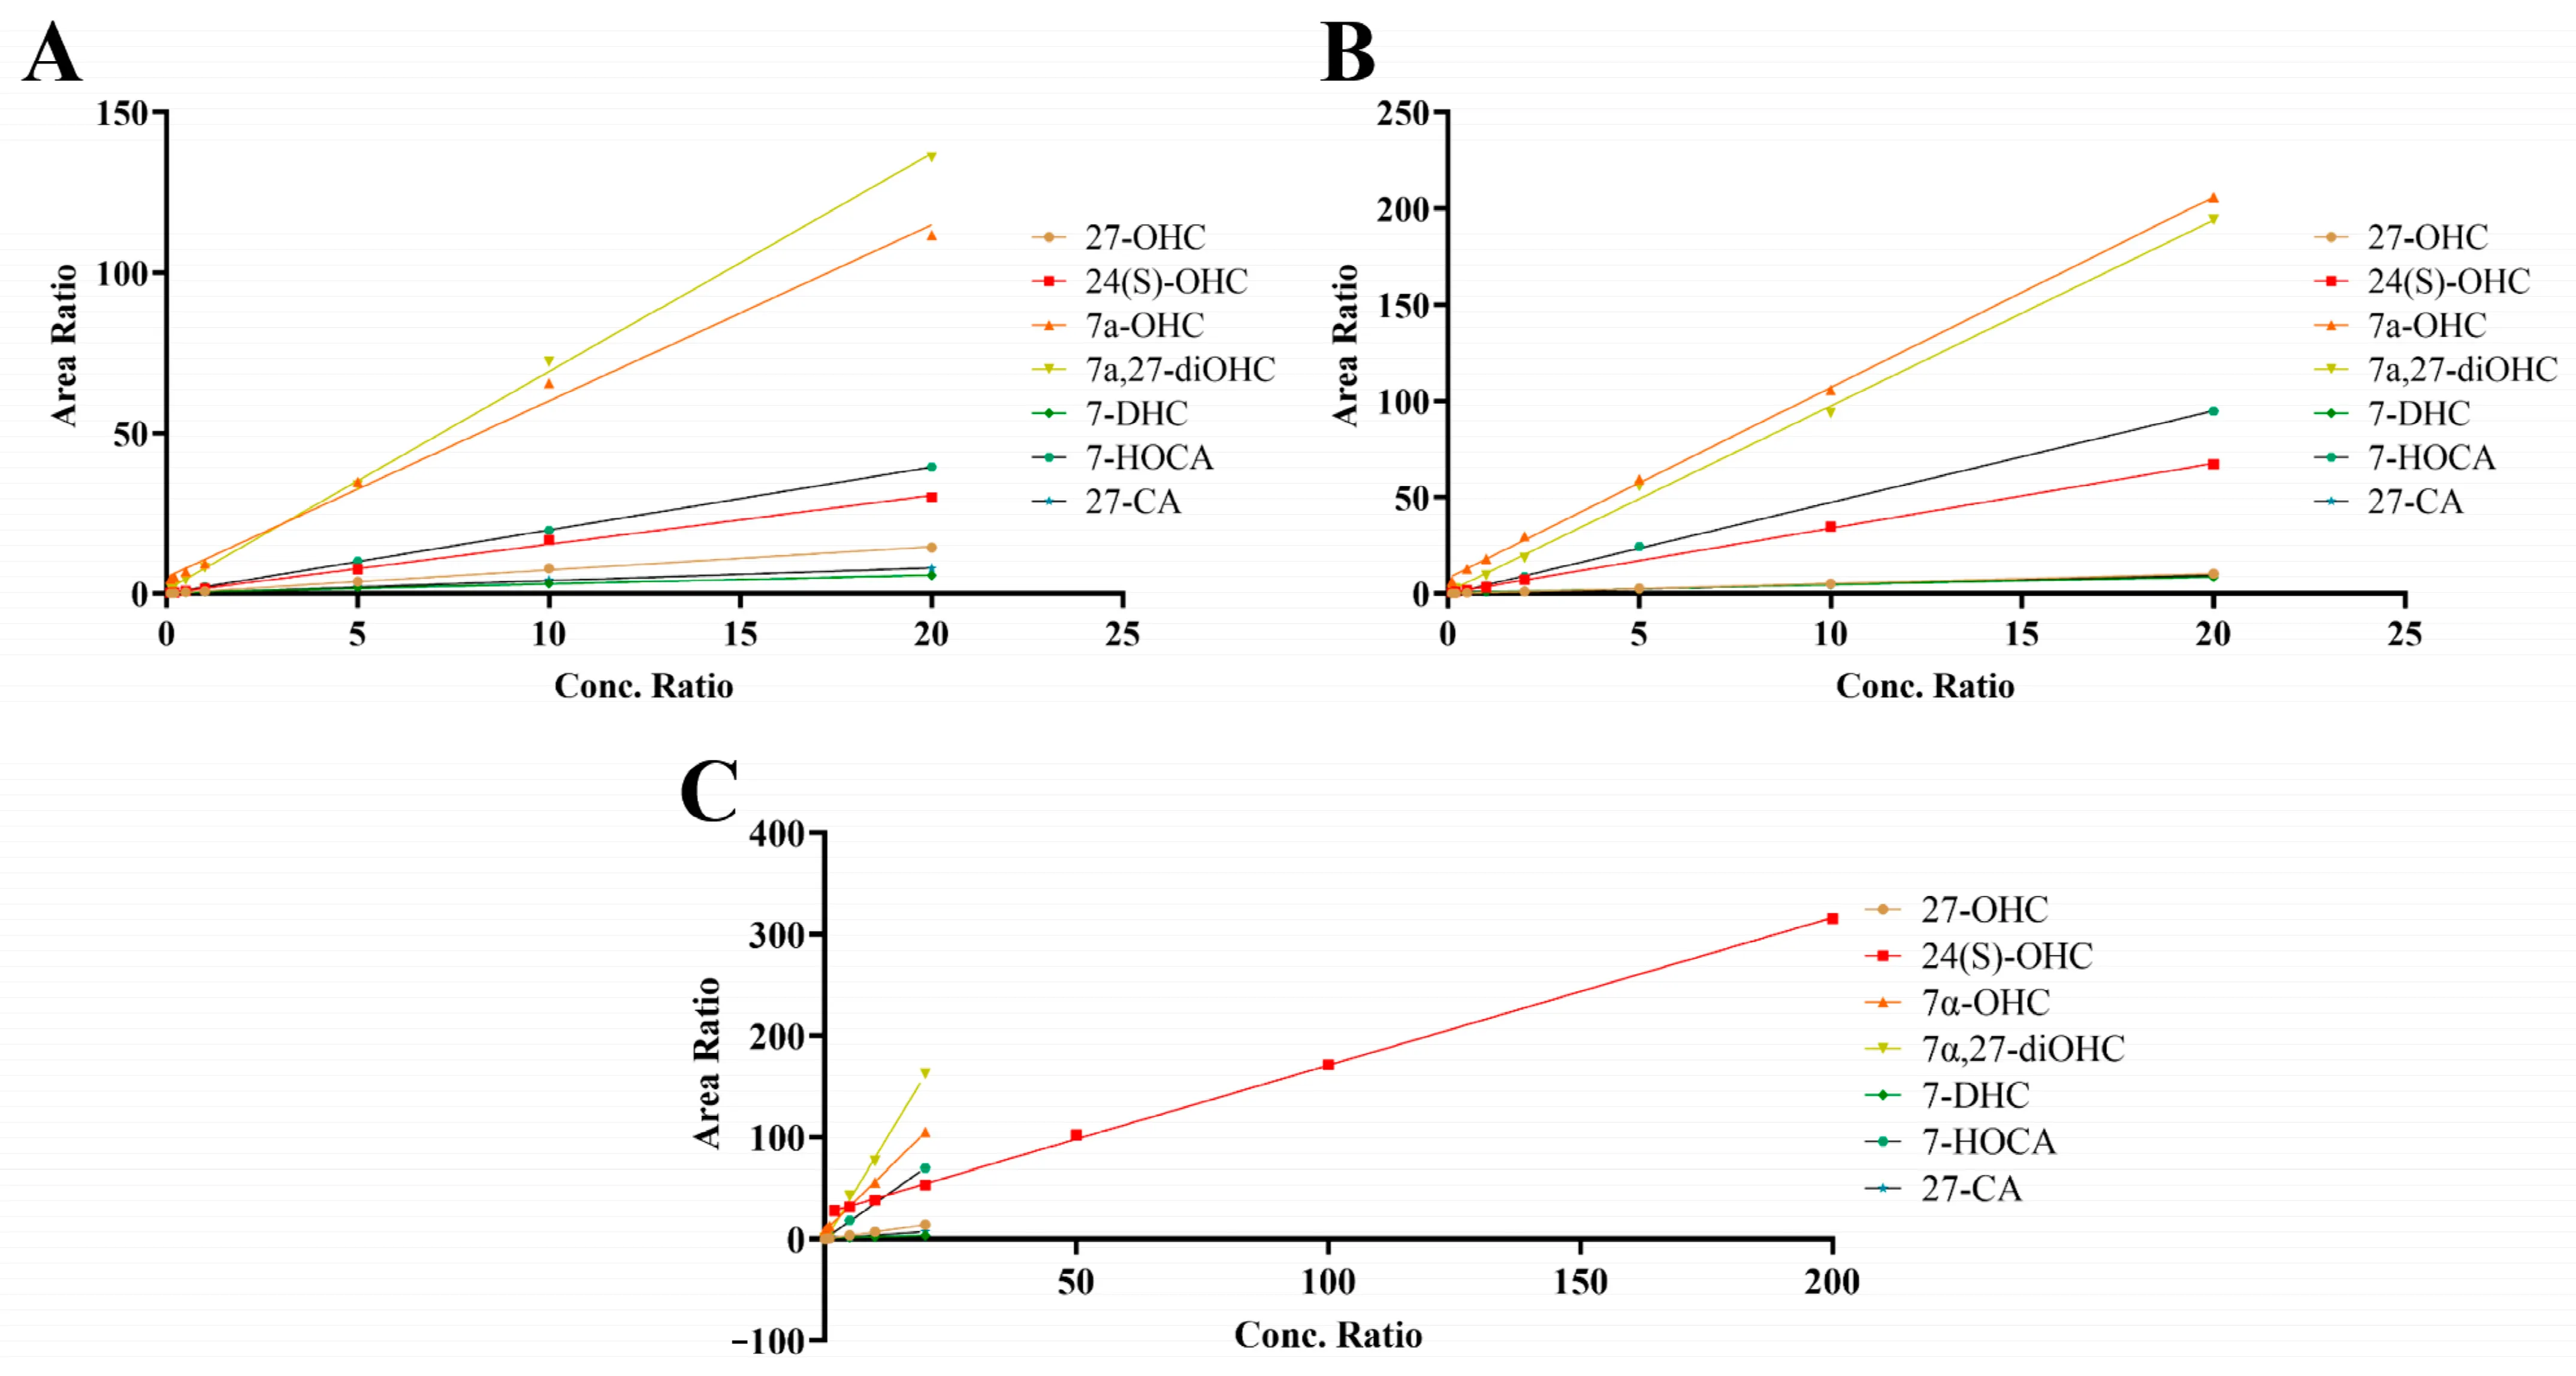
  • Normalized Data Sheet Snippets: Clear, auditable spreadsheets showing the step-by-step mathematical conversion from instrument response to final normalized tissue exposure metrics.
Case Study (Research Summary)

Source Paper

Scientific Reports (2024) 14:11018, doi:10.1038/s41598-024-61522-4

What the Paper Reports

This published method describes a validated LC-MS/MS workflow for simultaneous quantification of six analytes in mouse serum (SN-38, MTX, DXd, MMAE, MMAF, CM).

The paper reports a 35 min sample preparation, an 11 min chromatographic run, and a solvent system of methanol, water, and formic acid. It also summarizes validated performance including reported linear response ranges and recoveries, and notes an ultra-low sample volume of 5 µL serum in the described workflow.

This article is licensed under a Creative Commons Attribution 4.0 International License (CC BY 4.0).

Frequently Asked Questions

How do you choose a surrogate matrix for tissue calibration curves when blank tissues are unavailable?

We evaluate the target matrix's complexity. For highly specific tissues, we often utilize a surrogate matrix such as phosphate-buffered saline (PBS) containing bovine serum albumin (BSA), or diluted species-specific plasma. We strictly perform parallelism tests to guarantee that the calibration curve generated in the surrogate matrix behaves identically to the authentic biological sample.

What is your approach to normalizing drug concentrations in cell lysates?

Cell counts can vary dramatically between culture wells due to proliferation rates or drug toxicity. Therefore, simply reporting ng/mL of lysate is inaccurate. We routinely perform a BCA or Bradford protein assay on an aliquot of your lysate. The final intracellular drug concentration is then reported as ng of drug per mg of total cellular protein, providing a precise, standardized metric.

How do you prevent drug degradation during the mechanical tissue homogenization process?

Friction during homogenization generates heat that can destroy thermolabile compounds. We mitigate this through cryogenic homogenization techniques, utilizing pre-chilled beads and maintaining the samples on ice or dry ice. Additionally, if the analyte is susceptible to enzymatic cleavage, we spike the homogenization buffer with customized esterase or protease inhibitor cocktails prior to mechanical disruption.

Ready to Quantify Your Lead Compound or Metabolite?

Share your matrix type, sample count, and expected range—feasibility routing will confirm whether direct quantification is fit-for-purpose or method development is recommended.

inquiry
Online Inquiry