ISO 17025–ACCREDITED LABORATORY ENVIRONMENT

Parent-Metabolite Ratio Analysis Services

Accurate parent-metabolite ratio calculation is critical for assessing drug exposure, prodrug conversion, and disproportionate metabolite toxicity. Leveraging advanced high-throughput LC-MS/MS platforms, we deliver exceptionally sensitive, reproducible quantitative data.

We provide custom de novo method development to simultaneously analyze parent compounds and metabolites across biological matrices, empowering your early discovery decisions.

Validated Analytics

Validated LC-MS/MS quantitative bioanalysis.

Polarity Resolution

Simultaneous detection of extreme polarity profiles.

Exposure Calculation

Precision AUC and PK exposure ratio calculation.

Custom Methods

De novo method development for complex matrices.

Role of Parent-Metabolite Ratio PMR Analysis Workflow Sample Requirements Data Deliverables Platform Advantages Case Study

Decoding Drug Exposure: The Role of Parent-Metabolite Ratio

Unlike structural drug metabolite identification, which focuses primarily on finding unknown molecular structures and elucidating cleavage pathways, our ratio analysis services provide exact, objective numerical quantification. We precisely measure the Area Under the Curve (AUC) for both the parent drug and its key active or inactive metabolites over a specified time course.

This exposure ratio is absolutely vital for early-stage drug discovery and preclinical DMPK evaluation. It serves multiple critical scientific purposes. First, it helps pharmacologists determine if a specific metabolite meets the safety and toxicity thresholds defined by regulatory MIST (Metabolites in Safety Testing) guidelines. Under these industry-standard principles, if a human metabolite is formed at greater than 10% of total drug-related exposure at steady state, and is present at disproportionately lower levels in animal toxicity species, it requires separate safety evaluation. Accurate LC-MS/MS quantification is the only way to calculate this exact percentage.

Furthermore, accurate AUC ratio calculation maps the exact efficiency of prodrug activation. For prodrugs designed to improve solubility or permeability, researchers must confirm how rapidly and extensively the prodrug converts into the active pharmacophore within the target tissue or systemic circulation. High-precision quantitative data ensures your compound behaves exactly as expected before advancing further in your research pipeline, saving significant downstream investment.

Our LC-MS/MS PMR Analysis Workflow

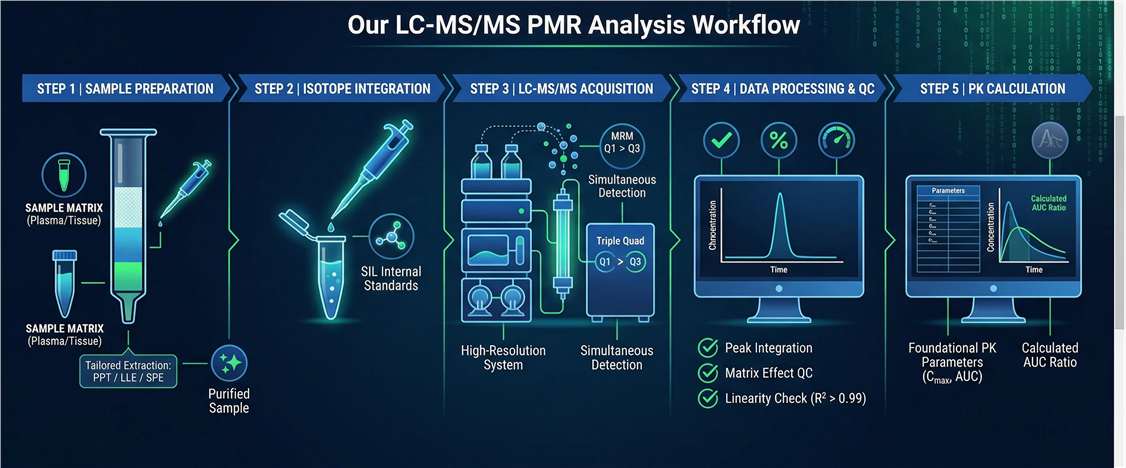
We utilize a streamlined, highly standardized workflow. This approach ensures maximum data reliability, limits variability, and supports high-throughput screening for your research projects:

  1. Sample Preparation: We apply optimized protein precipitation (PPT), liquid-liquid extraction (LLE), or solid-phase extraction (SPE) specifically tailored to your sample matrix.
  2. Internal Standard Integration: We introduce stable isotope-labeled (SIL) internal standards to guarantee quantification precision and perfectly correct for recovery variations.
  3. LC-MS/MS Data Acquisition: High-resolution mass spectrometry platforms run optimized multiple reaction monitoring (MRM) transitions. This detects all target compounds simultaneously.
  4. Data Processing & QC: Our analytical team performs strict baseline integration, matrix effect evaluation, and standard curve linearity checks to ensure data integrity.
  5. PK Parameter Calculation: We utilize professional pharmacokinetic software to compute foundational parameters, including Cmax, AUC0-t, and AUC0-∞.

LC-MS/MS PMR Analysis Workflow showing sample preparation, HRMS acquisition, and parameter calculation.

Sample Submission Requirements

We accept a wide variety of research samples, accommodating both early in vitro screening and in vivo tissue distribution studies. Please ensure your biological samples are securely packed with ample dry ice to prevent any degradation of unstable metabolites during transit. Follow the standard guidelines below for sample submission:

Sample Matrix Minimum Volume / Amount Storage Condition Shipping Method
In Vitro Assay Buffers 50 µL -80°C Dry Ice
plasma and serum drug quantification 100 µL -80°C Dry Ice
Tissue Homogenates 50 mg -80°C Dry Ice
Cell Lysates 1x10^6 cells -80°C Dry Ice

Data Deliverables & Demo Results Showcase

We provide clear, comprehensive, and highly traceable data reports to support your internal project decisions and regulatory-style internal reviews. While every bioanalytical project is customized to the specific molecule, typical data deliverables include the following elements:

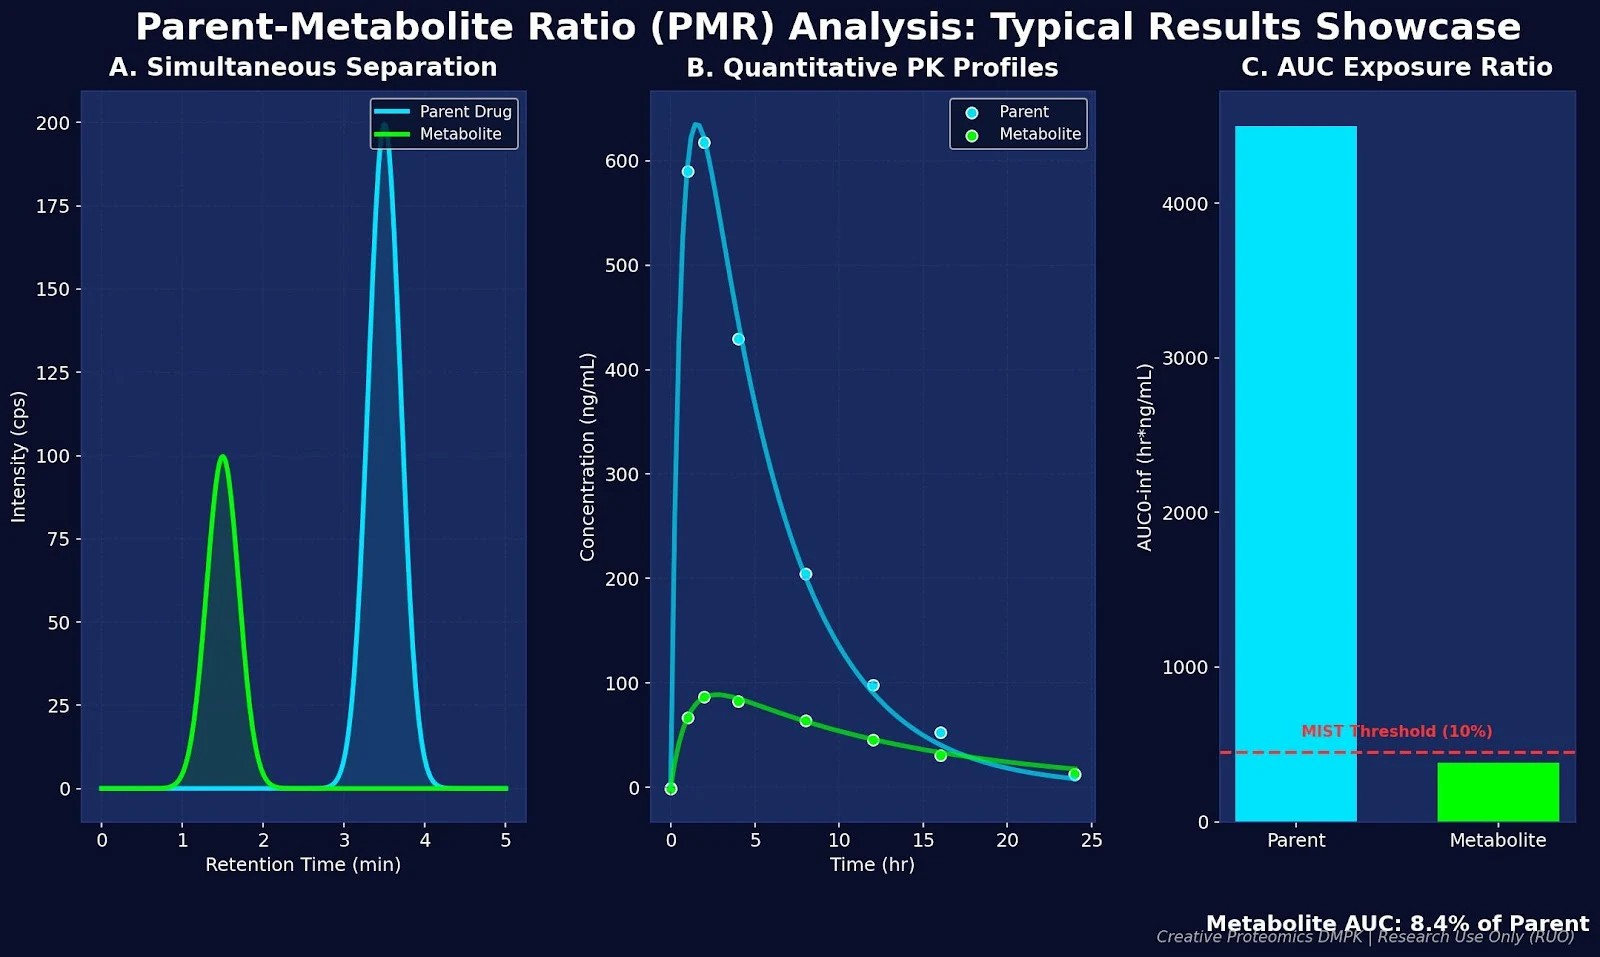
  • Multiplexed Chromatograms: We deliver high-quality Extracted Ion Chromatograms (XIC). These visual plots demonstrate clear baseline chromatographic separation of both the parent drug and its metabolites, proving that there is no analytical cross-talk or peak merging.
  • Method Validation Reports: You will receive detailed data sheets covering fundamental analytical parameters. This includes standard curve linearity (typically requiring an R-squared value greater than 0.99), LLOQ (Lower Limit of Quantification) establishment, intra-day and inter-day precision and accuracy, and comprehensive matrix effect assessments.
  • Concentration-Time Profiles: We provide clear, publication-ready graphs plotting the pharmacokinetic concentration curves over time, often displayed on both linear and semi-logarithmic scales for easier interpretation of the elimination phase.
Typical concentration-time profile demonstrating parent and metabolite exposure curves in preclinical models.

Platform Advantages: Solving Complex Bioanalytical Challenges

Mastering Extreme Polarity Differences

One of the most persistent challenges in bioanalysis is that parent drugs and their metabolites often exhibit drastically different polarities. For example, a highly lipophilic parent drug may undergo Phase II glucuronidation, producing a highly hydrophilic, highly polar metabolite. A standard, single-injection reversed-phase LC-MS/MS method usually struggles to retain the polar metabolite on the column while efficiently eluting the lipophilic parent.

We specialize in custom de novo method development to solve this specific bottleneck. Our analytical scientists possess deep expertise in optimizing mobile phase gradients, exploring alternative column chemistries (such as HILIC or mixed-mode columns), and fine-tuning pH buffers. This allows us to perfectly separate and quantify extreme polarity pairs in a single, highly stable analytical run, maximizing throughput and reducing required sample volumes.

Ultra-Low LLOQ Sensitivity for Minor Metabolites

Low-abundance active metabolites can easily be missed or fall below the noise threshold of standard equipment, leading to inaccurate ratio calculations. Our laboratory is equipped with a fleet of high-resolution, latest-generation triple quadrupole mass spectrometers. These instruments offer an ultra-low LLOQ.

By optimizing electrospray ionization (ESI) or atmospheric pressure chemical ionization (APCI) parameters, we routinely detect and quantify minor metabolites. We can achieve stable quantification even when the metabolite's concentration is dramatically lower—sometimes 100 to 1000 times lower—than the parent drug circulating in the same sample.

Robust Matrix Effect Handling and Isotope Dilution

Biological samples, particularly plasma and tissue homogenates, contain endogenous proteins, salts, and phospholipids that severely suppress or enhance mass spectrometry ionization signals. This matrix effect can artificially skew the calculated ratio if the parent and metabolite are affected differently.

We utilize a rigorous stable isotope dilution strategy whenever possible. By synthesizing and incorporating heavy-isotope labeled versions of the analytes as internal standards, we mathematically cancel out matrix variations. Furthermore, we develop tailored extraction protocols to physically remove interference from complex tissues. This results in highly stable, batch-to-batch consistent data suitable for large-scale compound screening.

Case Study: LC-MS/MS Quantification of Exposure Ratios for Bioequivalence

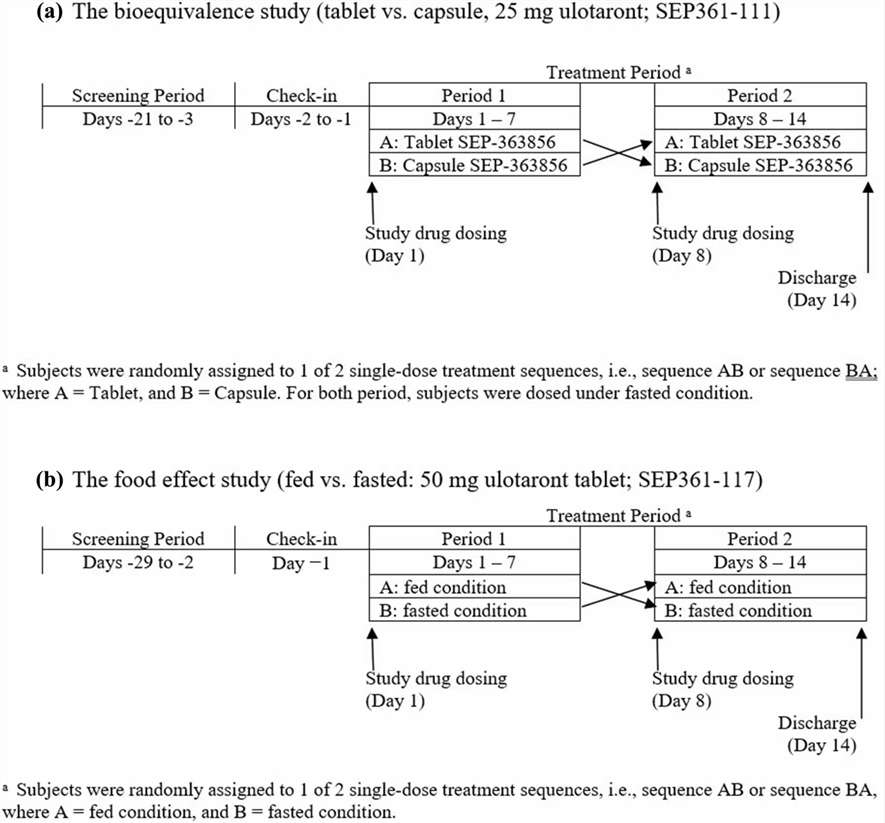
Background and Scientific Challenge: Researchers evaluating the pharmacokinetic profile of Ulotaront, a novel compound, needed to precisely determine the exposure ratio between the parent drug and its primary circulating active metabolite, known as the N-desmethyl metabolite. Accurately mapping this ratio was an essential step in confirming formulation bioequivalence and assessing the potential impact of food on drug absorption. The analytical challenge lay in the fact that the N-desmethyl metabolite circulates at exceptionally low levels compared to the parent drug.

Analytical Methods and De Novo Strategy: To meet this challenge, a highly sensitive de novo LC-MS/MS method was developed and rigorously validated for plasma sample quantification. The analytical team utilized a sophisticated solid-phase extraction (SPE) protocol to clean the complex plasma matrix, significantly reducing phospholipid-induced ion suppression. Stable isotope-labeled (SIL) internal standards were employed for both compounds to ensure absolute quantitative precision. The assay achieved an exceptional Lower Limit of Quantification (LLOQ) of 0.0200 ng/mL, successfully capturing both the parent drug and the highly polar metabolite in a single run.

Results and Pharmacokinetic Calculation: Through this precise high-resolution detection, researchers were able to plot detailed concentration-time curves and calculate the exact Area Under the Curve (AUC0-t and AUC0-∞). The robust LC-MS/MS data clearly demonstrated that the N-desmethyl active metabolite's AUC represented only approximately 2-3% of the parent drug's total systemic AUC. (Note: For visual verification of these pharmacokinetic curves, please refer directly to Figure 2 in the cited publication below, which illustrates the mean plasma concentration-time profiles on both linear and semi-logarithmic scales).

Conclusion and Impact: This highly accurate, multiplexed exposure ratio calculation provided solid, data-driven analytical evidence. By proving that the minor metabolite maintained a consistent proportional ratio to the parent drug regardless of formulation, the researchers successfully validated the compound's early bioequivalence.

Source: Comparative Bioequivalence of Tablet and Capsule Formulations and the Effect of Food on Pharmacokinetics

LC-MS/MS pharmacokinetic concentration-time curve plotting parent drug versus minor metabolite exposure in plasma.

Figure 2. Mean plasma concentration-time profiles demonstrating the proportional exposure ratio between the parent drug and its minor active metabolite following oral administration.

Frequently Asked Questions (FAQ)

Can you perform ratio analysis for both in vitro assay buffers and in vivo biological fluids?

Yes, absolutely. We possess the analytical flexibility to handle a wide spectrum of matrices. We routinely analyze incubation buffers and cellular matrices generated from in vitro drug metabolism profiling assays, such as liver microsomes and hepatocytes. We are equally equipped to process complex biological fluids like plasma, serum, urine, bile, and solid tissue homogenates.

What if standard commercial analytical kits fail due to severe matrix interference in my samples?

We intentionally do not rely on standard commercial kits for complex bioanalytical projects. Our core strength lies in developing custom de novo LC-MS/MS methods tailored specifically to your molecule's unique physicochemical properties. This bespoke approach allows us to design specific extraction protocols that perfectly overcome severe matrix suppression.

How do you ensure mathematical accuracy when the parent drug concentration is vastly higher than the metabolite?

We design analytical methods with an extremely wide dynamic linear range. If the concentration difference naturally exceeds the mass spectrometer detector's standard linear limit, we employ strategic, highly controlled sample dilution protocols using matched blank matrices, combined with optimized isotope internal standards.

Does your laboratory quantify phase II metabolites directly, or do you use hydrolysis?

We can do both depending on your research goals. For the highest precision, we prefer to source standard reference materials for the specific Phase II metabolite and quantify it directly via LC-MS/MS. If reference standards are unavailable, we can perform controlled enzymatic hydrolysis to cleave the conjugate, subsequently quantifying the increase in the parent compound to calculate the original Phase II exposure ratio indirectly.

Ready to Quantify Your Lead Compound or Metabolite?

Share your matrix type, sample count, and expected range—feasibility routing will confirm whether direct quantification is fit-for-purpose or method development is recommended.

inquiry
Online Inquiry