ISO 17025–ACCREDITED LABORATORY ENVIRONMENT

Sample Preparation Method Development — PPT, LLE, SPE Workflows

The signal your detector reports is only as clean as the sample your preparation method delivers. A mass spectrometer cannot distinguish your analyte from a co-eluting phospholipid — it ionizes both, and the suppressed signal is what you integrate. We treat sample preparation as an independent optimization variable, not a default step. From protein precipitation to mixed-mode solid-phase extraction, we design matrix-matched preparation workflows for small-molecule drugs in plasma, tissue, bile, CSF, and other biological matrices — available as a standalone service or integrated within full bioanalytical method development.

Platform-Adaptive Prep

LC-MS/MS targets matrix effect mitigation; HPLC-UV targets baseline cleanliness — different optimization goals, different preparation strategies.

Standalone Execution

Your validated protocol, our laboratory — ISO 17025-aligned batch preparation with full documentation for regulatory submission.

Matrix-Aware Cleanup

Staged cleanup and enrichment workflows for complex research matrices — tissue, bile, CSF, and fecal extract.

Why Sample Prep Strategy Matters Optimized Prep for LC-MS/MS & HPLC-UV Standalone Sample Preparation Matrix Cleanup & Enrichment Concentration & Dry-Down Reconstitution Optimization Representative Performance Data What to Send Us

Why Sample Preparation Strategy Matters

Platform Dictates the Optimization Target

In LC-MS/MS, the dominant failure mode is ion suppression. Co-extracted phospholipids — particularly lysophosphatidylcholines at m/z 496 and 524 — suppress analyte signal by 30–90% without producing a visible chromatographic peak. The optimization target is consistent recovery with minimum matrix effect, measured as matrix effect factor (MF = post-extraction spike area / neat standard area). An MF outside 0.85–1.15 signals that the preparation method must be revised regardless of absolute recovery. In HPLC-UV, there is no ion source to suppress — the failure mode is chromatographic co-elution. Endogenous compounds absorbing at your detection wavelength (heme products at 254 nm, aromatic amino acid metabolites at 280 nm, conjugated bilirubin at 450 nm) produce overlapping peaks that degrade integration. Preparation strategy shifts from phospholipid removal to spectral baseline cleanliness, with LLE or aggressive SPE wash steps replacing simple PPT.

The Technique Selection Decision Framework

We select among four core techniques — PPT, LLE, SPE (reversed-phase and mixed-mode), and SLE in 96-well format — based on three compound-specific parameters. Log P determines LLE partitioning: below 1 favors PPT with SPE backup; 1–4 is the LLE sweet spot with methyl tert-butyl ether or ethyl acetate (recovery > 85%); above 5 favors mixed-mode SPE for orthogonal retention. pKa relative to mobile phase pH governs ion-exchange SPE retention — a basic compound loaded at pH 3 onto cation-exchange sorbent is retained by dual ionic and hydrophobic mechanisms. Matrix complexity sets the cleanup burden: clean plasma may need only PPT; tissue homogenate or bile demands staged debris removal before any column receives the sample.

Technique Selectivity Throughput (96 samples) Matrix Compatibility Typical Recovery Matrix Effect Risk Relative Cost
PPT Low < 1 h Plasma, serum 80–95% High $
LLE Moderate 1–2 h Plasma, serum, urine 75–95% Moderate $$
SPE (Reversed-Phase) High 2–3 h Plasma, tissue (homogenized) 80–95% Low–Moderate $$$
SPE (Mixed-Mode) Very High 2–3 h All matrices incl. bile, feces 75–90% Very Low $$$$
SLE (96-Well) Moderate < 1 h Plasma, serum 80–95% Moderate $$$

Optimized Sample Preparation for LC-MS/MS and HPLC-UV

LC-MS/MS — Controlling Matrix Effects

The first-pass approach for plasma is PPT with acetonitrile (2:1 v/v, 0.1% formic acid), which precipitates > 98% of proteins and extracts most small-molecule drugs with recovery > 85%. If the MF exceeds 0.85–1.15 at two concentration levels — common for log P > 3 compounds where phospholipid co-extraction is pronounced — we escalate to LLE with methyl tert-butyl ether or deploy mixed-mode SPE that retains the analyte by ion-exchange while a methanol wash strips phospholipids. Depletion is confirmed by monitoring the post-column infusion signal at m/z 184 (phosphocholine head group), targeting residual signal below 10% of pre-extraction baseline. For high-throughput batches, SLE in 96-well format provides equivalent phospholipid removal with sub-two-hour processing. These workflows integrate with our custom LC-MS/MS method development service.

HPLC-UV — Securing Baseline Cleanliness

LLE solvents are matched to both analyte log P and detector wavelength — for a compound detected at 254 nm we avoid ethyl acetate (cutoff 256 nm) and select methyl tert-butyl ether (cutoff 210 nm). If LLE recovery falls below 75%, reversed-phase or mixed-mode SPE with incremental organic washes removes UV-absorbing interferences without premature analyte elution. PPT alone is rarely sufficient below 100 ng/mL in plasma because residual soluble proteins produce a broad absorbance hump from 200–300 nm. Prepared samples transfer to our HPLC-UV method development service for full chromatographic optimization and validation.

Standalone Sample Preparation

Your Protocol, Our Laboratory

If your bioanalytical method is already validated, you provide the protocol and we execute batch preparation as a standalone service under ISO 17025-aligned conditions. Each batch includes reagent blanks, matrix blanks, and QC samples at your specified concentrations. Extraction recovery and reproducibility are verified against your acceptance criteria before any sample proceeds to analysis.

The batch documentation package supports regulatory traceability: preparation records with timestamps, raw extraction data per sample, QC recovery calculations against nominal concentrations, and deviation reports with root-cause analysis. Four scenarios where this delivers immediate value: mid-study overflow when your team cannot process the next batch within the stability window; specialized tissue processing (bead-mill homogenization, SPE) that your discovery lab lacks; multi-site centralization eliminating inter-site variability; and stability study time points requiring identical extraction conditions so observed differences reflect biology, not preparation drift. All standalone work is compatible with our method validation services for formal cross-validation when needed.

Matrix Cleanup and Enrichment

Staged Cleanup for Complex Matrices

Tissue homogenate, bile, fecal extract, and cell lysate carry lipid loads that overwhelm extraction sorbents and columns. We approach cleanup in stages with defined QC gates. Stage one — bulk debris removal — homogenizes solid samples in aqueous-organic solvent, centrifuges at 14,000 × g, and filters through 0.22 µm membrane before any SPE cartridge receives the sample, preventing particulate clogging (the most common SPE failure). Stage two — selective interferent removal — is matched to matrix chemistry: hybrid SPE phases with size-exclusion or Lewis acid interaction remove 60–90% of plasma phospholipids (confirmed by post-column infusion at m/z 184); LLE at alkaline pH partitions deprotonated bile acids into aqueous phase while neutral analytes extract into organic solvent; biocompatible large-pore SPE prevents protein fouling of CSF samples (total protein ~0.2–0.5 mg/mL versus ~60–80 mg/mL in plasma).

Enrichment When Sample Is Limiting

When the analyte falls below LLOQ or sample volume is limited, we combine extraction with enrichment. Extracting 1.0 mL plasma, evaporating the eluate, and reconstituting in 50–100 µL injection solvent produces a 10–20× concentration increase — verified by QC samples carried through the enrichment step. This approach is standard in our tissue and cell lysate quantification service where available biopsy mass is frequently the limiting factor.
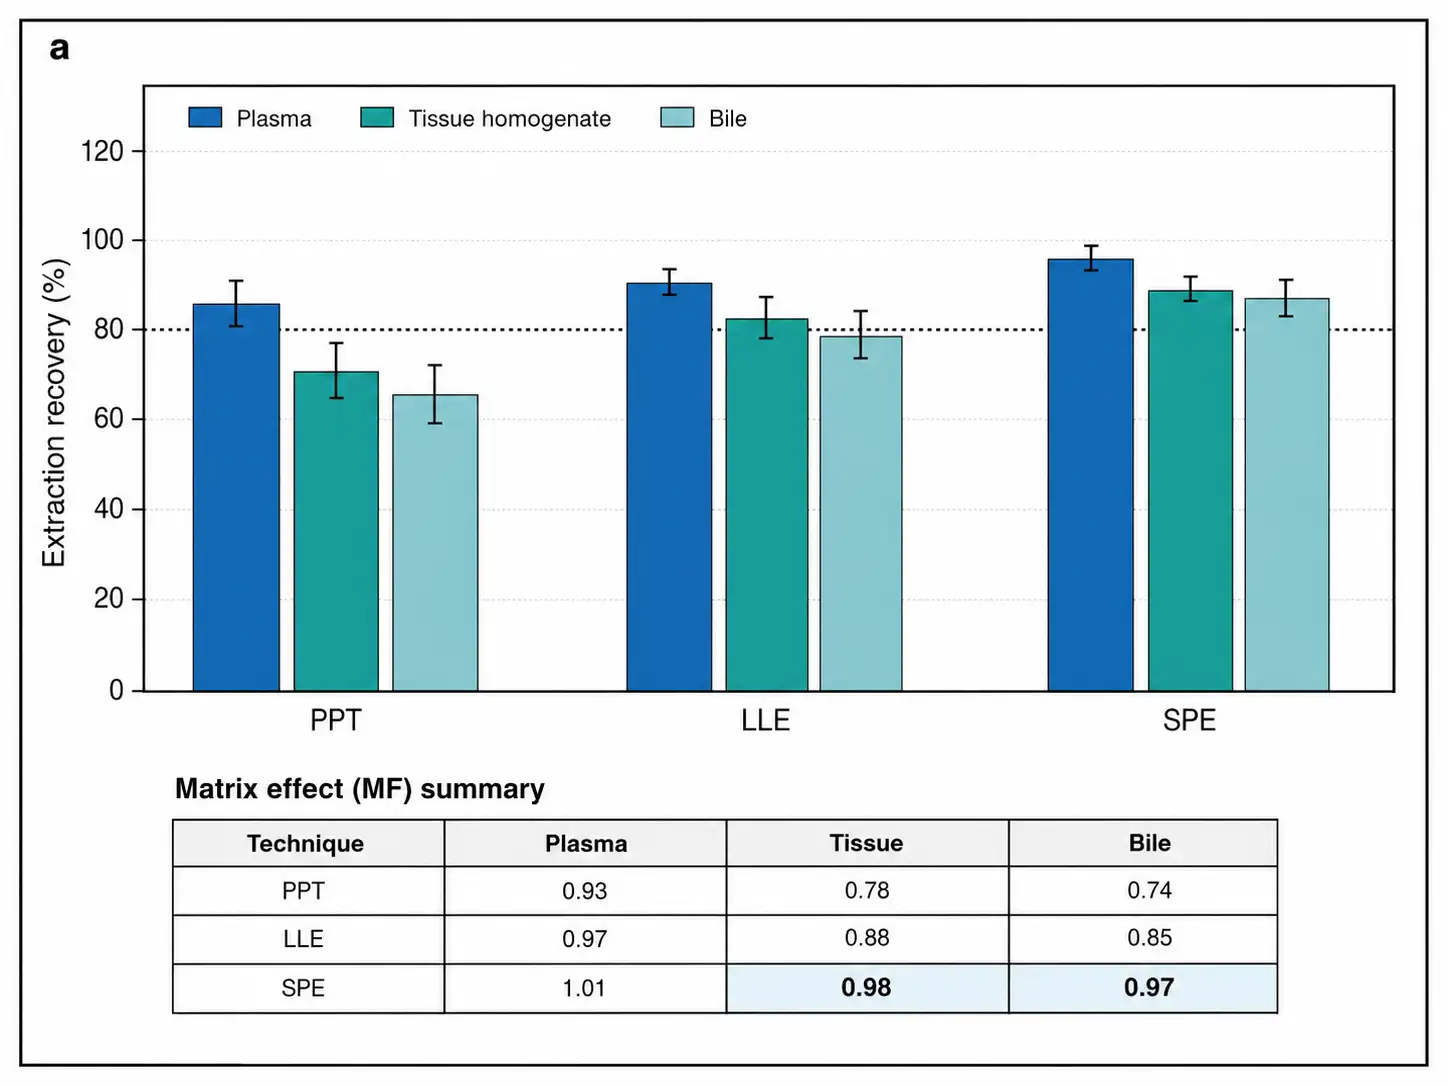
Grouped bar chart comparing extraction recovery across PPT, LLE, and SPE for plasma, tissue homogenate, and bile with matrix effect factor inset table

Concentration and Dry-Down

Method Selection Matched to Compound Stability

LLE and SPE extracts contain 0.5–5 mL of organic solvent — too dilute for direct LC injection. We select among three concentration methods based on compound stability: nitrogen blow-down at 37–45°C with filtered N2 for parallel 96-well processing of thermally stable compounds (~45–60 min for 2 mL ethyl acetate); centrifugal vacuum concentration at ambient temperature for heat-sensitive compounds (nitroaromatics, N-oxides, ester prodrugs); and lyophilization for aqueous extracts or compounds that degrade during extended solvent evaporation. We do not assume 100% recovery. Losses from co-evaporation, surface adsorption, and thermal degradation are compound-specific and quantified during method development. Recovery below 90% triggers investigation into alternative conditions or addition of a keeper solvent such as DMSO or glycerol in microliter quantities.

Reconstitution Optimization

Five Parameters That Control Injection Success

Reconstitution — dissolving the dried extract — is the final manipulation before the autosampler and the most common source of peak shape artifacts. We optimize five interdependent parameters: (1) solvent composition matched to initial mobile phase conditions, preventing band broadening when the injection plug hits a stronger solvent environment; (2) injection solvent strength iteratively tested across three to five organic compositions, selecting the strongest that maintains peak asymmetry between 0.8 and 1.2; (3) reconstitution volume calculated to place on-column mass in the middle third of the calibration range; (4) pH and buffer species matched to the mobile phase, avoiding transient pH gradients that shift retention time by up to 0.5 minutes for ionizable compounds; (5) solubility confirmed by five replicate injections with peak area CV below 3% — CV above 3% indicates incomplete dissolution. Optimized conditions are documented in the method report and applied to every subsequent batch.

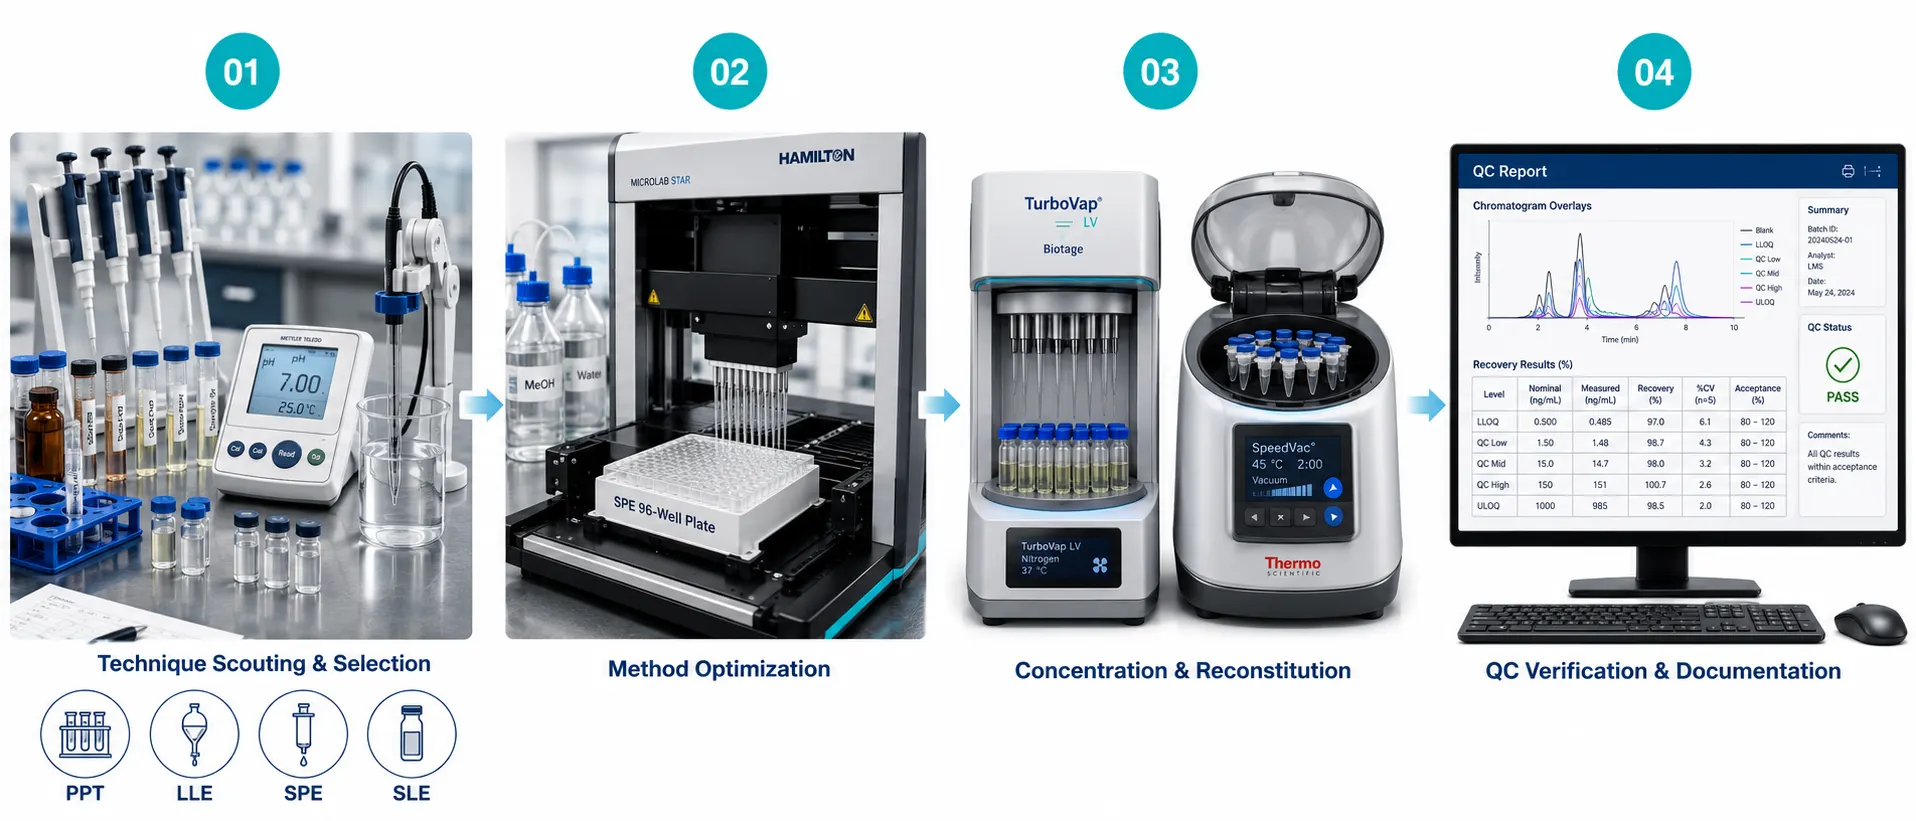
Six-stage sample preparation workflow diagram: Matrix Arrival to QC Release

Representative Method Performance

Performance envelope for small-molecule drugs across the four core techniques in plasma. Final values for any individual compound depend on physicochemical properties, matrix type, and detection platform.

Performance Parameter Typical Range
Extraction recovery — PPT (plasma) 80–95%
Extraction recovery — LLE (log P 1–4) 85–95%
Extraction recovery — SPE, mixed-mode 75–90%
Matrix effect factor — PPT, unoptimized 0.60–1.40
Matrix effect factor — mixed-mode SPE 0.85–1.15
Enrichment factor (1 mL → 50–100 µL) 10–20×
Intra-batch recovery CV (n = 6) < 10%
Inter-batch recovery reproducibility (3 batches) < 15%
Post-column phospholipid reduction (mixed-mode SPE) 60–90%
Reconstitution peak area CV (5 injections) < 3%
96-well PPT/SLE throughput < 2 h per plate

What to Send Us

Quantities below support method development and routine batch preparation. Contact our team for microsampling adaptations if available amounts are smaller.

Sample Type / Material Quantity (Method Dev) Quantity (Routine Analysis) Preparation & Storage Shipping
Pure API / Reference Standard ≥ 5 mg powder ≥ 10 mg High-purity (>95%) powder or stock solution. Provide MW, salt form, log P, pKa if available. Room temp or per CoA
Internal Standard ≥ 1 mg ≥ 5 mg Structural analog or SIL-IS. Provide purity and storage conditions. Room temp
Blank Biological Matrix 2–5 mL plasma / 1–2 g tissue ≥ 10 mL Species-, strain-, and anticoagulant-matched. −20°C or −80°C; dry ice
Study Samples Not required for method dev Per protocol (min 50 µL plasma / 10 mg tissue per replicate) Labeled with collection date, matrix, anticoagulant. Ship after validation. −20°C or −80°C; dry ice

Note: Communicate known stability concerns — light sensitivity, hydrolysis, oxidation — upfront so amber vials, inert atmosphere, or antioxidant addition are built into the first extraction experiment.

Frequently Asked Questions

What sample preparation techniques does Creative Proteomics DMPK offer?

We offer PPT, LLE with solvents selected by analyte log P, SPE on C18, polymeric HLB, and mixed-mode ion-exchange/reversed-phase sorbents, and SLE in 96-well format. Each technique is evaluated against your compound's physicochemical properties, matrix type, and detection platform during method development.

Can I send study samples for preparation without having a method developed first?

Yes — our standalone sample preparation service. You provide the validated protocol; we execute batch preparation with method blanks, matrix blanks, and QC samples at your specified levels. Full batch documentation is provided.

How do you determine which technique is best for my compound?

We evaluate log P and pKa for solvent/sorbent selection, matrix complexity for cleanup burden, and detection platform — LC-MS/MS targets matrix effect mitigation via phospholipid depletion; HPLC-UV targets baseline cleanliness from UV-absorbing interferences. A scouting experiment comparing two to three candidate techniques during method development confirms the selection.

What is the minimum sample volume required?

PPT and LLE: 50–100 µL plasma per replicate. SPE and SLE: 50–200 µL depending on sorbent bed mass. Tissue: 10–50 mg per replicate. Smaller volumes — down to 10 µL for DBS or microdialysate — with microsampling adaptations.

Do you offer high-throughput 96-well plate preparation?

Yes — PPT, LLE, and SLE in 96-well format (SPE also available). A full plate processes in under two hours for PPT or SLE, including reagent addition, mixing, centrifugation, and supernatant transfer.

What batch documentation do you provide?

Each report includes step-by-step preparation records with timestamps, raw extraction data, QC recovery calculations (% nominal with acceptance criteria), blank analysis confirming no carryover, and deviation reports with root-cause analysis. The package is formatted for direct inclusion in regulatory submissions.

References

  1. Bylda C, Thiele R, Kobold U, Volmer DA. Recent advances in sample preparation techniques to overcome difficulties encountered during quantitative analysis of small molecules from biofluids using LC-MS/MS. Analyst. 2014;139(10):2265-2276. DOI: 10.1039/C4AN00094C — Comprehensive review of sample preparation for small-molecule bioanalysis, covering phospholipid depletion and mixed-mode SPE selectivity.
  2. Van Eeckhaut A, Lanckmans K, Sarre S, Smolders I, Michotte Y. Validation of bioanalytical LC-MS/MS assays: evaluation of matrix effects. Journal of Chromatography B. 2009;877(23):2198-2207. DOI: 10.1016/j.jchromb.2009.01.003 — Definitive reference on matrix effect evaluation protocols for LC-MS/MS bioanalysis.

Ready to Quantify Your Lead Compound or Metabolite?

Share your matrix type, sample count, and expected range—feasibility routing will confirm whether direct quantification is fit-for-purpose or method development is recommended.

inquiry
Online Inquiry
