Every pharmacokinetic parameter derived from plasma concentration data carries a hidden assumption: that plasma drug levels faithfully represent whole blood drug levels. For many compounds, this assumption is wrong. The blood-to-plasma ratio (Rb), a deceptively simple number typically between 0.5 and 5, sits at the intersection of bioanalytical method selection, clearance interpretation, and inter-species PK translation — yet it receives less attention in CRO educational content than almost any other ADME parameter. This article explains what Rb means, how it is measured, what can go wrong during measurement, and how a single ratio can change the physiological interpretation of your entire PK dataset.
What Is the Blood-to-Plasma Ratio — and Why Should You Care?
The blood-to-plasma ratio is defined as Rb = C_blood / C_plasma, where C_blood is the total drug concentration in whole blood and C_plasma is the concentration in plasma from the same sample. Rb captures the equilibrium distribution of drug between plasma water, plasma proteins, and red blood cell (RBC) contents — membranes, hemoglobin, and carbonic anhydrase.
Three scenarios define the practical implications. When Rb ≈ 1 (0.8-1.2), drug distributes evenly and plasma concentrations reflect blood concentrations without correction. When Rb > 1, drug partitions into RBCs — common for lipophilic bases and carbonic anhydrase inhibitors. When Rb < 1, drug is retained in plasma, typically because extensive plasma protein binding limits RBC uptake.
Organs are perfused by blood, not plasma. Every PK parameter from plasma data — clearance, volume of distribution, hepatic extraction ratio — is a plasma-level construct, one step removed from physiological reality. The fundamental correction: CL_blood = CL_plasma / Rb. For a typical acidic drug with Rb = 0.55, blood clearance is 1.82× plasma clearance. This correction can transform a clearance value that appears to exceed hepatic blood flow — a physiological impossibility — into one fully consistent with hepatic elimination.
Rb informs five decisions in drug development: (1) matrix choice for bioanalysis — plasma or whole blood? (2) plasma-to-blood clearance conversion; (3) hepatic extraction ratio calculation — the well-stirred liver model requires blood input; (4) PBPK tissue partitioning — Rb is the starting point for estimating tissue Kp values; (5) inter-species PK translation — species with different Rb produce different plasma PK profiles even when elimination rate is identical.
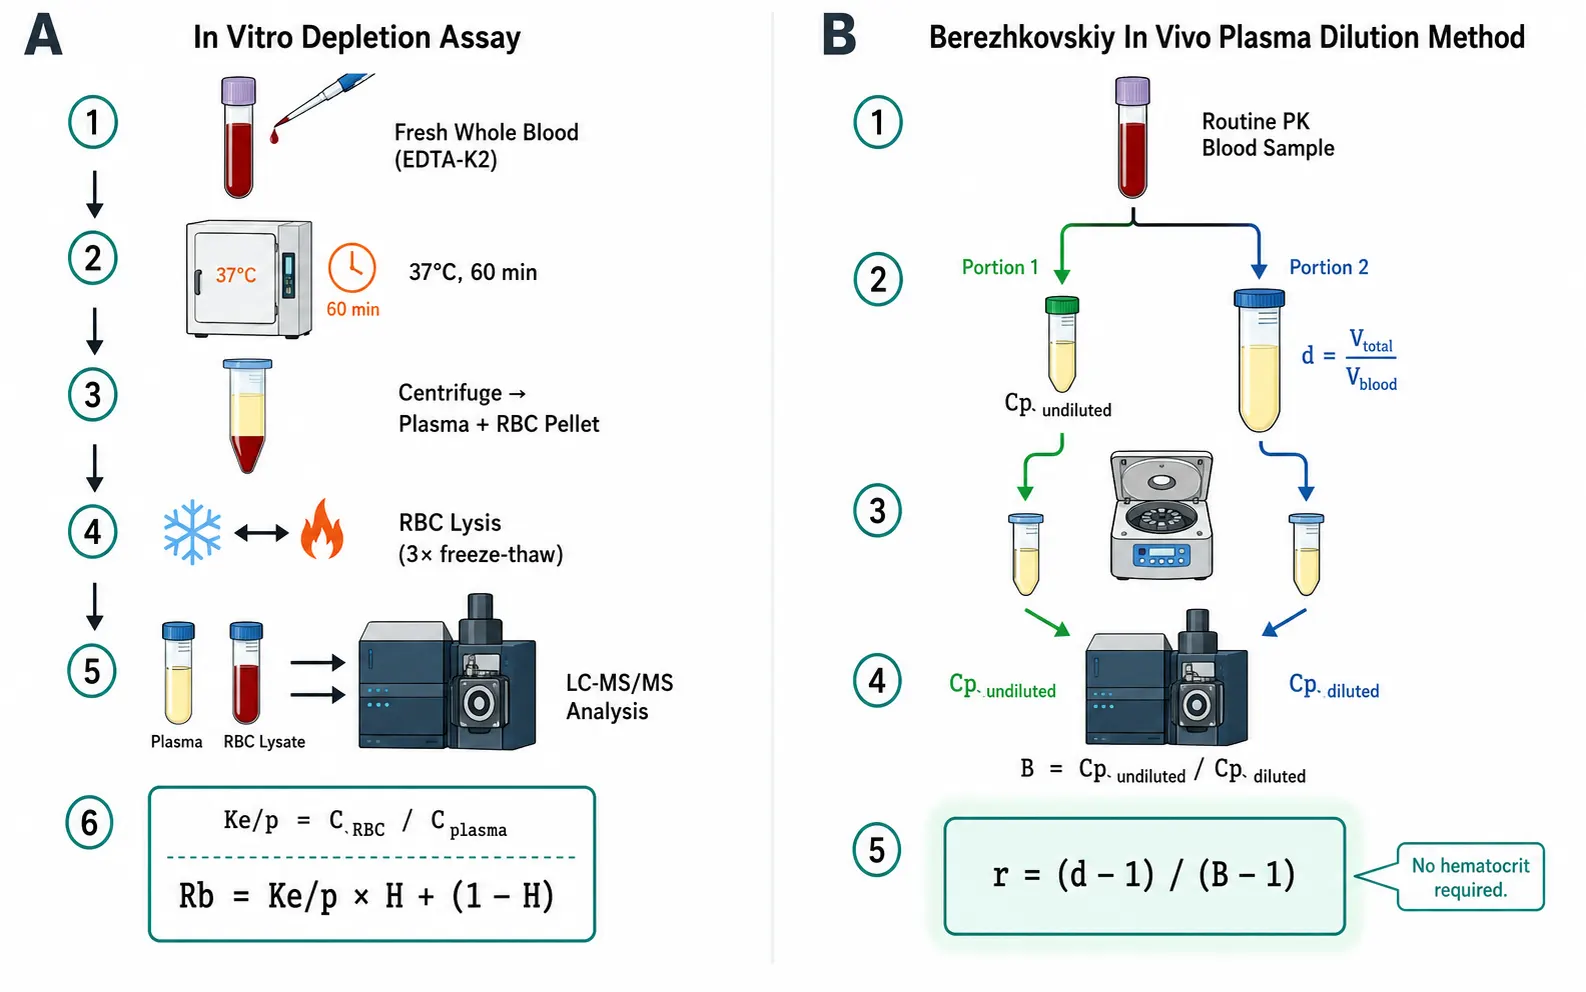 Figure 1: Two-method comparison for blood-to-plasma ratio determination — (A) the standard in vitro depletion assay workflow: spike compound into fresh whole blood, incubate at 37°C for 60 min, centrifuge to obtain plasma, prepare RBC lysate by freeze-thaw, analyze both fractions by LC-MS/MS, calculate Rb using hematocrit; (B) the Berezhkovskiy in vivo plasma dilution method: collect routine PK blood sample, split into two portions — one processed normally for plasma, one diluted with blank plasma at known dilution factor d, measure plasma concentrations in both, calculate Rb from r = (d-1)/(B-1) with no hematocrit or whole blood analysis needed. Key equations shown for both methods.
How B:P Is Measured: The Two Methods
Two fundamentally different approaches exist for determining Rb, and the choice between them depends on your study phase, available samples, and tolerance for additional experimental work.
Method 1 — In Vitro Depletion Assay
This is the standard approach used by CROs including Cyprotex/Evotec and BioDuro, based on the method described by Yu et al. (2005). Fresh whole blood (typically EDTA-K2 anticoagulated) is spiked with test compound at a defined concentration — commonly 500 nM, though testing at multiple concentrations is recommended to detect saturable binding. The spiked blood is incubated at 37°C with gentle shaking for 60 minutes to allow distribution equilibrium between plasma and RBCs. After incubation, one aliquot of whole blood is retained for analysis, and the remainder is centrifuged to obtain plasma. The RBC pellet is washed, lysed by three freeze-thaw cycles or sonication, and extracted. Both plasma and RBC lysate fractions are analyzed by LC-MS/MS, typically after protein precipitation with acetonitrile containing a stable isotope-labeled internal standard. The RBC-to-plasma partition coefficient Ke/p is calculated as C_RBC / C_plasma, and Rb is derived from the relationship Rb = Ke/p × H + (1-H), where H is the measured hematocrit of the donor blood. Controls are essential: methazolamide for human blood, chlorthalidone for rat and mouse, and chloroquine for dog — all compounds with well-characterized, high RBC partitioning.
Method 2 — Berezhkovskiy In Vivo Plasma Dilution Method (2011, Genentech)
This elegant alternative requires no whole blood analysis, no hematocrit measurement, and no separate calibration curve. It can be piggybacked onto any existing PK study that already involves plasma collection. The procedure: collect a routine PK blood sample and split it into two portions. Process Portion 1 normally — centrifuge, collect plasma, measure drug concentration (Cp_undiluted). For Portion 2, transfer a known volume of whole blood into a tube pre-filled with a known volume of blank plasma, creating a dilution factor d (ratio of total liquid volume to blood volume). Mix gently, centrifuge, and measure the diluted plasma concentration (Cp_diluted). Calculate the ratio B = Cp_undiluted / Cp_diluted. The blood-to-plasma ratio is then: r = (d-1) / (B-1). This equation requires no hematocrit input — the dilution physics accounts for hematocrit implicitly. Berezhkovskiy validated the method against traditional in vitro measurements and demonstrated good agreement across multiple compounds.
When should you use each method? Method 1 is appropriate for discovery-stage screening, when you need Rb for multiple compounds before in vivo studies begin, and when you specifically need Ke/p (the RBC-to-plasma partition coefficient) for PBPK model parameterization. Method 2 is the practical choice when PK studies are already underway — it adds zero animal usage, minimal bioanalytical burden, and provides in vivo-relevant Rb under actual physiological conditions rather than in vitro equilibration. The limitation of Method 2 is that it requires the drug to have reached distribution equilibrium in vivo at the sampling time; for compounds with very slow RBC uptake kinetics, the measured Rb may reflect a pre-equilibrium state.
A critical methodological note: always test B:P at two or more concentrations spanning the expected in vivo range. B:P can be concentration-dependent due to saturable RBC binding sites (carbonic anhydrase has finite capacity per erythrocyte), saturable plasma protein binding, or concentration-dependent RBC uptake kinetics. A single-concentration Rb measurement at 1 µM may be irrelevant for a drug whose in vivo Cmax is 50 nM — or vice versa. For comprehensive bioanalytical support covering both in vitro B:P determination and in vivo plasma PK with proper matrix selection, our LC-MS/MS single drug quantification services include method development for both plasma and whole blood matrices with matched calibration ranges.
The Temperature Trap: Why B:P Depends on How You Handle the Blood
Temperature is among the most consequential and least-discussed preanalytical variables in B:P measurement. Drug distribution between plasma and RBCs is temperature-dependent, and the direction and magnitude of the effect differs by compound class.
The 37°C vs 4°C Problem
Novak et al. (2021, Pfizer) investigated whether measuring Rb at 4°C — common practice for compounds unstable in blood at 37°C — produces results comparable to the 37°C standard. For most compounds, 4°C Rb values were comparable to 37°C, validating the cold-temperature approach for prodrugs, soft drugs, and peptide mimetics. However, a critical exception emerged: carbonic anhydrase binders. Chlorthalidone, dorzolamide, methazolamide, and acetazolamide showed significantly underestimated Rb at 4°C because carbonic anhydrase binding is temperature-dependent — reduced affinity at low temperature produces falsely low Rb. For these compounds, the authors recommend enzyme inhibitors at 37°C over cold-temperature methods.
The Cyclosporin Object Lesson
Atkinson et al. (1984) demonstrated that cyclosporin whole blood concentration was approximately twice the serum concentration when separated at 37°C. At room temperature, serum cyclosporin dropped by roughly 50% — drug moved from plasma into RBCs during cooling, with equilibrium re-established within 30 minutes. This is why cyclosporin therapeutic drug monitoring worldwide uses whole blood: plasma concentrations are so sensitive to centrifugation temperature that a sample processed at RT would suggest a falsely low drug level, potentially triggering an unnecessary dose increase.
Trametinib — A Modern Confirmation
A 2025 study in Pharmacological Reports found that trametinib's RBC-to-plasma partition coefficient Ke/p rose to 6.05-7.68 at room temperature and 38°C but remained essentially unchanged at 2-8°C — cold storage suppressed RBC uptake. The study also demonstrated bidirectional temperature-dependent redistribution: trametinib partitioned into RBCs at warm temperature diffused back into drug-free plasma upon cooling. In a pediatric patient at steady state, Ke/p correlated strongly with time after dose and dose × hematocrit (r = 0.976-0.987).
The Preanalytical Protocol
Standardize: centrifuge at controlled temperature (37°C or 4°C — pick one and apply consistently), document time from collection to centrifugation, and never let blood sit at RT without documented rationale. For drugs with Rb > 2 — tacrolimus, cyclosporin, brinzolamide, trametinib — whole blood is mandatory. Plasma concentrations for these drugs are sample handling artifacts, not reflections of in vivo exposure.
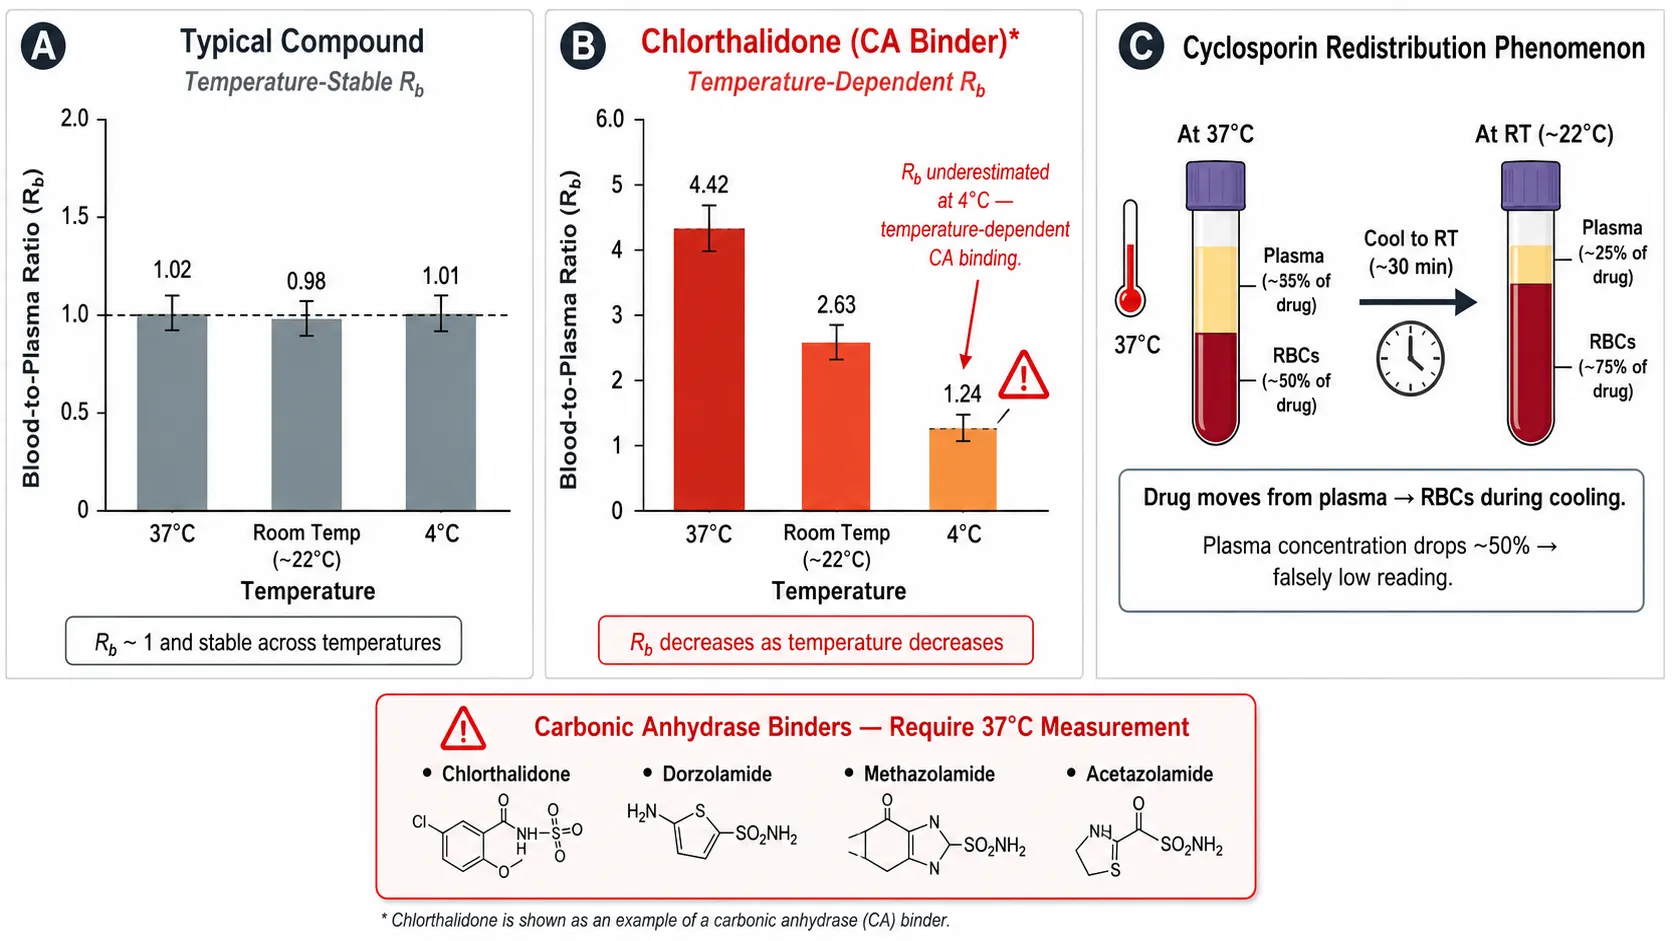 Figure 2: Temperature effect on blood-to-plasma ratio measurement. A three-panel comparison: (A) a bar chart showing the same compound measured at 37°C, room temperature (∼22°C), and 4°C — for a typical compound, Rb is comparable across temperatures; (B) the same experiment for a carbonic anhydrase binder (chlorthalidone) — Rb is significantly underestimated at 4°C due to temperature-dependent enzyme binding; (C) a schematic of the cyclosporin redistribution phenomenon — drug moves from plasma into RBCs as temperature drops from 37°C to RT, halving the measured plasma concentration in 30 minutes. An annotation box lists the four carbonic anhydrase binders that require 37°C measurement: chlorthalidone, dorzolamide, methazolamide, acetazolamide.
From Plasma CL to Blood CL: The Correction That Makes PK Parameters Physiologically Meaningful
Plasma clearance is a mathematical construct — it is the clearance that would explain the observed plasma concentration-time profile if the drug were uniformly distributed in plasma only. Blood clearance is what the eliminating organs actually experience. The conversion between them is CL_blood = CL_plasma / Rb. This single division can fundamentally change how you classify a drug's clearance mechanism.
Consider a worked example: a novel kinase inhibitor administered intravenously to rats at 2 mg/kg. Non-compartmental analysis of plasma concentration data yields CL_plasma = 30 mL/min/kg. Rat hepatic blood flow is approximately 55 mL/min/kg (3,300 mL/h/kg). The hepatic extraction ratio calculated from plasma data is ER = 30/55 ≈ 0.55 — a moderate-extraction drug, suggesting that hepatic clearance has substantial spare capacity and that changes in liver blood flow would not dramatically affect exposure. But the compound has Rb = 0.6 (drug preferentially retained in plasma due to high albumin binding). Blood clearance is CL_blood = 30 / 0.6 = 50 mL/min/kg, and the blood-based extraction ratio is ER_blood = 50 / 55 ≈ 0.91 — a high-extraction drug. Same raw data, completely different mechanistic interpretation. A high-extraction drug is sensitive to liver blood flow changes, has low oral bioavailability due to first-pass extraction (F ≈ 1 - ER = 0.09), and its clearance is delivery-rate-limited, not enzyme-capacity-limited.
The "CL_plasma > Qh" Red Flag. When plasma clearance exceeds hepatic blood flow — a physiological impossibility for a drug cleared solely by the liver — Rb provides the explanation. If Rb < 1, plasma clearance is inflated relative to blood clearance because each milliliter of blood contains less drug than each milliliter of plasma (the drug is concentrated in the plasma fraction). Converting to blood clearance brings the value within physiological bounds. Conversely, if Rb > 1, plasma clearance is deflated — the drug partitions into RBCs, plasma concentrations underrepresent total blood concentrations, and the true blood clearance is higher than plasma clearance suggests. Both directions matter: a drug with Rb = 3 and apparent plasma CL = 20 mL/min/kg actually has blood CL = 6.7 mL/min/kg — much lower clearance than the plasma data would suggest.
This correction is essential for inter-species allometric scaling. Different species have different Rb values. If plasma clearance is scaled allometrically without Rb correction, you are scaling a species-biased number. The fixed-exponent allometric method (0.75 for CL, 1.0 for Vd) was developed using blood-based CL, not plasma CL. Applying it to uncorrected plasma data from species with divergent B:P ratios compounds the error. For bioanalytical support of the IV PK studies needed to determine blood clearance directly, our custom LC-MS/MS method development services provide matched plasma and whole blood methods with species-specific validation across the preclinical species in your program.
Inter-Species B:P Variation: Why You Can't Assume Rat = Human
One of the most common and costly assumptions in preclinical PK is that Rb measured in one species applies to others. It frequently does not — and the consequences propagate through clearance predictions, human dose projections, and PBPK model performance.
Hematocrit Differences Across Species
Even if the RBC-to-plasma partition coefficient Ke/p were identical across species — which it often is not — hematocrit alone produces different Rb values. Mouse Hct ≈ 0.45, rat ≈ 0.45, dog ≈ 0.42-0.45, monkey ≈ 0.39-0.43, human male ≈ 0.46, human female ≈ 0.40, and minipig ≈ 0.35-0.40. For a compound with Ke/p = 2 (moderate RBC partitioning), Rb = 2 × H + (1-H), yielding: rat Rb = 2×0.45 + 0.55 = 1.45; minipig Rb = 2×0.37 + 0.63 = 1.37; human male Rb = 2×0.46 + 0.54 = 1.46. The Hct-driven difference is modest at Ke/p = 2. But at Ke/p = 10 (extensive RBC partitioning), rat Rb = 5.05, minipig Rb = 4.33, human Rb = 5.14 — a 16% spread from hematocrit alone, before any species-specific Ke/p difference.
Species-Specific RBC Binding
RBC membrane composition differs across species. The phosphatidylcholine-to-sphingomyelin ratio in RBC membranes affects passive drug partitioning. Carbonic anhydrase isoform expression levels, hemoglobin subtypes, and RBC membrane transporter expression (GLUT1, Band 3 anion exchanger) all vary between species. Net result: Ke/p is often species-dependent in ways that are difficult to predict from physicochemical properties alone. A compound that extensively partitions into rat RBCs may show minimal RBC uptake in dog — or vice versa.
The Combined Effect
Species differences in plasma protein binding compound the B:P variation. Tang and Mayersohn (2006) identified that a rat-to-human f_up ratio greater than 5 is a predictor of large vertical allometry for clearance. When both f_up and Rb differ between species, the combined error in predicted human CL can exceed threefold if uncorrected. The practical rule is straightforward: measure Rb in each preclinical species used for definitive PK studies. One extra experiment per species is cheaper than a failed human PK prediction based on a cross-species Rb assumption that turns out to be wrong.
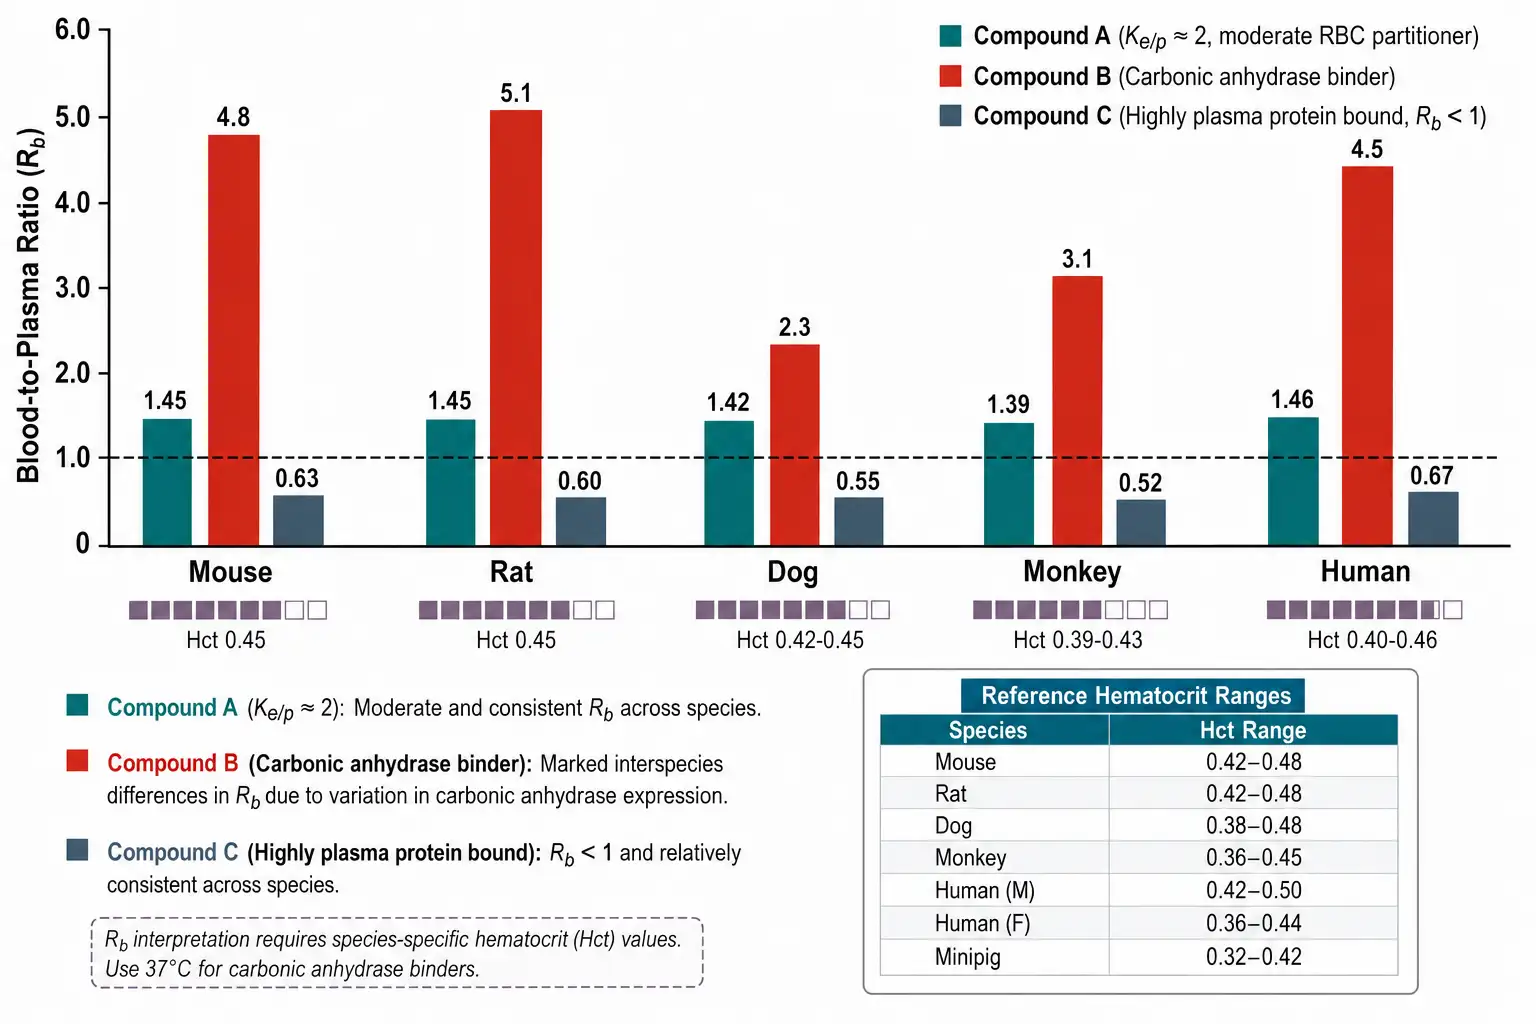 Figure 3: Inter-species blood-to-plasma ratio comparison. A grouped bar chart showing Rb values for three representative compounds across five species (mouse, rat, dog, monkey, human). Compound A (moderate RBC partitioner, Ke/p ∼2) shows modest inter-species variation driven primarily by hematocrit differences. Compound B (carbonic anhydrase binder) shows large species differences in Rb due to differential enzyme expression. Compound C (highly plasma protein bound, Rb < 1) shows consistent Rb across species. Below each species bar, a small hematocrit indicator shows the Hct value. An inset table gives reference hematocrit ranges for each species.
Hematocrit as a Confounding Variable: When Plasma Concentration Misleads
Hematocrit is not just a variable in the Rb equation — it is an independent source of variability in measured plasma drug concentrations that operates even when Rb itself is constant. Two patients with identical total blood drug concentrations but different hematocrits will produce different measured plasma concentrations. The plasma concentration is reporting on both drug exposure AND red cell mass, and without hematocrit data, you cannot distinguish which is changing.
The mechanism follows from mass balance. Total drug in blood = drug in plasma + drug in RBCs. Plasma drug = total blood drug / [Rb × H + (1-H)]. When hematocrit drops — in anemia (Hct 0.25), pregnancy (hemodilution), or critical illness — the denominator changes, and plasma concentration rises even if total blood drug is unchanged. When hematocrit rises — polycythemia (Hct 0.55), dehydration, high-altitude adaptation — plasma concentration falls. The plasma reading moves in the opposite direction of hematocrit for drugs with Rb ≠ 1.
The tacrolimus pregnancy case provides the clearest clinical illustration. Meinderts et al. (2026, British Journal of Clinical Pharmacology) studied tacrolimus pharmacokinetics in pregnant kidney and liver transplant recipients. Whole blood tacrolimus concentration-to-dose (C/D) ratios dropped approximately 61% during the second and third trimesters compared to pre-pregnancy — a finding that, at face value, would suggest dramatically reduced drug exposure requiring aggressive dose escalation. However, when plasma tacrolimus C/D ratios were analyzed, they remained stable throughout pregnancy (overall p = 0.33 for the pregnancy effect). The apparent drop in whole blood tacrolimus was entirely attributable to falling hematocrit from hemodilution — fewer RBCs meant less tacrolimus sequestered in the cellular compartment, producing lower whole blood concentrations at equivalent plasma (and presumably free) drug levels. The authors concluded that dose increases guided solely by whole blood trough concentrations may be unnecessary and potentially harmful, as they could produce suprapharmacologic free drug exposure.
This phenomenon is not limited to tacrolimus. Any drug with Rb substantially different from 1.0 will show hematocrit-dependent plasma concentrations. The correction formula is: C_plasma_corrected = C_plasma_measured × (1 - Hct_ref) / (1 - Hct_patient) × (Rb - 1 + Hct_patient) / (Rb - 1 + Hct_ref). In practice, document hematocrit at each PK time point if Rb is not approximately 1.0, particularly in populations where hematocrit is expected to change — pregnancy, pediatric patients, critical care, oncology (chemotherapy-induced anemia), and altitude studies. When hematocrit data is unavailable and Rb deviates significantly from unity, the measured plasma concentrations should be interpreted with explicit acknowledgment of the uncertainty.
The PBPK Connection: How B:P Feeds Into Tissue Distribution Prediction
Blood-to-plasma ratio is not merely a correction factor for plasma clearance — it is a fundamental input parameter for physiologically based pharmacokinetic (PBPK) modeling, where it serves as the starting point for predicting how drug distributes from blood into tissues throughout the body.
The chain from B:P to tissue partitioning begins with the blood free fraction: f_ub = f_up / Rb. If 99% of drug is plasma protein bound (f_up = 0.01) and Rb = 0.5 (drug concentrated in plasma), then f_ub = 0.01/0.5 = 0.02 — twice the plasma free fraction. The free drug concentration in blood, not plasma, drives passive diffusion into tissues. From f_ub, tissue-to-plasma partition coefficients (Kp) are estimated using tissue composition models: Kp = Rb × f_up / f_ut for well-perfused tissues, where f_ut is the free fraction in tissue. Error at the Rb step propagates through every Kp estimate and ultimately into the predicted volume of distribution at steady state (Vss).
For drugs with high RBC partitioning, the blood compartment itself dominates Vss. The contribution of blood to Vss is V_b × Rb, where V_b is the blood volume (approximately 0.08 L/kg). If Rb = 10, the blood compartment alone contributes 0.8 L/kg to Vss before any tissue distribution is accounted for. In these cases, getting Rb right is more consequential for Vss prediction than refining individual tissue Kp estimates. A 20% error in Rb for a high-RBC-partitioning drug produces a larger error in predicted Vss than a twofold error in muscle Kp.
The ISSX 2025 trend report noted that Evotec is now offering automated high-throughput B:P determination, describing it as "addressing an undervalued input to improve PK prediction accuracy." This industry acknowledgment signals that B:P has been historically under-invested relative to its impact on PBPK model performance. For drug discovery programs building PBPK models to guide candidate selection, first-in-human dose prediction, or formulation strategy, investing in accurate, species-specific, concentration-ranged Rb data early in the program is among the highest-return ADME experiments available. When metabolite profiling or tissue distribution studies are needed to complement PBPK parameterization, our high-resolution metabolite quantification services provide simultaneous parent-metabolite data across plasma, whole blood, and tissue homogenate matrices.
From Raw Data to Curve to Parameters: A Practical Walkthrough
Consider a discovery-stage oral PK study in rat for a novel basic compound (MW 420, logP 3.2, pKa 8.1). Plasma samples at 0, 0.25, 0.5, 1, 2, 4, 6, 8, 12, and 24 h after a 10 mg/kg oral dose were analyzed by LC-MS/MS (LLOQ = 1.0 ng/mL). NCA on plasma data yielded: Cmax = 850 ng/mL; Tmax = 1.0 h; AUC₀→∞ = 4,200 ng·h/mL; t½ = 3.5 h; CL/F_plasma = 2,380 mL/h/kg; Vd/F_plasma = 12.0 L/kg.
Rat hepatic blood flow is approximately 3,300 mL/h/kg (55 mL/min/kg). CL/F_plasma = 2,380 mL/h/kg — if F = 1.0, this is 72% of hepatic blood flow, suggesting a moderate-to-high extraction drug.
Now measure B:P in rat blood in vitro at 500 nM (∼Cmax): Rb = 2.8. The compound extensively partitions into RBCs, expected for a lipophilic base. What changes?
First, blood clearance: CL/F_blood = 2,380 / 2.8 = 850 mL/h/kg. At F = 1.0, this is 26% of hepatic blood flow — a low-extraction drug. The plasma clearance gave a misleading picture because drug concentrated in RBCs, producing lower plasma concentrations and inflating the apparent clearance needed to account for the plasma profile.
Second, blood volume of distribution: Vd/F_blood = 12.0 / 2.8 = 4.3 L/kg. The plasma Vd of 12 L/kg suggested extensive tissue distribution; the blood Vd of 4.3 L/kg is consistent with moderate tissue uptake. The high plasma Vd was partly an artifact of RBC partitioning.
Third, the matrix decision: with Rb = 2.8, whole blood is the more appropriate bioanalytical matrix. Plasma data are valid for calculating plasma PK parameters, but must be converted to blood-based parameters before physiological interpretation, allometric scaling, or human dose projection.
The principle: plasma PK parameters without Rb are internally consistent but physiologically misleading. The blood-to-plasma ratio is the bridge between plasma mathematics and blood physiology — one additional experiment, one division, and the interpretation can change completely.
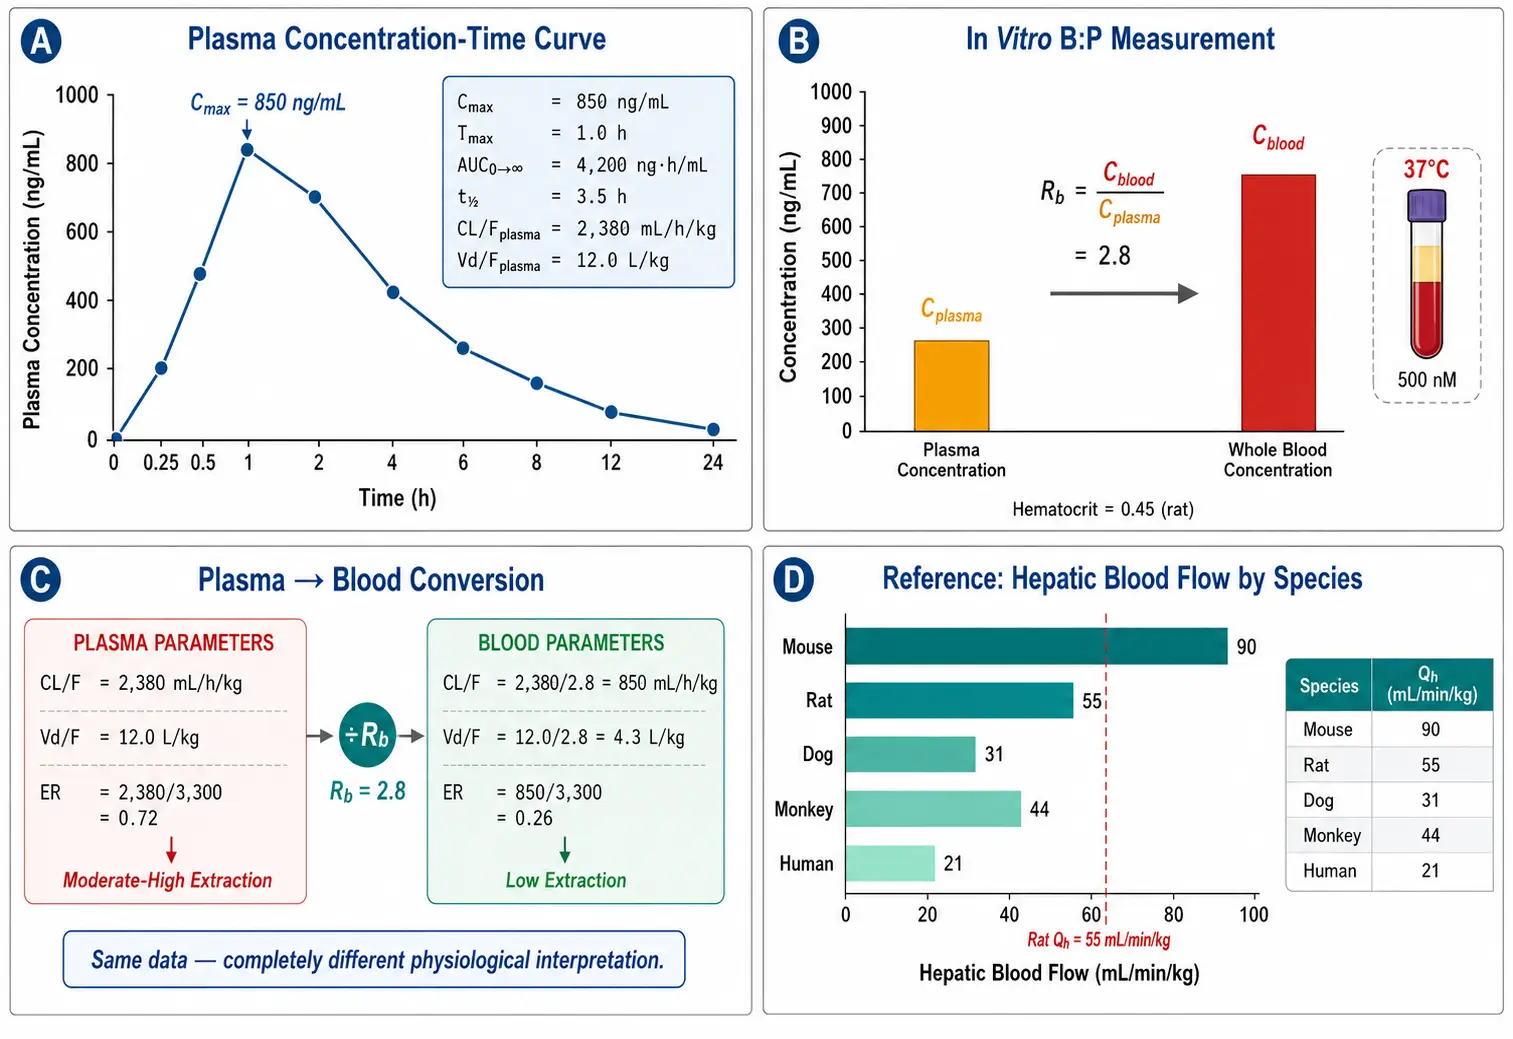 Figure 4: Step-by-step plasma-to-blood clearance correction with a worked example. (A) Plasma concentration-time curve (linear scale) with NCA-derived parameters annotated: Cmax, AUC, t½, CL/F_plasma, Vd/F_plasma. (B) The in vitro B:P measurement — a simple bar chart showing plasma concentration, whole blood concentration, and the resulting Rb = 2.8, with hematocrit noted. (C) The conversion calculation: CL_blood = CL_plasma/Rb, Vd_blood = Vd_plasma/Rb, shown as simple arithmetic with the physiological interpretation changing from "moderate-high extraction" to "low extraction." (D) Reference table of hepatic blood flow values across preclinical species (mouse, rat, dog, monkey, human) for context.
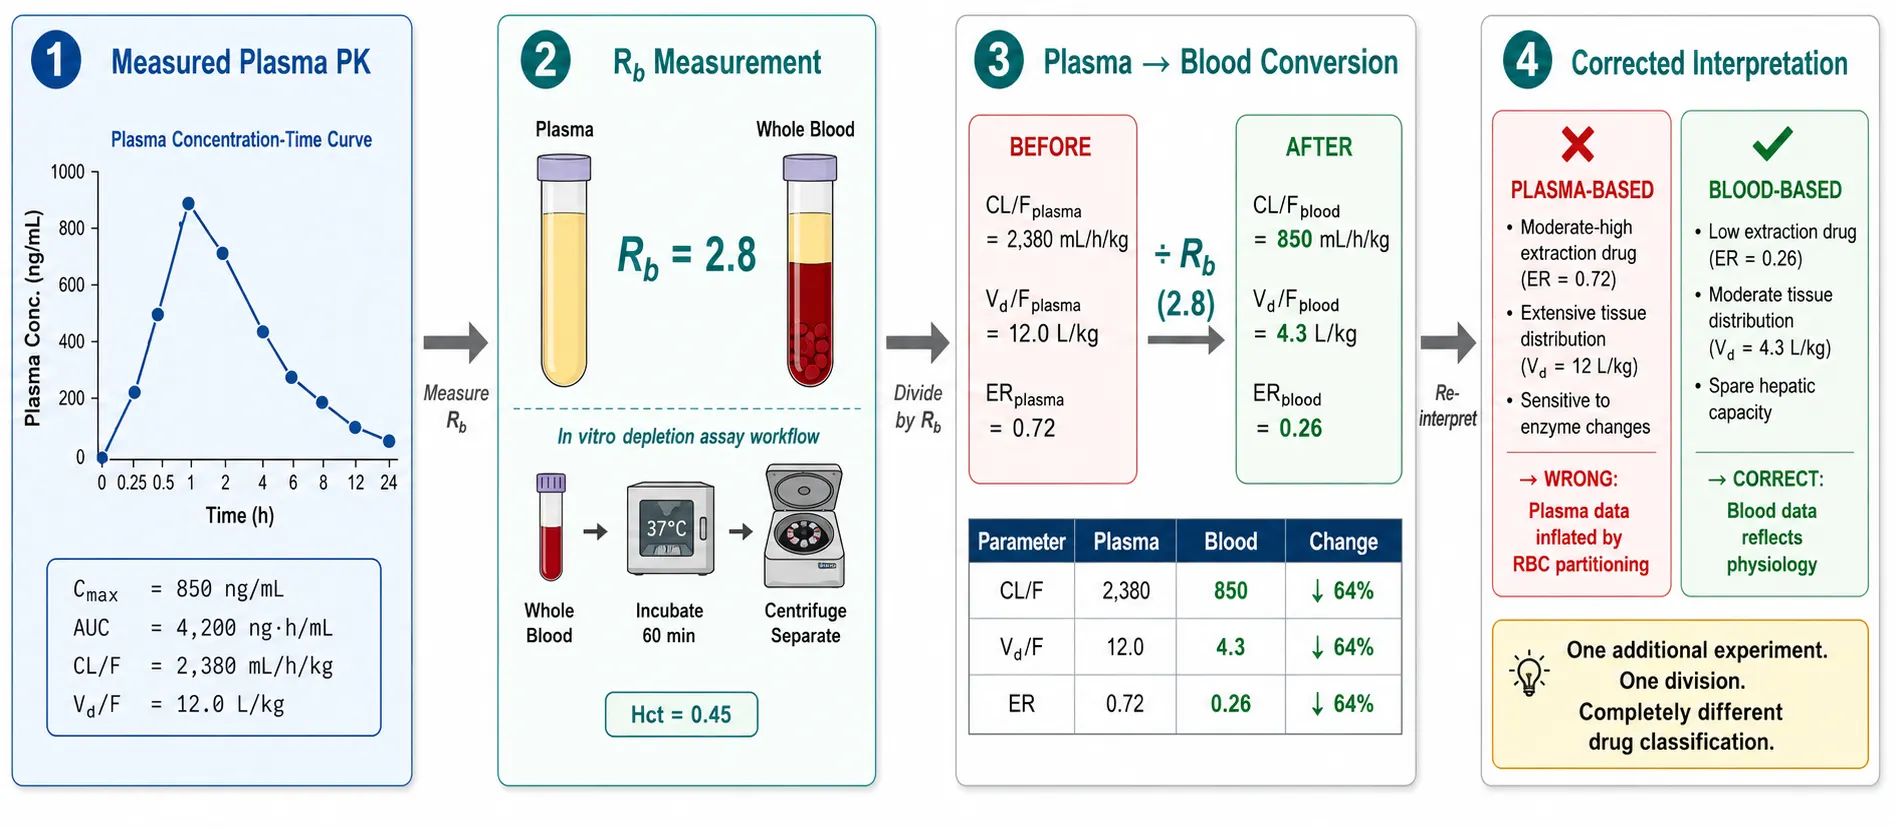 Figure 5: Clinical consequence chain of blood-to-plasma ratio on PK interpretation. A flow diagram in four stages: (1) Measured plasma concentration-time profile with NCA parameters; (2) The Rb measurement — in vitro depletion assay result showing Rb = 2.8; (3) The conversion step — CL_blood = CL_plasma / Rb, with before/after comparison of CL, Vd, and ER values; (4) The corrected physiological interpretation — plasma data suggested moderate-extraction drug, blood data reveals low-extraction drug. A small inset table compares plasma-based vs blood-based parameters side by side: CL/F (2,380 vs 850 mL/h/kg), Vd/F (12.0 vs 4.3 L/kg), ER (0.72 vs 0.26).
Frequently Asked Questions
At what Rb value should I switch from plasma to whole blood as my bioanalytical matrix?
There is no single universal threshold. Rb between 0.8 and 1.2 — plasma is adequate, hematocrit effects are negligible. Rb 0.5-0.8 or 1.2-2.0 — plasma is acceptable but document hematocrit and apply Rb correction when calculating blood CL. Rb < 0.5 or > 2.0 — strongly consider whole blood as the primary or parallel matrix, particularly for compounds entering regulatory studies. For Rb > 5, whole blood is mandatory — plasma concentrations are dominated by sample handling artifacts. Calibrate thresholds to your program's risk tolerance: a Phase I candidate with Rb = 2.5 warrants whole blood method development more than a discovery-stage compound after single-dose rat PK.
Can I use the B:P ratio measured in vitro for my in vivo PK calculations?
Yes, with verification. The in vitro depletion assay at 37°C generally agrees well with in vivo Rb for most small molecules. Three conditions warrant in vivo confirmation: (1) concentration-dependent B:P — a single in vitro concentration may not represent the dynamic in vivo range; (2) active RBC transporter involvement (GLUT1, Band 3) — in vitro equilibrium may not capture in vivo steady-state; (3) extensive metabolite RBC partitioning — parent Rb may differ from total drug-related material Rb. When in doubt, the Berezhkovskiy plasma dilution method provides in vivo Rb from the same PK study, eliminating the in vitro-to-in vivo extrapolation.
My plasma clearance exceeds liver blood flow — is my data wrong or is B:P the issue?
First, verify that your compound is actually cleared primarily by the liver. If renal clearance or extra-hepatic metabolism contributes significantly, plasma CL can legitimately exceed hepatic blood flow. If hepatic clearance is indeed dominant, check Rb. If Rb < 1, plasma clearance is inflated — divide by Rb to obtain blood clearance, which should fall within physiological bounds. If Rb ≥ 1 and plasma CL still exceeds hepatic blood flow, investigate: (a) nonlinear PK — clearance may be saturated at the dose tested, distorting NCA estimates; (b) metabolite interference in the LC-MS/MS assay inflating apparent parent concentrations; (c) formulation effects — if this is an oral dose and you are reporting CL/F, low bioavailability produces high apparent CL/F values, which is expected and not a data error. Our method validation services include cross-validation of plasma and whole blood assays to rule out matrix-specific analytical artifacts before questioning the PK data.
How do I measure B:P if my compound is unstable in blood at 37°C?
Three strategies, in order of preference. First, use enzyme inhibitors at 37°C — Novak et al. (2021) recommend this for carbonic anhydrase binders; the same principle applies to ester prodrugs (esterase inhibitors), peptide mimetics (protease inhibitors), and lactone-containing drugs (pH buffering). Second, use the 4°C method validated by Novak et al. — for non-carbonic anhydrase binders, cold-temperature Rb is comparable to 37°C. Third, use the Berezhkovskiy in vivo method — it measures Rb from routine PK samples under standard conditions, bypassing in vitro stability entirely. If the compound is extremely unstable, DBS with immediate spotting can lock in blood concentration at sampling.
If I don't have a B:P measurement, what's the worst that can happen to my PK interpretation?
Four progressively worse scenarios. (1) You report plasma clearance that is physiologically misleading — a drug with Rb = 0.4 appears to have 2.5× higher clearance than it actually does; a drug with Rb = 3 appears to have 3× lower clearance. (2) You misclassify the drug's extraction ratio — a low-extraction drug (ER_blood = 0.2) appears moderate (ER_plasma = 0.5), leading to incorrect predictions about first-pass extraction, food effect sensitivity, and DDI risk from enzyme inhibition. (3) You perform inter-species allometric scaling with species-biased plasma CL values — the resulting human CL prediction is systematically wrong because it embeds cross-species B:P variation into what should be a metabolic scaling relationship. (4) Your PBPK model produces a human PK prediction that is quantitatively wrong at every tissue level because the blood-to-plasma distribution — the first partitioning step in the model — was assumed instead of measured. The cost of one B:P experiment is trivial compared to the cost of a failed human dose prediction or an unnecessary matrix re-validation when regulators ask for whole blood data at the IND stage.
Can I assume mouse B:P equals rat B:P equals human B:P?
No. Even when Ke/p is identical across species, hematocrit differences alone produce different Rb values for any drug with Ke/p ≠ 1. In practice, Ke/p is frequently species-dependent due to differences in RBC membrane lipid composition, carbonic anhydrase isoform expression, and hemoglobin binding characteristics. The assumption of species-invariant Rb is most dangerous for compounds with high RBC partitioning (Rb > 2 in any species) and for programs where the rat is the primary PK species but the dog is the toxicology species — differences in Rb between rat and dog can produce systemic exposure differences at equivalent doses that are misinterpreted as species differences in clearance or bioavailability. The only reliable approach is to measure Rb in each preclinical species.
What is the difference between Rb and Ke/p — and which one do I report?
Ke/p (also written as K_e/p or C_RBC/C_plasma) is the RBC-to-plasma partition coefficient — the concentration ratio in the RBC fraction only versus plasma. Rb is the blood-to-plasma ratio — the concentration ratio in whole blood versus plasma, which incorporates both the plasma fraction and the RBC fraction weighted by hematocrit. The relationship is Rb = Ke/p × H + (1-H). Report Rb when your audience is making matrix decisions (plasma vs whole blood for bioanalysis) or performing plasma-to-blood clearance conversion. Report Ke/p when your audience is building PBPK models that require the RBC-specific partition coefficient as an input parameter separate from hematocrit. Most PK reports should include Rb, with H documented. PBPK model parameterization should include Ke/p. If you report only one, report Rb — it is the clinically and regulatorily relevant parameter, and Ke/p can be back-calculated if H is known.
References
- Yu S, Li S, Yang H, Lee F, Wu JT, Qian MG. A novel liquid chromatography/tandem mass spectrometry based depletion method for measuring red blood cell partitioning of pharmaceutical compounds in drug discovery. Rapid Communications in Mass Spectrometry. 2005;19(2):250-254. CC BY 4.0.
- Berezhkovskiy LM, Zhang X, Cheong J. A convenient method to measure blood-plasma concentration ratio using routine plasma collection in in vivo pharmacokinetic studies. Journal of Pharmaceutical Sciences. 2011;100(12):5293-5298. CC BY 4.0.
- Novak JJ, Burchett W, Di L. Effects of low temperature on blood-to-plasma ratio measurement. Biopharmaceutics & Drug Disposition. 2021;42(5):234-241. CC BY 4.0.
- Atkinson K, Britton K, Biggs J. Distribution and concentration of cyclosporin in human blood. Journal of Clinical Pathology. 1984;37(10):1167-1171. CC BY 4.0.
- The extensive erythrocyte-plasma partitioning of trametinib — implications for pharmacokinetic studies and therapeutic drug monitoring. Pharmacological Reports. 2025. CC BY 4.0.
- Meinderts JR, Versluis EAH, Berger SP, et al. Tacrolimus exposure during pregnancy in kidney and liver transplantation recipients: A comparison between whole blood and plasma concentration-to-dose ratios. British Journal of Clinical Pharmacology. 2026;92(6):1876-1885. CC BY 4.0.
- Tang H, Hussain A, Leal M, Mayersohn M, Fluhler E. Interspecies prediction of human drug clearance based on scaling data from one or two animal species. Drug Metabolism and Disposition. 2007;35(10):1886-1893. CC BY 4.0.
- Xu G, Chen JS, Phadnis R, Huang T, Uyeda C, Soto M, Stouch B, Wells MC, James CA, Carlson TJ. Application of DBS sampling in combination with LC-MS/MS for pharmacokinetic evaluation of a compound with species-specific blood-to-plasma partitioning. Bioanalysis. 2012;4(16):2037-2047. CC BY 4.0.
Disclaimer: All services and resources mentioned on this site are for research use only (RUO) and are not intended for diagnostic, therapeutic, or clinical applications.
Related Services


