When a drug development program requires tissue concentration data — and most do, whether for tissue distribution studies, target engagement confirmation, or the tissue-to-plasma Kp calculation that feeds physiologically based pharmacokinetic (PBPK) models — the bioanalytical method must solve a problem that plasma methods never face. Plasma arrives at the bench as a ready-to-extract liquid. Tissue arrives as a solid, heterogeneous piece of an organ with drug trapped inside cells, bound to structural proteins, and distributed unevenly across anatomical compartments. Getting the drug out quantitatively, reproducibly, and without degrading it requires homogenization, and the choice of homogenization method — bead beating, rotor-stator, or enzymatic digestion — determines which drug concentrations you measure and whether they represent the true tissue concentration. For the complete workflow from homogenized tissue to validated concentration data, see our article on tissue drug quantification by LC-MS/MS. Our custom LC-MS/MS method development services include tissue-specific homogenization protocol optimization for each organ type in your study.
Why Tissue Homogenization Is Different: The Bioanalytical Challenge
Plasma is a homogeneous liquid that requires no physical disruption before extraction. Tissue is the opposite. A piece of liver, lung, or brain is a three-dimensional solid with intact cellular architecture, connective tissue scaffolding, and regionally heterogeneous drug distribution. Drug molecules inside hepatocytes cannot be extracted by simply adding solvent to a tissue chunk — the solvent cannot access intracellular drug until the cell membrane and tissue matrix are physically disrupted.
The three goals of homogenization for drug bioanalysis are: (a) complete tissue disruption — the homogenate must contain no visible residual particles larger than approximately 10 μm that would clog autosampler injection systems or cause pipetting irreproducibility; (b) quantitative drug release — all drug molecules must be liberated from cells and tissue structures into the homogenate liquid phase, available for subsequent extraction; and (c) reproducibility — the homogenization method must produce consistent results across dozens or hundreds of study samples.
The key performance metrics that differentiate methods are: minimum particle size achievable, processing time per sample, throughput (samples per batch), carryover risk between samples, and whether the method generates heat that can degrade thermolabile analytes. No single method is optimal for all tissue types. A mouse liver and a rat skin biopsy present fundamentally different homogenization challenges, and applying the wrong method produces systematic negative bias in measured drug concentrations. For tissue drug quantification across diverse organ types, our tissue and cell lysate drug quantification services provide validated homogenization and extraction protocols matched to each tissue type.
Method 1 — Bead Beating: The High-Throughput Workhorse
Bead beating works by placing tissue into a sealed disposable tube containing ceramic, glass, or steel beads, then subjecting the tube to high-speed reciprocal shaking — typically 4-6 m/s for 2-8 minutes. The beads impact and shear the tissue from all directions simultaneously, reducing it to a fine homogenate. Because the tube is sealed and disposable, there is no physical contact between samples and the homogenizer instrument, eliminating cross-contamination risk entirely. This sealed-tube, single-use format is the same principle that made bead beating the gold standard for PCR and RNA extraction, where even trace cross-contamination is unacceptable.
The definitive head-to-head comparison comes from Liang et al. (2011, Bioanalysis), who evaluated FastPrep bead beating against OmniPrep rotor-stator and collagenase digestion for preparing mouse tissue samples for LC-MS/MS drug quantification. For soft parenchymal organs — brain, kidney, spleen — the FastPrep bead beater achieved complete homogenization to less than 10 μm particle size within 40-120 seconds using 2-mL tubes. For mouse liver in 15-mL tubes with 8.5 g of 1.4-mm ceramic beads, 8 minutes produced complete homogenization, processing 24 samples in parallel. Critically, the rotor-stator method left 20-30 μm residual particles in liver homogenate even after 8 minutes — the bead beater was measurably superior.
Tissue-specific parameters from the Liang et al. optimized protocol: soft tissues (brain, kidney, spleen, liver) — 15-mL tubes, ceramic beads, 8 minutes; bone marrow — 2-mL tubes, 1 g of 1.4-mm beads, 40 seconds; fibrous tissues (lung, heart) — bead beating alone was insufficient regardless of duration, with visible tissue chunks persisting after 10 minutes.
The carryover advantage is decisive. Bead beating uses sealed disposable tubes and disposable beads — no sample-to-sample contact, no probe to clean, no carryover. This is a fundamental advantage over reusable-probe methods and one of the primary reasons bead beating has become the first-choice method for tissue bioanalysis in drug discovery. Our sample preparation and processing services include bead-beating protocol optimization with tissue-specific bead size, tube format, and processing time parameters. Limitations exist: bead beating alone cannot fully homogenize collagen-rich fibrous tissues (lung, heart, skin), generates heat through friction that requires pre-chilling tubes on ice, and tubes can leak at the cap seal if not properly tightened at high speed.
Method 2 — Rotor-Stator: The Conventional Approach with Caveats
The rotor-stator homogenizer operates on a different principle: a rapidly rotating blade inside a stationary slotted stator draws tissue upward through the stator slots, shearing it between the rotor and stator surfaces. This is the traditional laboratory homogenizer — the Polytron-type or OmniPrep-type instrument familiar to most bioanalytical laboratories.
The Liang et al. (2011) comparison revealed an important performance gap. For mouse liver, the OmniPrep rotor-stator produced particles of 20-30 μm after 8 minutes of processing, compared to less than 10 μm for the FastPrep bead beater over the same duration. The 20-30 μm particles are visible under light microscopy and represent incompletely disrupted tissue that may contain unreleased drug. If a method validation does not include microscopic examination of homogenate particle size, this incomplete disruption can go undetected — the homogenate may appear uniform to the naked eye while containing drug-trapping tissue fragments.
Carryover is the rotor-stator's most significant weakness for regulated bioanalysis. The reusable stainless steel probe contacts each sample directly. Between samples, the probe must be cleaned — typically three washes with 70% ethanol followed by autoclaving. Incomplete cleaning introduces cross-contamination that can produce false-positive results in the next sample, particularly problematic when analyzing samples from a PK time course where adjacent samples may differ in concentration by orders of magnitude. Disposable plastic probe tips are available but add significant per-sample cost. For high-throughput studies with hundreds of tissue samples, the cumulative carryover risk from reusable probes makes rotor-stator homogenization increasingly difficult to defend during regulatory inspection. For regulated bioanalysis requiring defensible carryover documentation, our method validation services include cross-contamination assessment across the full homogenization-to-injection workflow.
Rotor-stator homogenization generates more heat than bead beating — the mechanical shear at the rotor-stator interface converts to thermal energy — and ice-bath cooling during processing is mandatory to prevent analyte degradation. Foaming is an additional problem: the high-speed rotor introduces air into protein-rich homogenates, creating foam that complicates accurate volume measurement. Despite these limitations, rotor-stator instruments remain useful for initial disruption of large tissue pieces (grams rather than milligrams) before further processing, and for laboratories with existing capital investment in the equipment.
Method 3 — Enzymatic Digestion: The Solution for Tough Tissues
For tissues where mechanical methods fail — lung with its dense elastic fiber network, heart with tough myocardium, skin with collagen-dense dermis, and bone — enzymatic digestion is not an optional enhancement but a necessity. Collagenase hydrolyzes the collagen triple-helix that forms the structural scaffold of connective tissues. Proteinase K digests a broader range of structural proteins. Once the collagen matrix is enzymatically softened, a brief bead beating step or solvent extraction releases drug that mechanical homogenization alone would leave trapped inside tissue fragments.
Qin et al. (2015, Bioanalysis), from the Drug Metabolism and Pharmacokinetics group at Genentech, systematically evaluated collagenase digestion as a tissue preparation tool for LC-MS/MS drug quantification. The optimized protocol — tissue incubated with collagenase solution for 1 hour at 37°C, followed by 2 minutes of bead beating — achieved complete drug recovery from tough tissues where mechanical methods had demonstrably failed. The collagenase treatment produced minimal matrix effects (IS-normalized matrix factor 0.90-1.10) and the authors reported "little to no effects on the quality and reliability" of the resulting LC-MS/MS data for small-molecule drugs.
When is enzymatic digestion mandatory rather than optional? Lung tissue — the dense elastic fiber network resists all forms of mechanical shear; without collagenase pre-treatment, drug recovery from lung can be below 50% of the true concentration. Heart — tough myocardium requires collagenase pre-digestion. Skin — the collagen-dense dermis is essentially impervious to bead beating alone; collagenase or proteinase K digestion is the only method that achieves quantitative drug release. Bone — requires dense steel beads in a bead beater, enzymatic demineralization with EDTA, or a combination of both.
One critical caveat: enzymatic digestion is contraindicated for biotherapeutics and protein/peptide drugs because collagenase and proteinase K can cleave the analyte itself. For small molecules, enzymatic cleavage of the drug is rarely a concern — the active sites of collagenase and proteinase K target peptide bonds in structural proteins, not small-molecule drug structures. Qin et al. confirmed acceptable stability for the small-molecule drugs in their evaluation. For peptide therapeutics, alternative approaches — cryogenic milling, dense-bead mechanical disruption at low temperature, or chemical digestion with non-enzymatic reagents — should be evaluated. Our custom LC-MS/MS method development services include analyte-specific stability testing under enzymatic digestion conditions to ensure method suitability before study start.
The Tissue-Type Recommendation Matrix: Which Method for Which Organ
The choice of homogenization method should be dictated by tissue type, not by laboratory habit. A systematic framework, derived from the Liang et al. and Qin et al. data, provides clear recommendations.
Soft parenchymal organs — brain, kidney, spleen, liver — are adequately homogenized by bead beating alone. These tissues lack the dense connective tissue that resists mechanical disruption. Bead beating provides fast processing (2-8 minutes), high throughput (24 samples in parallel), and zero carryover risk. For most drug distribution studies where liver, kidney, and brain are the primary tissues of interest, bead beating is the optimal first-line method. Our single drug quantification services handle tissue homogenates from all major organ types with matrix-matched calibration.
Bone marrow is uniquely easy to homogenize — the tissue is already semi-liquid — and requires only brief bead beating (40 seconds in 2-mL tubes) to produce a uniform suspension suitable for extraction.
Tough fibrous organs — lung and heart — require collagenase pre-digestion for 1 hour at 37°C followed by bead beating for 2 minutes. This is the only approach that achieves complete drug release from these tissues, and any method claiming to fully homogenize lung or heart by mechanical means alone should be verified by microscopy and recovery comparison against the enzymatic method.
Skin occupies a category of its own. The collagen-dense dermis resists all mechanical homogenization methods. Collagenase or proteinase K digestion is mandatory — without it, drug recovery can be below 50%, particularly for drugs that bind to dermal collagen. This has direct implications for topical drug development programs and dermatology PK studies.
Bone requires either dense steel beads (larger and heavier than ceramic, typically 2.8-5 mm) in a bead beater with extended processing time, or enzymatic demineralization with EDTA followed by collagenase digestion. For calcified bone, cryogenic milling in liquid nitrogen — which embrittles the bone matrix — followed by bead beating is an effective alternative.
Adipose tissue presents a different problem. The high lipid content causes unique extraction challenges — homogenize cold (4°C) to keep fat semi-solid, as liquid fat at room temperature separates from the aqueous homogenate and traps lipophilic drugs. Lipophilic extraction solvents — methyl tert-butyl ether (MTBE) or hexane-based mixtures — are preferred for subsequent liquid-liquid extraction. For adipose tissue and other high-lipid-content samples, our complex biological matrices analysis services provide lipid-depletion strategies optimized for quantitative bioanalysis.
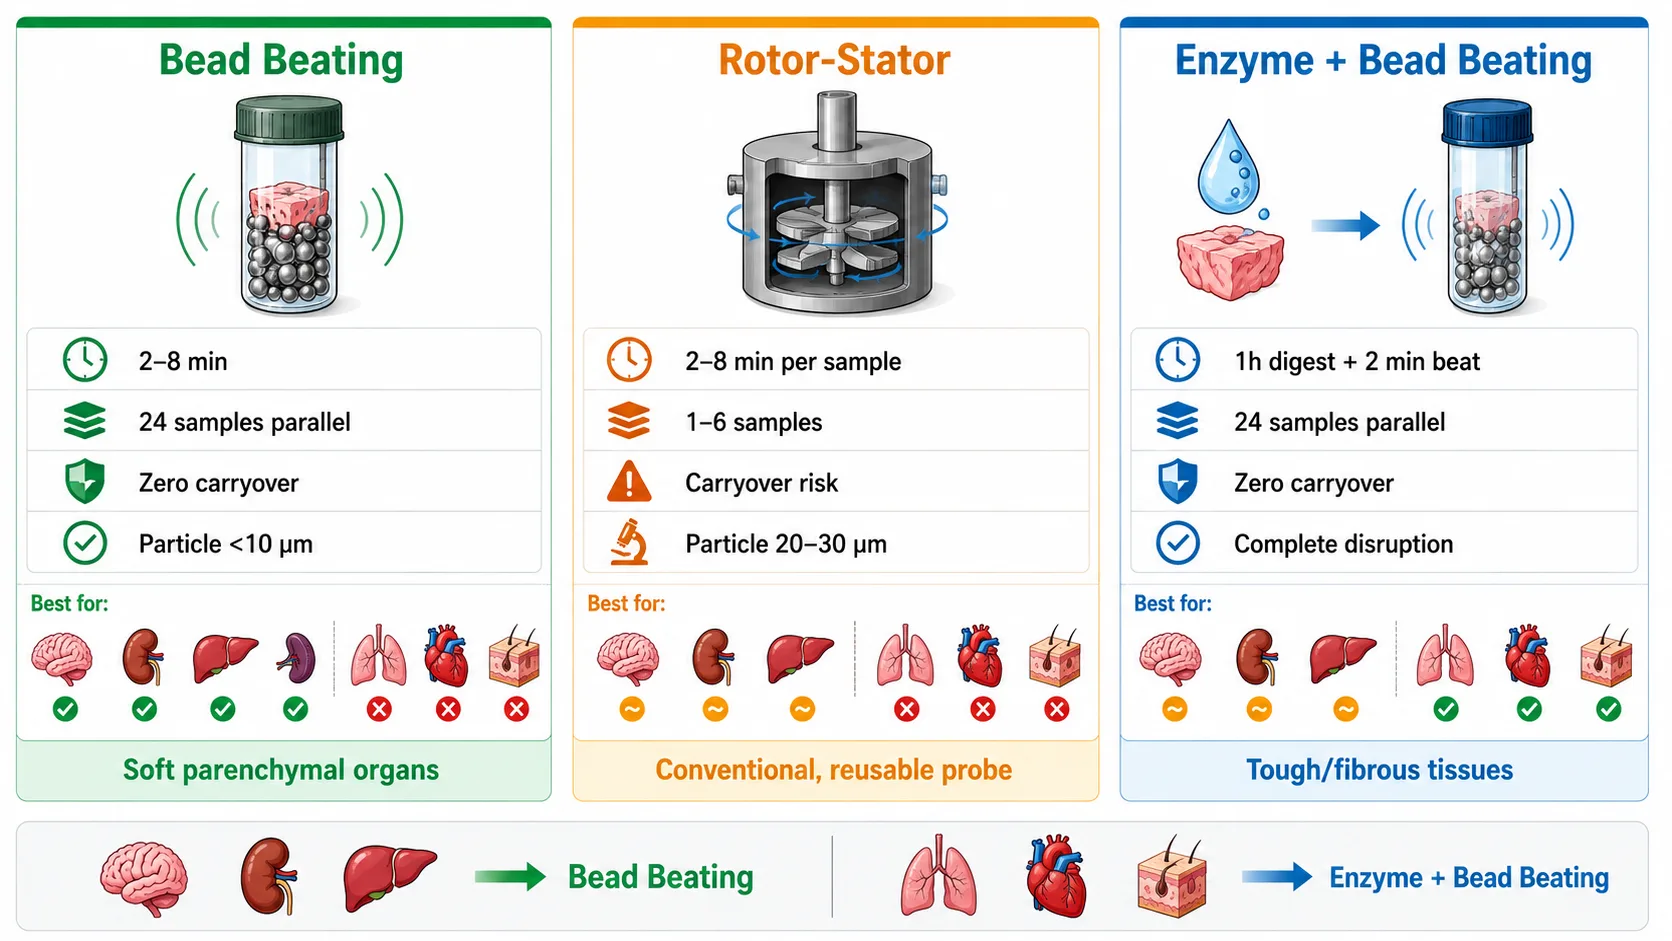 Figure 1: Three-method comparison infographic. Three columns: Bead Beating (left), Rotor-Stator (center), Enzymatic Digestion (right). Each column shows: mechanism icon, processing time, throughput, carryover risk (color-coded: green/yellow/red), particle size achieved, and a tissue-type suitability bar (which tissues this method works for). Bottom row: a summary recommendation matrix — 6 tissue types × recommended method(s). Color coding for tissue types shows green = method alone sufficient, amber = method acceptable with caveats, red = method not recommended.
The Dilution Factor Trap: How to Correctly Back-Calculate Tissue Concentration
After homogenization and LC-MS/MS analysis, the concentration reported by the instrument is in units of ng/mL — the concentration in the homogenate extract, not in the original tissue. Converting to the tissue concentration in ng/g requires a back-calculation that is deceptively simple and frequently wrong.
The correct equation is: tissue drug concentration (ng/g) = homogenate concentration (ng/mL) × total homogenate volume (mL) / tissue weight (g). Each variable carries an uncertainty, but the most common error is in the total homogenate volume term.
The trap: total homogenate volume is not equal to the volume of buffer added. Tissue itself contributes volume — approximately 0.95-1.05 mL per gram for most soft tissues (slightly less for adipose, slightly more for blood-rich organs). If you add 3 mL of buffer to 1 g of liver and assume the total volume is 3 mL, the actual volume is approximately 3.95 mL (3 mL buffer + ∼0.95 mL tissue contribution). The resulting concentration calculated using 3 mL would be underestimated by approximately 25% — a systematic error applied to every sample in a study. Across an entire PK tissue distribution dataset, this level of systematic bias can invalidate tissue-to-plasma ratio calculations and the PBPK model parameters derived from them. Our bioanalytical method development services include dilution factor verification as part of every tissue method, ensuring back-calculation accuracy before study samples are analyzed.
The fix is straightforward: after homogenization, transfer the homogenate to a graduated tube and measure the actual total volume, or use the density assumption (tissue density approximately 1.04-1.06 g/mL for most organs, contributing approximately 0.95 mL per gram of tissue) to calculate true total volume from the known tissue weight and buffer volume. An alternative approach is to homogenize tissue in a known buffer volume, then bring the homogenate to a defined final volume in a volumetric flask — eliminating volume measurement uncertainty entirely.
A separate but related question is whether to report tissue concentration as ng/g tissue or ng/mg protein. Tissue weight (ng/g) is the standard convention for most PK applications because it is directly comparable across studies and species. Protein-normalized concentration (ng/mg protein) is preferred when tissue samples are very small — needle biopsies of 5-20 mg where accurate weighing is challenging — and when comparing drug concentrations across tissues with very different protein contents. The protein content of tissue homogenate is measured by Bradford or BCA assay on a small aliquot, and the drug concentration is normalized to mg of total protein rather than grams of tissue.
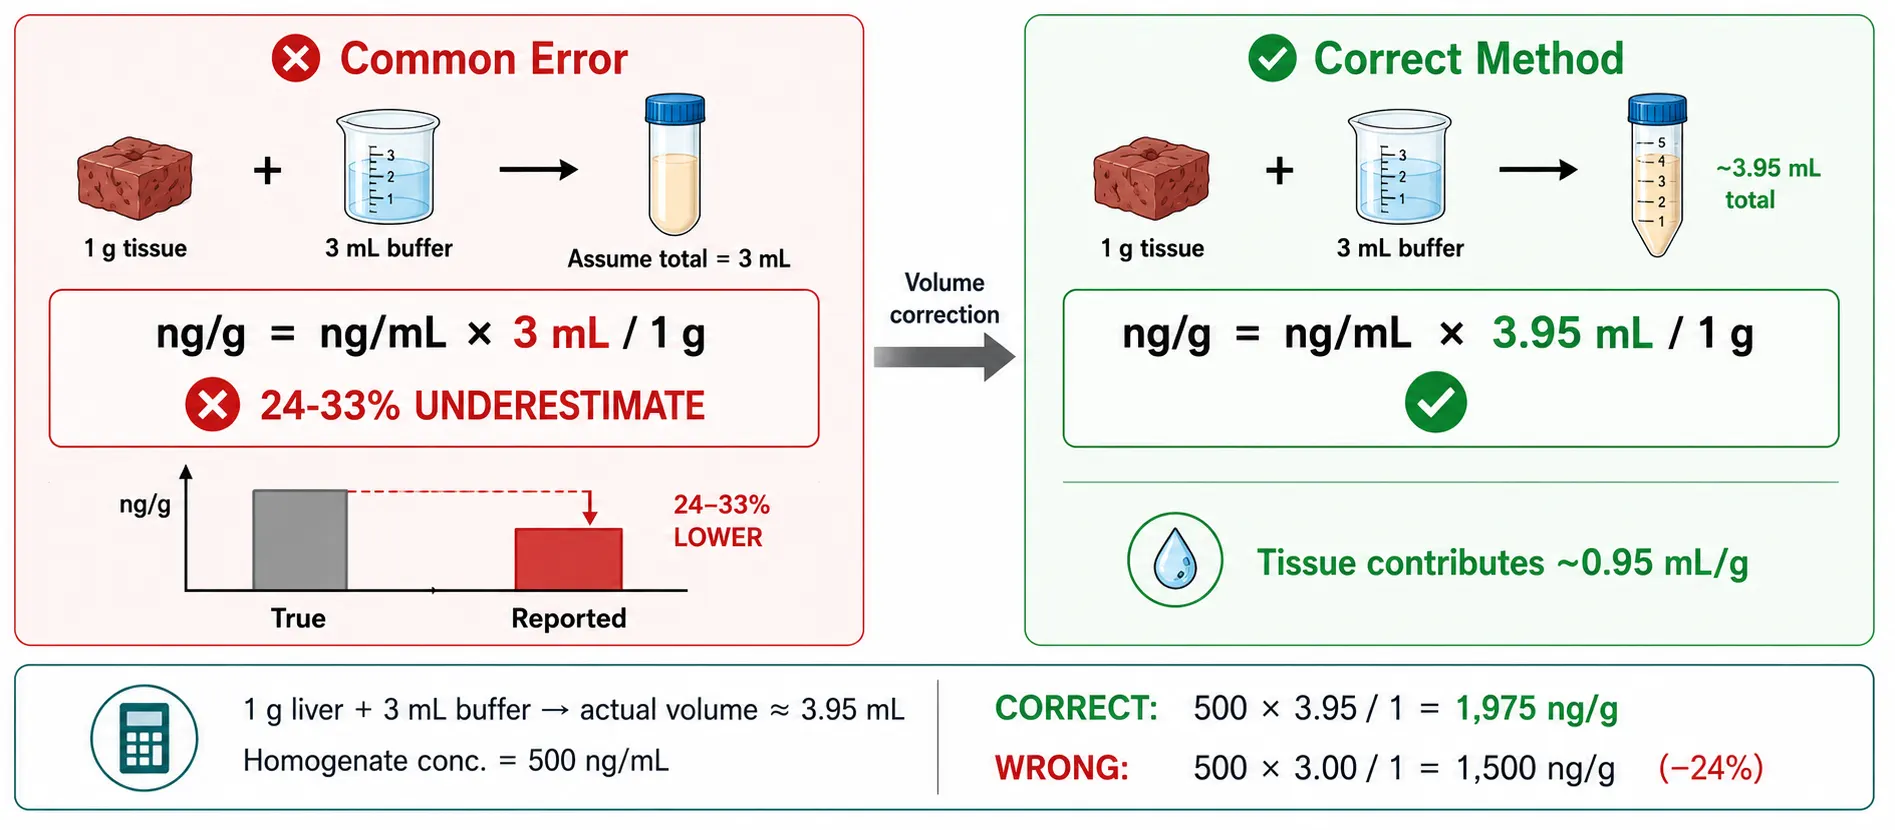 Figure 2: Dilution factor back-calculation diagram. Left side: "Wrong way" — buffer volume used as total volume, with a visual of 3 mL buffer + 1g tissue → 3.95 mL actual, but calculation uses 3 mL → 24% underestimation. Right side: "Correct way" — measured total volume after homogenization, or density-corrected volume (∼0.95 mL/g tissue). Worked numerical example: 1g liver + 3 mL buffer → total volume 3.95 mL → homogenate conc. 500 ng/mL → tissue conc. = 500 × 3.95 / 1 = 1975 ng/g (correct) vs 500 × 3.0 / 1 = 1500 ng/g (wrong, 24% low).
Recovery Assessment Without Blank Tissue: Solving the Unsolvable Problem
The most fundamental challenge in tissue bioanalysis is one that does not exist for plasma methods: you cannot spike drug into blank tissue to measure absolute extraction recovery because you do not have blank tissue. Control tissue from untreated animals contains no drug, but once you spike drug onto or into an intact tissue piece, the drug is on the surface and in the extracellular space — not inside cells, not bound to intracellular proteins, not distributed across tissue compartments the way it is in an incurred sample from a dosed animal. The recovery measured from a spike-into-blank-tissue experiment reflects extraction efficiency from the homogenate, not recovery from the true in vivo drug distribution state. Four strategies address this problem, each with different strengths.
Strategy 1 — Standard addition method. Divide the incurred tissue homogenate into multiple aliquots. Spike increasing known amounts of drug into each aliquot. Construct a calibration curve of response versus spike amount. The x-intercept of the regression line (extrapolated backward to zero response) gives the original homogenate concentration. This method is self-calibrating — it requires no blank tissue and no external calibration curve. Its limitation is that it consumes significant sample volume (typically 5-6 aliquots per determination) and is therefore impractical for small tissue samples or large studies.
Strategy 2 — Orthogonal method comparison. Homogenize two portions of the same tissue sample by fundamentally different methods — mechanical (bead beating) and enzymatic (collagenase digestion). If both methods yield the same drug concentration, recovery is adequate for both because the two methods release drug through entirely different mechanisms. If bead beating gives a lower concentration than collagenase digestion for a tough tissue, the mechanical method is failing to release all drug and the enzymatic method provides the more accurate value. This approach requires no blank tissue, no radiolabel, and no additional animals. It is the most practical recovery verification strategy for routine method development.
Strategy 3 — Surrogate tissue QC from naive animals. Obtain blank tissue from untreated animals of the same strain, age, and sex. Spike drug into intact tissue pieces (not homogenate), incubate to allow penetration, then homogenize and extract. While not identical to true incurred tissue — the drug distribution pattern after in vitro spiking differs from in vivo distribution — this approach provides the closest practical approximation to true recovery without using radiolabeled material. Ho and Gao (2015, Bioanalysis) provide a comprehensive framework for validating surrogate matrix suitability for tissue analysis, including the critical comparison of recovery between surrogate and authentic matrix.
Strategy 4 — Radiolabeled incurred tissue (definitive validation). Co-dose animals with ³H- or ¹⁴C-labeled drug alongside unlabeled drug. Total radioactivity measured by liquid scintillation counting represents 100% of drug present in the tissue. The LC-MS/MS-measured concentration divided by the total radioactivity-derived concentration gives the absolute method recovery. This is the gold standard but requires a radiolabel synthesis, dedicated liquid scintillation counting equipment, and radioactive waste disposal — it is reserved for definitive method validation, not routine use.
For most drug discovery and development applications, the orthogonal method comparison (Strategy 2) combined with surrogate tissue QC (Strategy 3) provides adequate recovery characterization without the cost and complexity of radiolabeled studies. Our internal standard selection services help identify stable isotope-labeled analogs that correct for tissue-specific matrix effects across diverse homogenization methods. The standard addition method (Strategy 1) is useful for small numbers of critical samples. Radiolabeled recovery (Strategy 4) is appropriate for the definitive validation of a method that will support regulatory submission for a lead candidate.
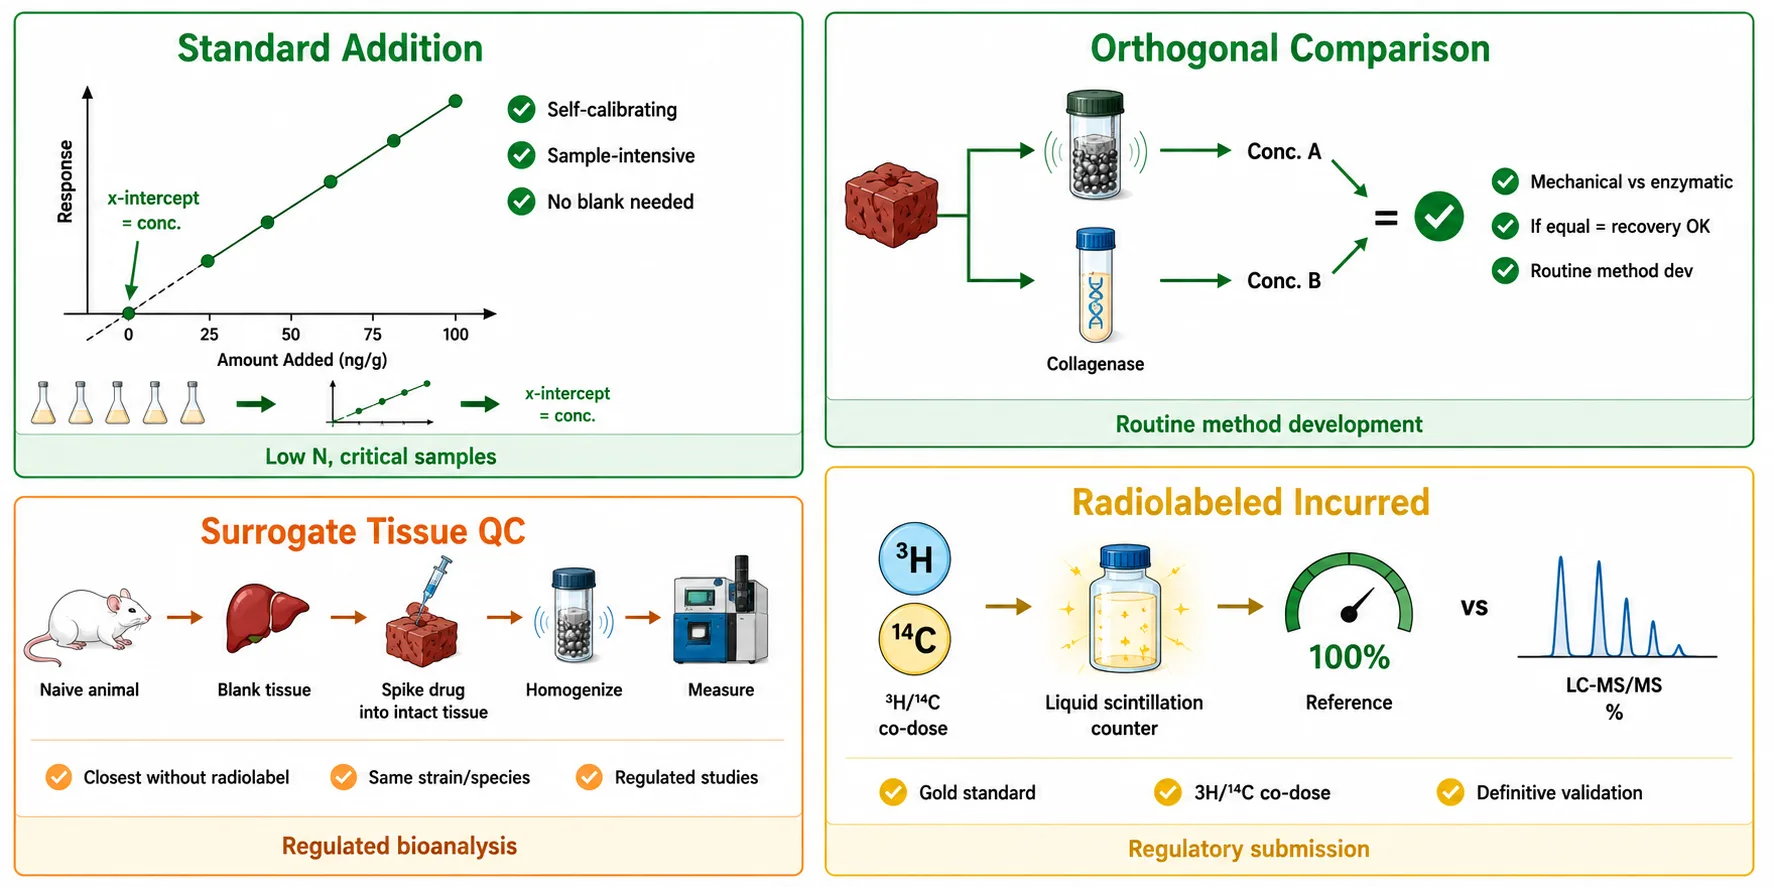 Figure 3: Recovery without blank tissue — four strategies comparison. A 2×2 grid: Strategy 1 (Standard Addition) — x-intercept diagram, label "Self-calibrating, sample-intensive"; Strategy 2 (Orthogonal Comparison) — two arrows (mechanical vs enzymatic) converging to same value, label "No blank needed, practical for routine"; Strategy 3 (Surrogate Tissue QC) — naive animal → spike → homogenize, label "Closest to true recovery without radiolabel"; Strategy 4 (Radiolabeled) — ³H/¹⁴C symbol, label "Gold standard, costly." Color coding: green border for routine-use strategies, amber for regulated studies, gold for definitive validation.
The Reproducibility Killers: Sampling, Heating, and Incomplete Disruption
Three variables can introduce systematic bias into tissue drug concentration data regardless of how well the LC-MS/MS method itself performs.
Tissue sampling heterogeneity. Drug distribution within an organ is not uniform. In the liver, drug concentration differs between the portal and central lobular regions. In the kidney, cortical and medullary concentrations can differ by several-fold. In the brain, gray matter and white matter drug concentrations are rarely equivalent. Taking a non-representative sub-sample from one region of a heterogeneous organ can bias the measured concentration by 50% or more relative to the whole-organ average. The fix: homogenize the entire organ when size permits (mouse organs are routinely processed whole); when the organ is too large, standardize the sampling location and document it in the protocol — "left lateral lobe of liver, central portion" is reproducible; "a piece of liver" is not.
Heating during homogenization. Mechanical energy input during bead beating or rotor-stator processing converts to heat. For thermolabile analytes — N-oxide metabolites that undergo thermal rearrangement, ester prodrugs that hydrolyze, compounds with temperature-dependent protein binding — this heating can cause analyte degradation or redistribution during the homogenization step itself. Bead beating generates less heat than rotor-stator processing because the energy is distributed across many small impact events rather than concentrated at a single shear interface. Mitigation: pre-chill all tubes, beads, and buffer to 4°C; process samples on ice; minimize homogenization time to the minimum duration validated to achieve complete disruption.
Incomplete tissue disruption. The most common cause of low tissue drug recovery is incomplete homogenization that goes undetected because no one looked at the homogenate under a microscope. Visible tissue chunks in the homogenate are an obvious red flag, but particles in the 20-50 μm range — large enough to trap drug, small enough to be invisible to the naked eye — are the insidious problem. During method development, examine homogenate under a light microscope at 40× magnification. If particles larger than approximately 10 μm are present, increase bead beating time, add beads, or add an enzymatic pre-digestion step. Do not proceed to extraction until the homogenate is microscopically particle-free.
Tissue-to-buffer ratio. The recommended ratio is 1:3 to 1:5 (tissue:buffer, w/v). Too little buffer produces a thick slurry that does not homogenize uniformly and may saturate the extraction solvent capacity. Too much buffer over-dilutes the homogenate, reducing analytical sensitivity. The optimal ratio should be determined during method development by testing homogenization completeness and extraction recovery at 1:2, 1:3, 1:5, and 1:10 ratios.
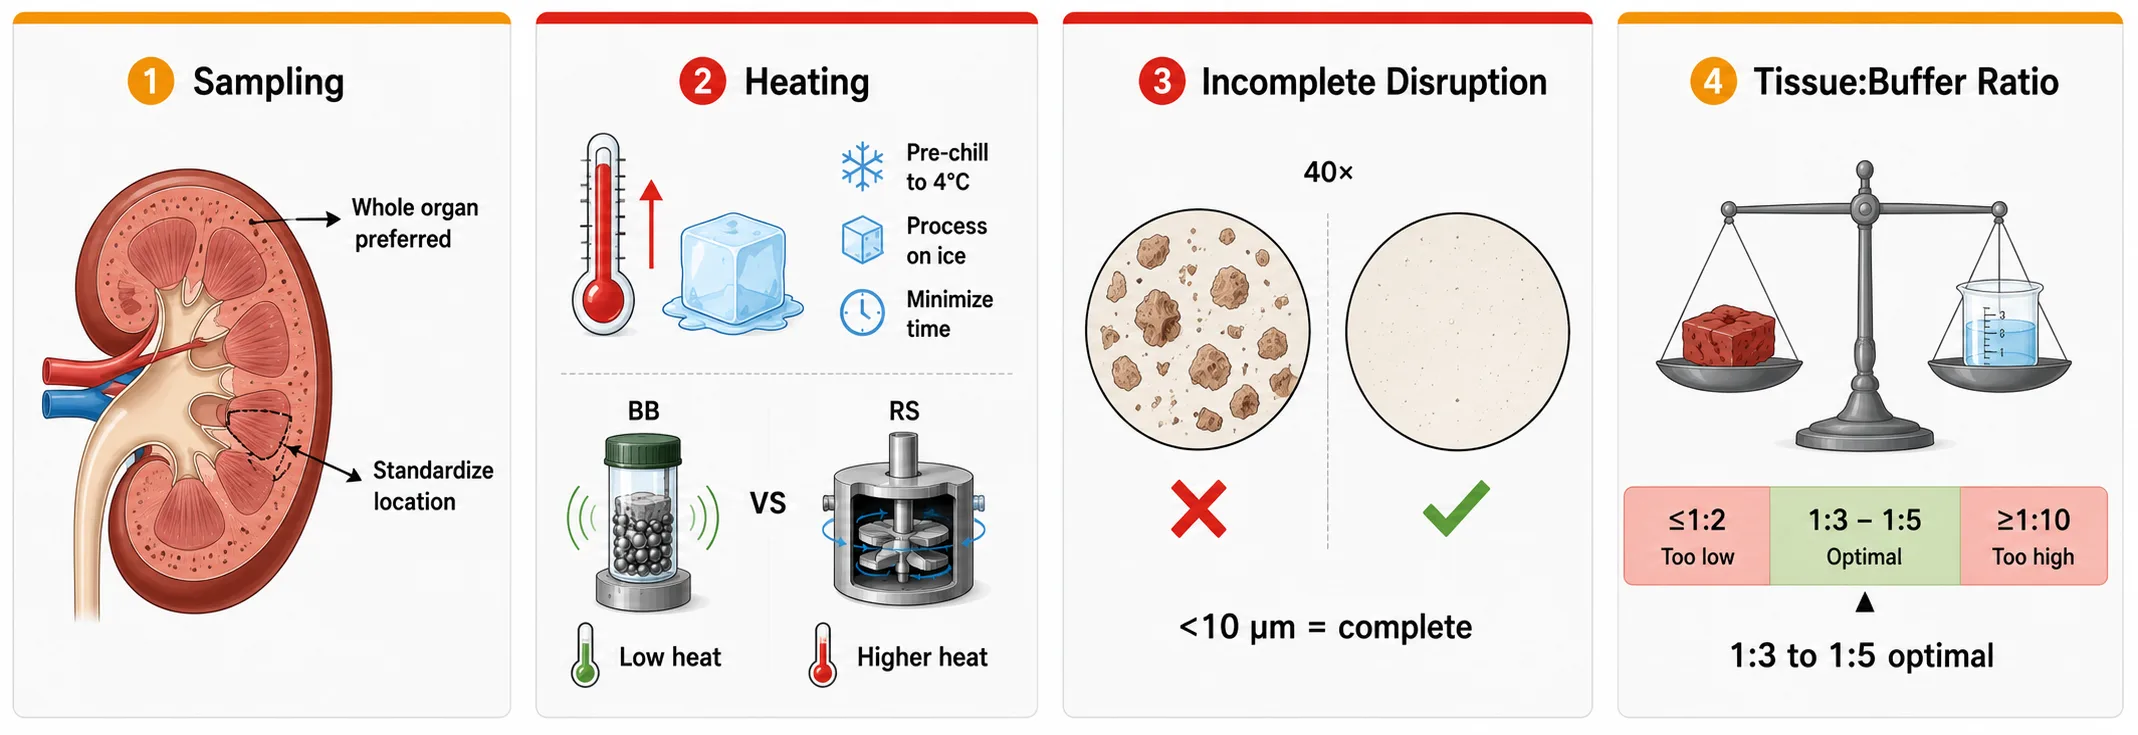 Figure 4: Reproducibility killer infographic. Four panels in a horizontal row, each with a warning icon: (1) Sampling — two kidneys, one with a wedge cut showing cortex vs medulla, label "Whole organ or standardized location"; (2) Heating — thermometer icon with ice symbol, label "Pre-chill, process on ice"; (3) Incomplete disruption — microscope view showing particle-free vs chunky homogenate, label "Check under microscope"; (4) Ratio — tissue:buffer scale icons showing 1:3 and 1:5 as green, 1:2 and 1:10 as red, label "1:3 to 1:5 optimal." Clean white background, warning amber (#F39C12) accents.
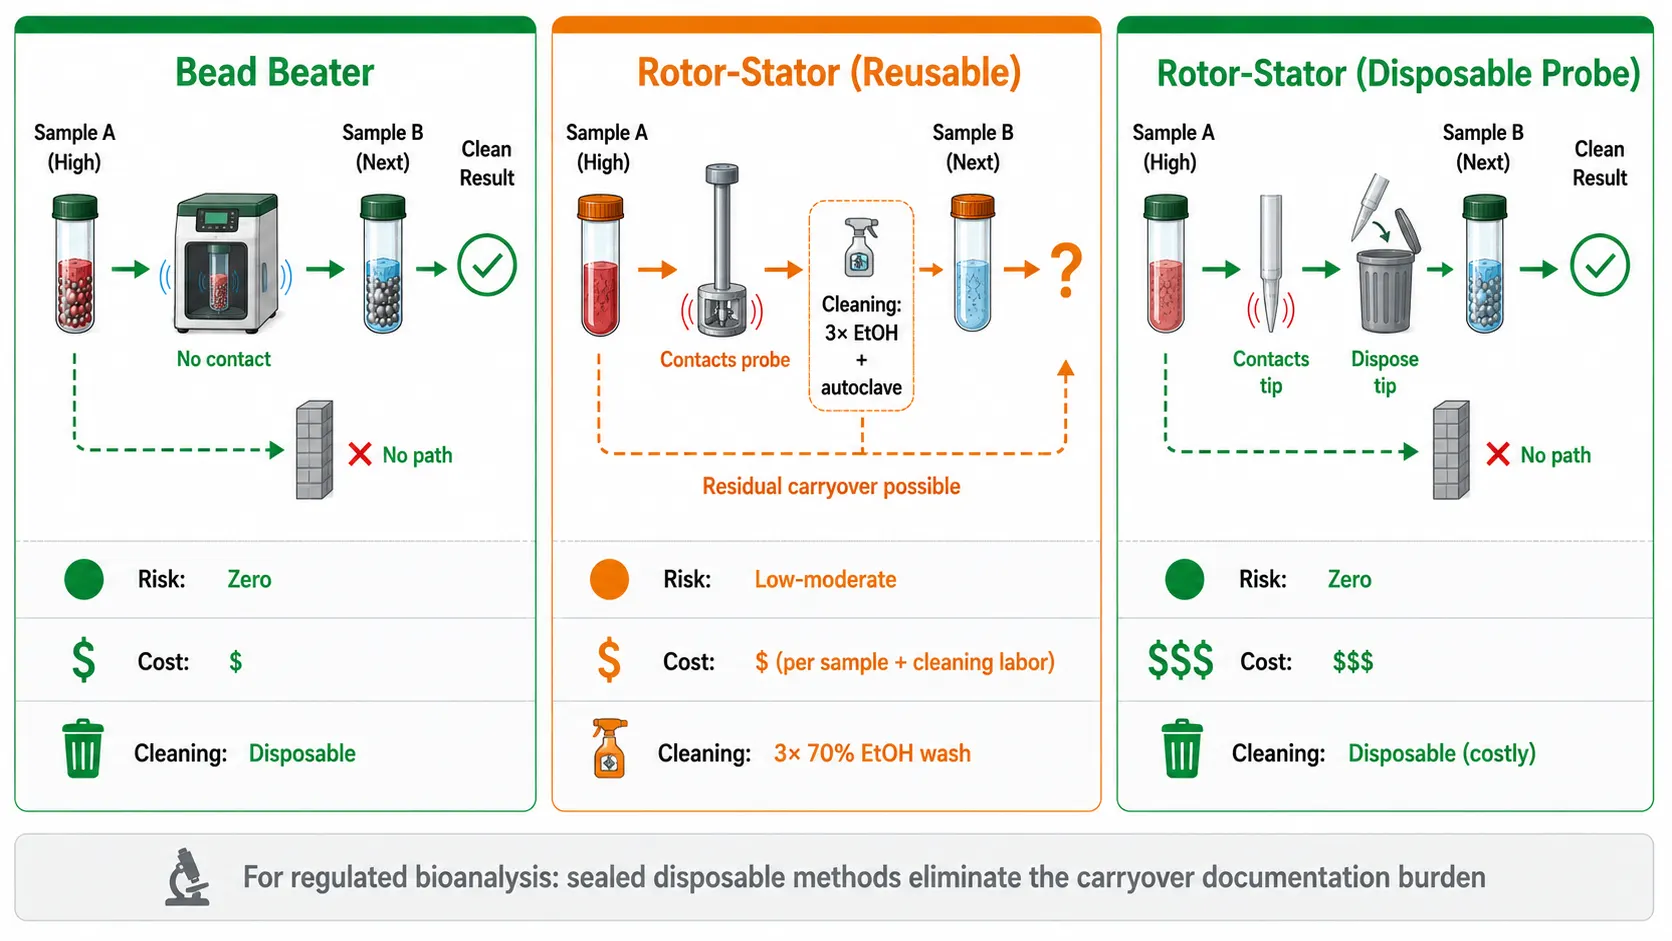 Figure 5: Carryover control comparison. Three columns: Bead Beater (green), Rotor-Stator Reusable (amber), Rotor-Stator Disposable (green but expensive). Each column shows: sample-to-sample contact path (or lack thereof), cleaning requirement, carryover risk level (● green / ● amber / ● red), per-sample consumable cost ($/$$/$$$), and regulatory defensibility rating. Bottom: summary recommendation — "For regulated bioanalysis, sealed disposable tube methods eliminate the carryover documentation burden." Clean white background, sans-serif.
Frequently Asked Questions
Which homogenization method gives the highest drug recovery from lung tissue?
Collagenase pre-digestion for 1 hour at 37°C followed by bead beating for 2 minutes. Liang et al. (2011) demonstrated that bead beating alone cannot fully homogenize lung tissue — visible tissue fragments remain even after 10 minutes of mechanical processing. Qin et al. (2015) confirmed that collagenase treatment achieves complete drug release from fibrous tissues with minimal matrix effects (IS-normalized MF 0.90-1.10). Any method claiming to fully homogenize lung by mechanical means alone should be verified by microscopy and cross-validated against the enzymatic method before use in a regulated study.
Can I use the same homogenization protocol for all tissue types in my study?
No. Tissue types differ fundamentally in their mechanical properties. A protocol optimized for liver (bead beating, 8 minutes, ceramic beads) will under-recover drug from lung, heart, or skin. A protocol optimized for lung (collagenase + bead beating) is unnecessarily complex and time-consuming for liver or kidney. The tissue-type recommendation matrix in this article provides starting parameters for each organ class. During method development, verify homogenization completeness by microscopy for each tissue type individually — do not assume that a method validated for liver transfers to lung.
Why does my rotor-stator probe leave visible chunks in liver — and does it matter?
The Liang et al. (2011) comparison showed that rotor-stator homogenization of mouse liver leaves 20-30 μm residual particles even after 8 minutes of processing, while bead beating achieves less than 10 μm particles. These 20-30 μm particles are hepatocyte clusters that survived the shear forces of the rotor-stator. Yes, it matters — each visible particle represents cells whose drug content has not been released into the homogenate. If those hepatocytes contain drug (which they do, in a tissue distribution study), the measured homogenate concentration underestimates the true tissue concentration. Switch to bead beating or verify by microscopy that your specific rotor-stator protocol achieves complete disruption.
How do I measure recovery when I do not have blank tissue?
The most practical approach for routine method development is the orthogonal method comparison — homogenize one portion of the tissue by bead beating and another portion by collagenase digestion, then compare the measured concentrations. If both methods give the same result across multiple tissue samples, recovery is adequate. If enzymatic digestion gives a higher concentration, bead beating is under-recovering drug. For regulated studies, prepare surrogate tissue QCs by spiking drug into blank tissue from naive animals of the same strain — this provides the closest approximation to true incurred tissue recovery without radiolabeled material (Ho and Gao, 2015). The radiolabeled incurred tissue method remains the definitive approach for method validation supporting regulatory submission.
What is the correct tissue-to-buffer ratio for homogenization?
1:3 to 1:5 (tissue:buffer, w/v). For a 1-gram tissue sample, use 3-5 mL of homogenization buffer. Ratios below 1:2 produce thick slurries that do not homogenize uniformly. Ratios above 1:10 over-dilute the homogenate and may reduce the LC-MS/MS signal below the LLOQ for low-concentration samples. The optimal ratio within the 1:3 to 1:5 range should be determined during method development by testing homogenization completeness (microscopic examination) and extraction recovery at multiple ratios. For tissue method development covering the full workflow from homogenization to validated data, our sample preparation services include tissue-to-buffer ratio optimization for each organ type.
How do I calculate ng/g tissue from my LC-MS/MS result in ng/mL?
Tissue concentration (ng/g) = homogenate concentration (ng/mL) × total homogenate volume (mL) / tissue weight (g). The most common error is using the buffer volume added instead of the total homogenate volume — tissue itself contributes approximately 0.95 mL of volume per gram. For a 1g liver sample homogenized in 3 mL buffer, the total volume is approximately 3.95 mL, not 3 mL. Using 3 mL in the calculation produces a 24% underestimate. Measure the total homogenate volume after homogenization using a graduated tube, or use the density-corrected volume: total volume = buffer volume + (tissue weight × 0.95 mL/g).
Does collagenase digestion affect my drug's stability or LC-MS/MS response?
For small-molecule drugs, generally no. Qin et al. (2015) reported "little to no effects on the quality and reliability" of collagenase-treated samples and measured IS-normalized matrix factors of 0.90-1.10 — well within the ±15% acceptance range. Collagenase selectively hydrolyzes collagen peptide bonds; its active site does not recognize small-molecule drug structures. However, for biotherapeutics, peptide drugs, and protein analytes, collagenase and proteinase K can cleave the analyte — enzymatic digestion is contraindicated for these analyte classes. Always verify analyte stability in the presence of the enzyme during method development by incubating a reference standard with the enzyme under the planned digestion conditions and comparing the LC-MS/MS response to a non-incubated control.
Is bead beating enough for skin tissue, or do I need enzymes?
You need enzymes. Skin dermis is approximately 70% collagen by dry weight, and the collagen triple-helix forms a mechanically impenetrable barrier to bead impact. Bead beating alone of skin produces a slurry with macroscopic tissue fragments, and drug recovery is typically below 50% of the true concentration. Collagenase digestion (Type I or Type II collagenase, 1-2 mg/mL, 1-2 hours at 37°C) or proteinase K digestion is mandatory for quantitative drug release from skin. For topical drug development programs, under-recovery of drug from skin due to incomplete homogenization is a well-documented source of erroneous data that can lead to incorrect conclusions about dermal bioavailability.
References
- Liang X, Ubhagakar S, Liederer BM, et al. Evaluation of homogenization techniques for the preparation of mouse tissue samples to support drug discovery. Bioanalysis. 2011;3(17):1923-1933. doi:10.4155/bio.11.181
- Qin AR, Liang X, Deng Y, Dean B, Shahidi-Latham SK. Collagenase as an effective tool for drug quantitation in tissues. Bioanalysis. 2015;7(9):1069-1079. doi:10.4155/bio.15.39
- Ho S, Gao H. Surrogate matrix: opportunities and challenges for tissue sample analysis. Bioanalysis. 2015;7(18):2419-2433. doi:10.4155/bio.15.161
- Smith KM, Xu Y. Tissue sample preparation in bioanalytical assays. Bioanalysis. 2012;4(6):741-749. doi:10.4155/bio.12.19
- Li W, Cohen LH. Quantitation of endogenous analytes in biofluid without a true blank matrix. Anal Chem. 2003;75(21):5854-5859. doi:10.1021/ac034505u
- Mouton JW, Theuretzbacher U, Craig WA, Tulkens PM, Derendorf H, Cars O. Tissue concentrations: do we ever learn? J Antimicrob Chemother. 2008;61(2):235-237. doi:10.1093/jac/dkm476
- Xue YJ, Gao H, Ji QC, et al. Bioanalysis of drug in tissue: current status and challenges. Bioanalysis. 2012;4(21):2637-2653. doi:10.4155/bio.12.252
- Gao H, Ho S, Williams J. LC-MS bioanalysis of drugs in tissue samples. In: Li W, Zhang J, Tse FLS, eds. Handbook of LC-MS Bioanalysis: Best Practices, Experimental Protocols, and Regulations. Hoboken, NJ: John Wiley & Sons; 2013:363-372. doi:10.1002/9781118671276.ch23
Disclaimer: All services and resources mentioned on this site are for research use only (RUO) and are not intended for diagnostic, therapeutic, or clinical applications.
Related Services


