Most drug development programs measure drug concentrations in plasma. Tissue distribution studies measure drug in organ homogenates. But for a rapidly expanding class of drug targets — kinase inhibitors, PROTACs, nucleic acid therapeutics, and intracellular antibiotics — the concentration that determines efficacy is neither in plasma nor in tissue. It is inside the cell, in the cytoplasm and nucleus where the target resides. Cell lysate drug quantification by LC-MS/MS answers the question that plasma and tissue methods cannot: Does the drug get into the cell, and at what concentration relative to the target IC50? This article provides the first integrated CRO resource covering cell lysis methods and their LC-MS/MS compatibility, the pre-analytical variables that can bias intracellular concentration by several-fold, the four-level normalization hierarchy from ng/mL lysate to intracellular µM, and the adsorption and washing artifacts that make intracellular quantification uniquely error-prone. For the tissue quantification workflow that parallels the intracellular methods described here, see our article on tissue drug quantification by LC-MS/MS. Our tissue and cell lysate drug quantification services provide validated lysis, extraction, and LC-MS/MS methods for intracellular drug measurement across common cell lines and primary cell types.
Why Intracellular Drug Concentration Matters
The intracellular space is the site of action for most small-molecule oncology drugs, antivirals, antibiotics, and all nucleic acid therapeutics. A kinase inhibitor circulating at 500 nM in plasma achieves target engagement only if its free intracellular concentration at the ATP-binding pocket of the kinase exceeds the biochemical IC50. Plasma concentration tells you what is in blood. Intracellular concentration tells you what is at the target. The gap between these two numbers — determined by passive permeability, active uptake, and active efflux — is the accumulation ratio, and it can range from 0.1 (net efflux) to >100 (net uptake, lysosomal trapping). Measuring it requires cell lysate analysis.
Cell lysate quantification differs from tissue quantification in four ways, three of which are advantageous. First, you can have blank cells — untreated cells from the same culture provide authentic blank matrix for calibration, a luxury tissue bioanalysts do not have. Second, the sample is tiny — 10⁶ adherent cells contain approximately 1-4 µL of actual cell volume in 100 µL of lysate — demanding high analytical sensitivity. Third, the washing step before lysis is the most critical pre-analytical variable, determining whether you measure intracellular drug or extracellular carryover. Fourth, normalization choices — protein, cell number, or intracellular volume — change the numerical answer by orders of magnitude and must be made deliberately.
Typical applications span the drug discovery and development pipeline: transporter substrate assessment in overexpressing cell lines (Caco-2, MDCK-MDR1, HEK293-OATP), cellular uptake kinetics for candidate selection, target engagement confirmation linking cellular PK to cellular PD, and subcellular fractionation studies quantifying drug in mitochondria, lysosomes, and nuclei. For method development supporting these intracellular applications, our custom LC-MS/MS method development services design cell-lysis protocols optimized for analyte stability, lysis efficiency, and LC-MS/MS compatibility.
Cell Lysis Methods: The LC-MS/MS Compatibility Problem
The fundamental tension in cell lysis for LC-MS/MS is that effective lysis requires detergents or chaotropes — but electrospray ionization (ESI) is exquisitely sensitive to these compounds at the ion source. The most commonly used lysis buffers in cell biology are also the worst LC-MS/MS interferents, and most academic protocols are written for Western blotting, where SDS is the standard, without regard for downstream mass spectrometry compatibility. Understanding which lysis methods work — and which do not — is the single most important method development decision for intracellular drug quantification.
SDS (sodium dodecyl sulfate) is the primary detergent in RIPA buffer, the most widely used lysis buffer in cell biology. SDS forms micelles that compete effectively for surface charge at the ESI droplet interface, producing 50-90% ion suppression across the entire mass range. SDS also forms strong adducts with basic drugs via electrostatic interaction between the sulfate head group and protonated amines, producing +288 Da satellite peaks that reduce the analyte signal and complicate quantitation. SDS is not compatible with direct LC-MS/MS injection and requires removal by detergent removal spin columns, SPE, or precipitation — adding steps, variability, and potential analyte loss.
NP-40 and Triton X-100 are non-ionic polyethoxylate detergents. Their polyethylene glycol (PEG) chains produce a characteristic mass spectrum of peaks spaced at m/z 44 (the -CH₂CH₂O- repeat unit) across the m/z 200-600 range, directly overlapping with most small-molecule drug mass ranges. This broad, structured suppression envelope is difficult to correct with a stable isotope internal standard because the suppression varies across the PEG envelope and is concentration-dependent. Like SDS, NP-40 and Triton X-100 require removal before LC-MS/MS injection.
Sodium deoxycholate is an ionic detergent with intermediate LC-MS/MS compatibility. It produces less direct ion suppression than SDS, but it precipitates at pH below 6.5 as deoxycholic acid, forming a gel that can clog LC columns and autosampler injection ports. Acidification followed by centrifugation removes deoxycholate, but the precipitation step can co-precipitate hydrophobic drugs.
Urea (8 M) is a chaotrope rather than a detergent, denaturing proteins by disrupting hydrogen bonds. Its LC-MS/MS problem is chemical rather than physical: urea in solution slowly decomposes to ammonium cyanate, which reacts with lysine and arginine side chains via carbamylation, adding +43 Da to each modified residue. For peptide and protein analytes, this produces complex mixtures of modified species. For small-molecule drugs, carbamylation is generally not a direct problem, but the high urea concentration suppresses ionization and the non-volatile urea must be removed before injection — typically by SPE, adding workflow complexity.
Three LC-MS/MS-compatible lysis methods avoid these problems entirely:
Method A — Organic solvent sonication (recommended). Add 70% acetonitrile in water (v/v) to the cell pellet or washed monolayer, probe-sonicate for 30 seconds on ice, and centrifuge at 14,000 × g for 10 minutes at 4°C. The acetonitrile simultaneously lyses cells by dissolving the lipid bilayer, precipitates proteins, and extracts the drug into a directly injectable supernatant. No detergent removal step is needed. The supernatant can be injected directly or after 1:1 dilution with water to improve peak shape for early-eluting analytes. This method achieves complete lysis including membrane-bound and organelle-sequestered drug, and is compatible with all common LC-MS/MS systems without additional cleanup. It is the method of choice for total intracellular drug quantification.
Method B — Freeze-thaw in PBS. Resuspend cells in phosphate-buffered saline and subject to three to five freeze-thaw cycles (-80°C / 37°C), vortexing between cycles. This method uses no chemicals, produces a clean matrix, and is adequate for freely soluble cytoplasmic drug. However, freeze-thaw does not disrupt organelle membranes efficiently — drug sequestered in lysosomes, mitochondria, or endoplasmic reticulum is incompletely released. For membrane-bound or highly lipophilic drugs, freeze-thaw may recover only 50-80% of the total drug compared to organic solvent sonication. Use freeze-thaw only when it has been validated against a complete lysis method for the specific analyte and cell type.
Method C — 0.1% formic acid in 70:30 acetonitrile:water. This combines lysis, protein precipitation, and acidification in a single step. The formic acid aids cell lysis by protonating membrane lipids, improves the recovery of basic drugs, and is directly compatible with the acidic mobile phases used in reversed-phase LC-MS/MS. This is an excellent high-throughput option for 96-well plate formats.
The decision matrix: for total intracellular drug (cytoplasmic + membrane-bound + organelle-sequestered), use Method A (organic solvent sonication). For cytoplasmic soluble drug only, freeze-thaw is adequate but must be validated. For high-throughput screening, use Method C in 96-well format. For proteomics-plus-drug analysis on the same sample, urea lysis followed by SPE cleanup is necessary but slow. RIPA and other detergent-based lysis buffers are incompatible with direct LC-MS/MS injection and should be avoided unless a validated detergent removal step is included. For cell lysis method development covering the full range of analyte and cell types, our sample preparation and processing services include lysis buffer compatibility testing and LC-MS/MS optimization for each cell type and analyte class.
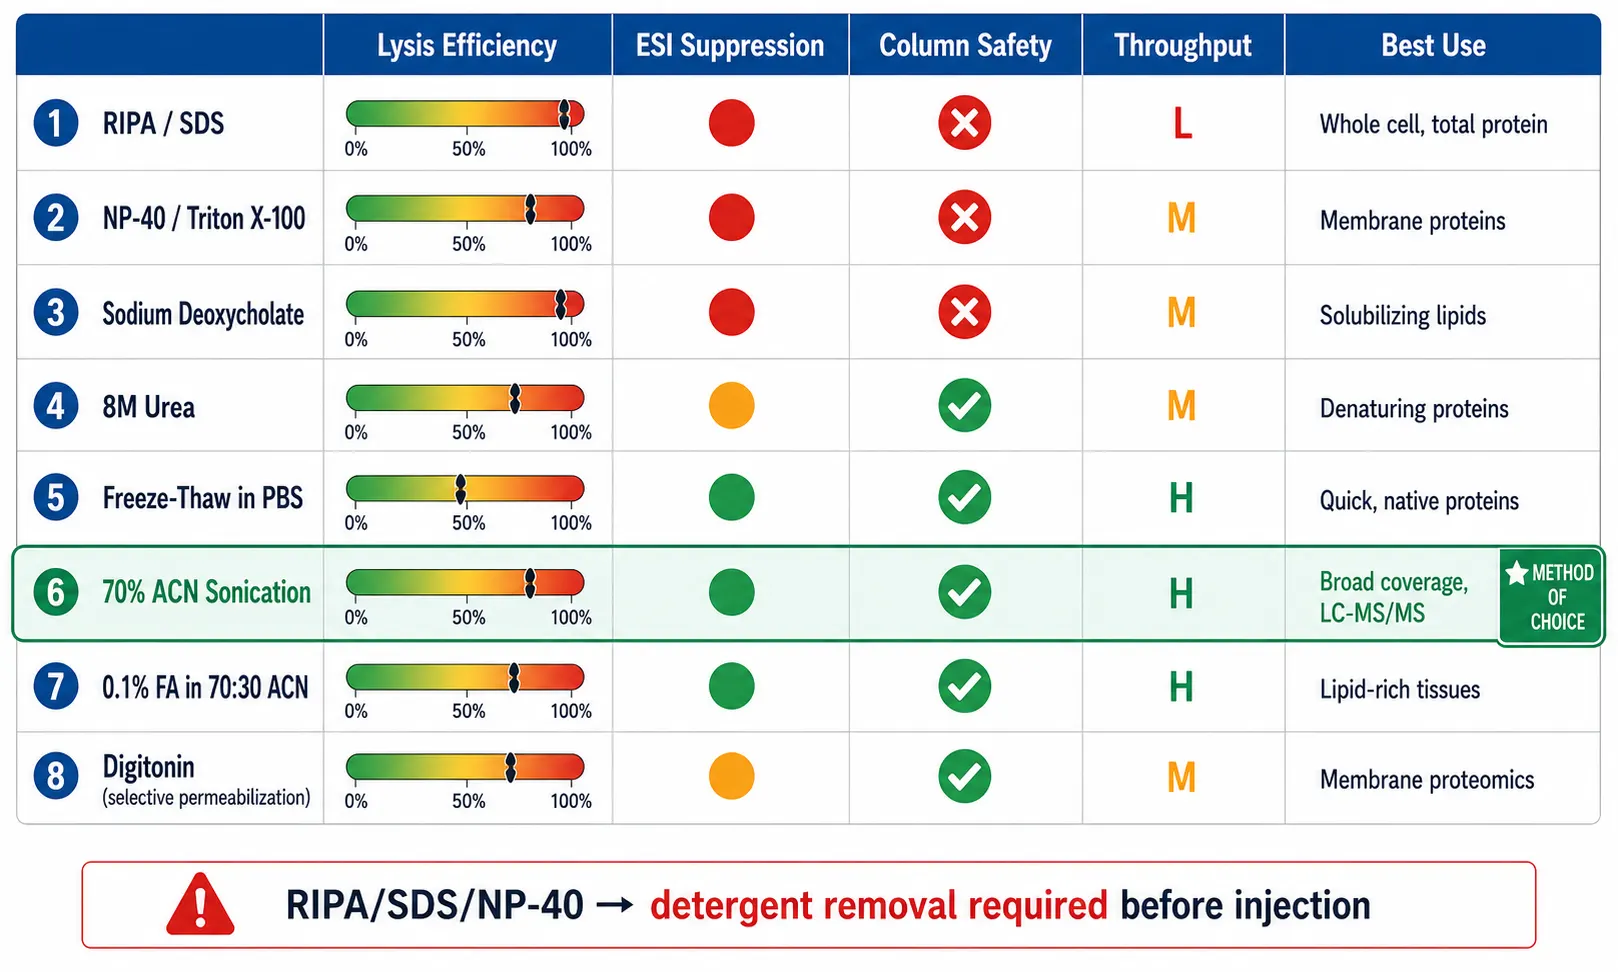 Figure 1: Lysis method × LC-MS/MS compatibility matrix. An 8-row grid: RIPA/SDS, NP-40/Triton X-100, sodium deoxycholate, 8M urea, freeze-thaw PBS, 70% ACN sonication, 0.1% FA in 70:30 ACN, and digitonin (selective permeabilization). Columns: lysis efficiency (0-100% gauge), ESI suppression (green/yellow/red), column safety (green/red), throughput (high/med/low), and recommended use case. 70% ACN sonication row highlighted in green as method of choice. Clean white background.
The Washing Step: The Most Critical Pre-Analytical Variable
After incubating cells with drug, the medium is aspirated and the cell monolayer is washed with buffer to remove extracellular drug before lysis. The washing step appears trivial — aspirate, add PBS, aspirate, repeat — but is the single largest source of systematic error in cell lysate drug quantification. A residual 1 µL of drug-containing medium in a 100 µL lysate represents a 1% contamination, but if the medium drug concentration is 100 µM and the intracellular concentration is 1 µM, that 1% contamination contributes as much drug mass as the cells themselves. Three washes, each reducing residual volume by approximately 100-fold, bring the contamination to approximately 0.0001% of the original medium — negligible for most conditions.
The standard protocol: aspirate the medium completely, add 1 mL of ice-cold PBS (4°C) per well of a 6-well plate, gently swirl, aspirate completely, and repeat twice more (three washes total). Cold PBS slows cellular metabolism and reduces transporter-mediated drug flux during the washing procedure. For suspension cells, pellet by centrifugation (300 × g, 5 minutes, 4°C), remove supernatant, resuspend in cold PBS, and repeat twice more. Add 0.1% BSA to the wash buffer for suspension cells to reduce nonspecific binding of lipophilic drugs to the tube walls.
The temperature trap is a specific and underrecognized source of bias. The standard ice-cold PBS wash protocol is designed to arrest metabolism and transporter activity, but for drugs that are substrates of efflux transporters (P-gp, BCRP), the 4°C wash suppresses active efflux. Drug that would be actively pumped out of the cell at 37°C remains trapped inside at 4°C, and the measured intracellular concentration is artificially elevated — by 2- to 5-fold in documented cases. This artifact is not hypothetical; it has been demonstrated for digoxin (P-gp substrate) in Caco-2 monolayers and for methotrexate (BCRP substrate) in MDCK-BCRP cells.
Validation: compare intracellular drug concentrations after a 4°C PBS wash versus a 37°C rapid wash (aspirate, add warm PBS, aspirate — completed in less than 15 seconds to minimize transporter-mediated efflux during the wash itself). If the concentrations differ by more than 20%, temperature-dependent transporter activity is affecting the measurement. For defined transporter studies where the efflux ratio is the endpoint, use the 37°C rapid wash to preserve physiological transporter activity. For routine quantification of intracellular drug in non-transporter-focused studies, the 4°C wash is the pragmatic standard — but the limitation should be acknowledged. For transporter substrate assessment in overexpressing cell lines, our complex biological matrices analysis services include temperature-controlled washing protocols validated for transporter-interacting drugs.
Wash buffer choice matters. PBS is the standard. Avoid any surfactant in the wash buffer — even 0.01% Tween-20 can permeabilize the plasma membrane and allow intracellular drug to leak out during washing. For lipophilic drugs with high nonspecific binding to plasticware, pre-coating tubes and plates with 0.1% BSA or using low-binding polypropylene consumables reduces surface adsorption losses during the wash steps. For cell-based transporter studies requiring validated washing and lysis protocols, our bioanalytical method development and validation services include temperature-controlled washing protocol development for transporter-interacting drugs.
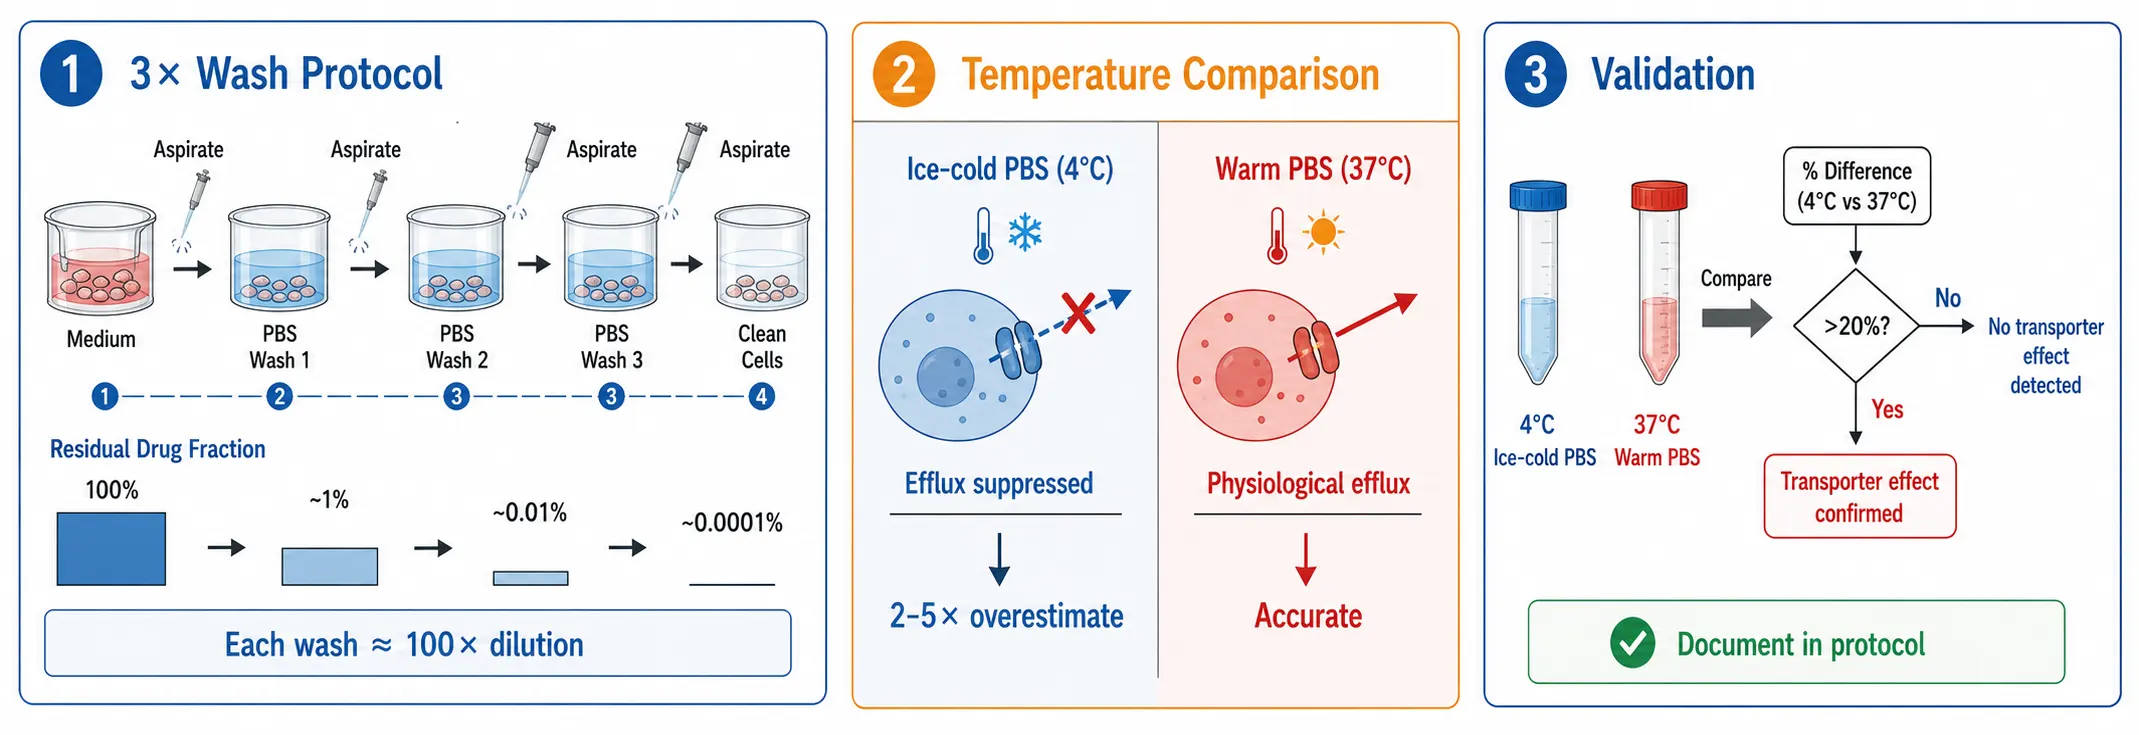 Figure 2: Cell washing protocol infographic. Three-panel sequence: (1) "3× Wash" — aspirate medium → add ice-cold PBS → aspirate → repeat ×2, with residual drug dilution visualized as shrinking bars (100% → 1% → 0.01% → 0.0001%); (2) "Temperature Trap" — side-by-side: 4°C wash (efflux suppressed, drug trapped, "2-5× overestimate") vs 37°C rapid wash (<15 sec, "physiological"); (3) Validation: compare 4°C vs 37°C, label "If >20% difference, transporter effect confirmed." Clean white background.
The Adsorption Artifact: When "Intracellular" Is on the Plastic
Lipophilic drugs — those with logP above 3, and particularly cationic amphiphiles — adsorb to polystyrene culture plates during the incubation period. When the medium is aspirated and the cells are lysed with acetonitrile, the organic solvent dissolves adsorbed drug from the plate surface. The measured "intracellular" drug concentration then includes both the true intracellular drug and the plate-adsorbed drug. For highly lipophilic compounds, plate-bound drug can exceed true intracellular drug by 2- to 10-fold. This is not a minor correction; it can completely invalidate the intracellular concentration measurement.
The no-cell control is the essential validation experiment that detects this artifact. Incubate drug at the same concentration, volume, and duration in cell-free wells — wells that have been treated identically (same coating, same medium, same incubation) but contain no cells. After incubation, wash the empty wells with the identical washing protocol, add lysis buffer, and process exactly as for cell-containing wells. The drug measured in the no-cell control wells represents plate-adsorbed drug. It must constitute less than 10% of the signal from cell-containing wells. If it exceeds 10%, the method is measuring predominantly plate binding, not intracellular drug.
Mitigation strategies: pre-coat plates with 0.1% BSA in PBS for 30 minutes before cell seeding — BSA occupies nonspecific binding sites on the polystyrene surface. Use low-binding or non-binding surface plates (e.g., Corning Ultra-Low Attachment or similar). For highly adsorptive drugs, siliconized glass vials or polypropylene tubes may be necessary. The no-cell control should be included in every experiment, not just during method development — plate binding varies with drug concentration, incubation time, and medium composition, and a single validation experiment does not guarantee the absence of the artifact in subsequent runs. For method development that includes no-cell control validation and plate adsorption assessment for lipophilic drug candidates, our custom LC-MS/MS method development services design cell-based uptake assays with built-in adsorption controls.
A related but distinct problem is surface-bound drug on the extracellular face of the plasma membrane. Drugs with high membrane affinity partition into the outer leaflet of the plasma membrane bilayer within seconds of contact. This drug is not intracellular — it has not crossed the membrane — but it is recovered in the lysate and reported as intracellular. Distinguishing surface-bound from truly intracellular drug requires an acid wash step: after the PBS wash, treat cells with glycine buffer (pH 3.0, 0.1 M) for 2 minutes at 4°C. The low pH protonates basic drug molecules, releasing them from membrane phospholipids without lysing the cells. Compare drug recovered in the acid wash (surface-bound) to drug in the subsequent lysis (intracellular). For most small-molecule drugs, surface binding is a small fraction of total cell-associated drug, but for highly lipophilic or highly charged compounds it can be the dominant fraction.
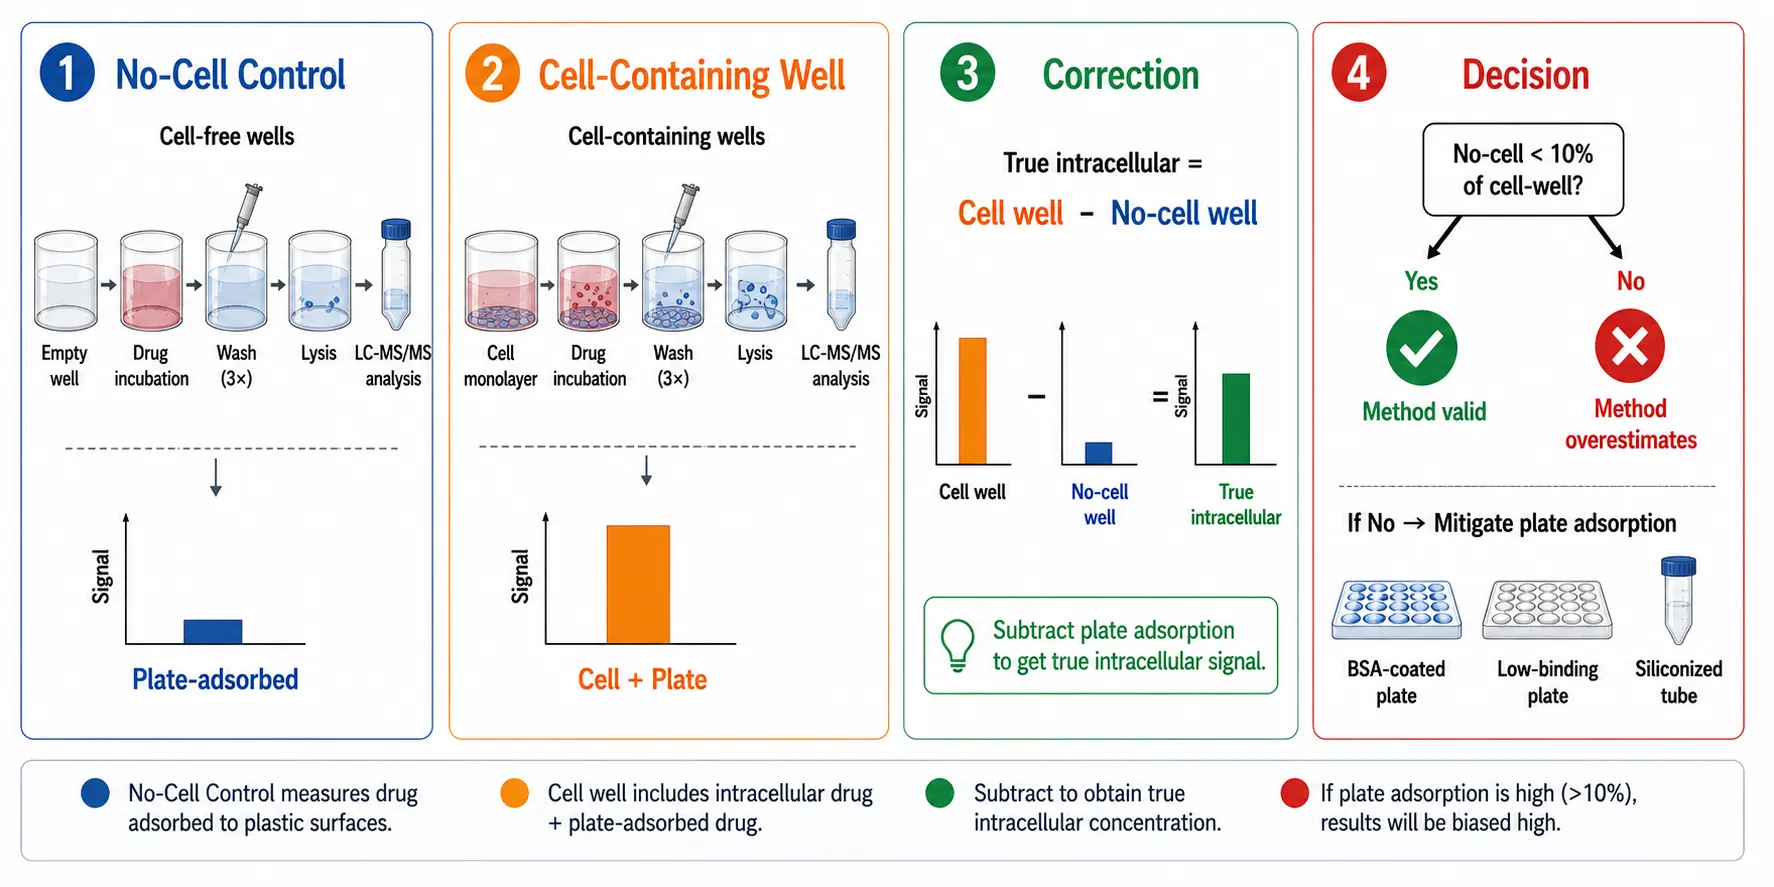 Figure 3: Adsorption artifact control diagram. Four horizontal panels: (1) Drug incubating in cell-free well → wash → lyse → "plate-adsorbed signal"; (2) Same in cell-containing well → wash → lyse → "cell + plate signal"; (3) Equation: True intracellular = cell-well signal - no-cell signal; (4) Decision: "No-cell < 10% of cell-well → method valid; >10% → method overestimates." Mitigation icons: BSA coating, low-binding plate, siliconized tubes. Clean white background.
Quantification and Normalization: From ng/mL Lysate to Meaningful Units
The LC-MS/MS system reports a concentration in ng/mL — the drug concentration in the lysate extract. Converting this to meaningful pharmacological units requires a sequence of normalization steps, and skipping any step or choosing the wrong normalization basis can produce answers that are numerically correct but pharmacologically misleading.
The first step — ng/mL lysate to ng drug per sample — is straightforward: multiply the lysate concentration by the lysate volume. If the LC-MS/MS reports 25 ng/mL and the lysis volume was 200 µL, the total drug mass is 5 ng.
The second step requires a choice: normalize to protein (ng/mg protein) or to cell number (ng/million cells). Protein normalization is the standard in the published literature and is technically simplest: a 10-20 µL aliquot of lysate is assayed by BCA or Bradford, and the drug mass is divided by the total protein mass. Its limitation is that drug treatment can change cellular protein content. mTOR inhibitors suppress translation, reducing total protein per cell; if protein per cell drops by 30% but drug per cell stays constant, the ng/mg protein value rises by 43% — an artifact of the normalization, not a real change in drug exposure. Cell-number normalization avoids this problem: count cells in a parallel well (or use DNA content measured by PicoGreen fluorescence as a cell-number proxy) and report ng drug per million cells. The best practice is to measure both and report both values. If the protein-to-cell-number ratio is consistent across treatment groups, protein normalization is reliable. If it changes, cell-number normalization is the more accurate basis.
The third step — converting ng drug to intracellular concentration in µM — is the step most researchers skip, and the one that makes intracellular data pharmacologically interpretable. The intracellular concentration (C_intra, in µM) is calculated as:
C_intra (µM) = [drug mass (ng) / (cell count × cell volume (µL))] / molecular weight (g/mol)
Cell volumes vary by cell type: primary human hepatocytes approximately 3.5 pL, HEK293 approximately 1.2 pL, HeLa approximately 2.5 pL, Caco-2 approximately 1.7 pL, MDCK approximately 1.5 pL, and CHO approximately 1.1 pL. These are measured values from the literature, not constants — they vary with culture conditions, passage number, and confluence. The most accurate approach is to measure cell volume for each experiment using a Coulter counter or by measuring the diameter of trypsinized cells under microscopy and calculating volume as (4/3)πr³ (for spherical cells in suspension after trypsinization).
Worked example: 10⁶ HEK293 cells are treated with a kinase inhibitor (MW = 488 g/mol) at 1 µM for 2 hours. After washing and lysis in 200 µL of 70% ACN, the LC-MS/MS reports 32 ng/mL in the lysate. Drug mass = 32 ng/mL × 0.200 mL = 6.4 ng. Cell count = 10⁶ cells. Cell volume = 1.2 pL per cell → total cell volume = 1.2 × 10⁶ pL = 1.2 µL = 0.0012 mL. Intracellular concentration = (6.4 ng / 488 g/mol) / 0.0012 mL = 0.0131 nmol / 0.0012 mL = 10.9 nmol/mL = 10.9 µM. Accumulation ratio (Kp,cell) = 10.9 µM / 1.0 µM = 10.9. The drug accumulates 11-fold inside cells relative to the medium concentration. If the biochemical IC50 is 5 nM, the intracellular free drug concentration — even at 1% free fraction — exceeds the IC50, consistent with target engagement. This calculation transforms a raw ng/mL number into a pharmacologically meaningful answer.
The four reporting levels, used in combination, provide a complete picture: (a) ng/mg protein — always report, literature convention; (b) ng/million cells — always report, orthogonal to protein, catches protein-content artifacts; (c) intracellular µM — report when comparing to target IC50 or plasma free drug concentration; (d) Kp,cell = C_intra / C_medium — report for transporter studies and cellular PK modeling. For the tissue-level parallel to the cell-to-medium accumulation ratio — the tissue-to-plasma partition coefficient Kp used in physiologically based pharmacokinetic (PBPK) modeling — see our article on tissue-to-plasma ratio determination and PBPK integration. For intracellular quantification studies requiring all four reporting levels, our single drug quantification services provide cell lysate analysis with protein, cell-number, and volume-based normalization for each sample.
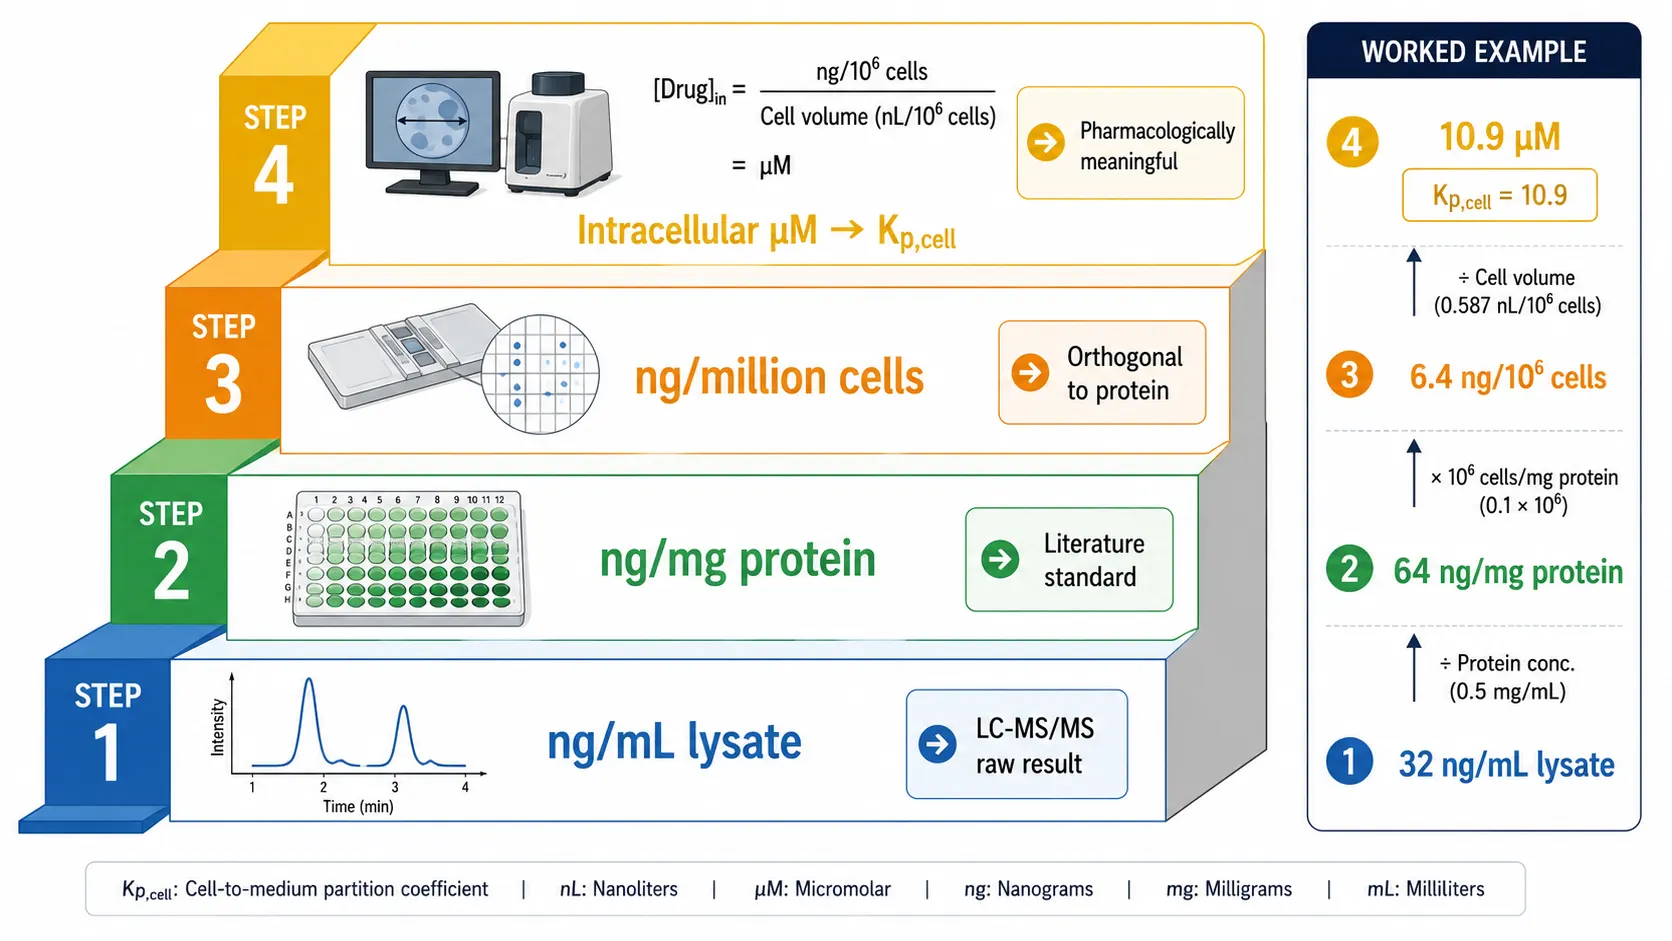 Figure 4: Four-level quantification hierarchy. Ascending steps visualized as a staircase: Step 1 — LC-MS/MS → ng/mL lysate (bottom step, blue); Step 2 — protein assay → ng/mg protein (green); Step 3 — cell count → ng/million cells (amber); Step 4 — cell volume × drug mass → intracellular µM (top step, gold). Worked example numbers on right side: 32 ng/mL → 64 ng/mg → 6.4 ng/10⁶ cells → 10.9 µM → Kp,cell 10.9. Clean white background.
Method Validation for Cell Lysate Assays
Cell lysate method validation benefits from a significant advantage over tissue: authentic blank matrix is available from untreated cells of the same passage and culture conditions. The calibration curve and QCs can be prepared in blank cell lysate, achieving a true matrix match. This simplifies validation and reduces the uncertainty that complicates tissue method validation.
Core validation parameters follow the ICH M10 framework adapted for the cell lysate matrix. Accuracy and precision are assessed at four QC levels (LLOQ, low, mid, high) in blank cell lysate across at least three independent runs. Acceptance criteria are ±15% (±20% at LLOQ). Selectivity requires demonstrating that blank lysate from at least six independent cell passages produces no interference exceeding 20% of the LLOQ response. Protein expression in cultured cells drifts with passage number — a cell line at passage 5 is not analytically identical to the same line at passage 25 — and the six lots should span the passage range expected in the study.
Lysis-specific additions: (a) Cell-number linearity — spike a fixed amount of drug into lysate prepared from 0.1, 0.5, 1, 2, and 5 × 10⁶ cells. The back-calculated concentration should be independent of cell number (±15%). Deviation at high cell numbers indicates matrix suppression from excess cellular content. (b) Lysis efficiency validation — compare the planned lysis method against organic solvent sonication (the reference method for complete lysis). If the planned method recovers less than 80% of the reference method result across three independent determinations, lysis is incomplete. (c) No-cell control carryover — drug measured in the no-cell control wells must be below 20% of the LLOQ. If it exceeds this threshold, plate adsorption or incomplete washing is introducing unacceptable bias. (d) Matrix effect — assess using post-extraction spike comparison in blank lysate from at least six passages. IS-normalized MF should be 0.85-1.15 with CV ≤15% across passages.
QC preparation is unusually straightforward for cell lysate assays: spike drug into blank cell lysate from untreated cells at the same cell density as study samples. This is a perfect matrix match — the same cell type, same passage, same lysis buffer, same protein concentration — a rare luxury in bioanalysis. For quantitative analysis, our internal standard selection and optimization services provide stable isotope-labeled internal standards that correct for residual matrix effects even in matched-matrix cell lysate methods. For cell lysate method validation covering all ICH M10 parameters with cell-specific additions, our method validation services include full validation of intracellular drug quantification methods from cell culture through LC-MS/MS analysis.
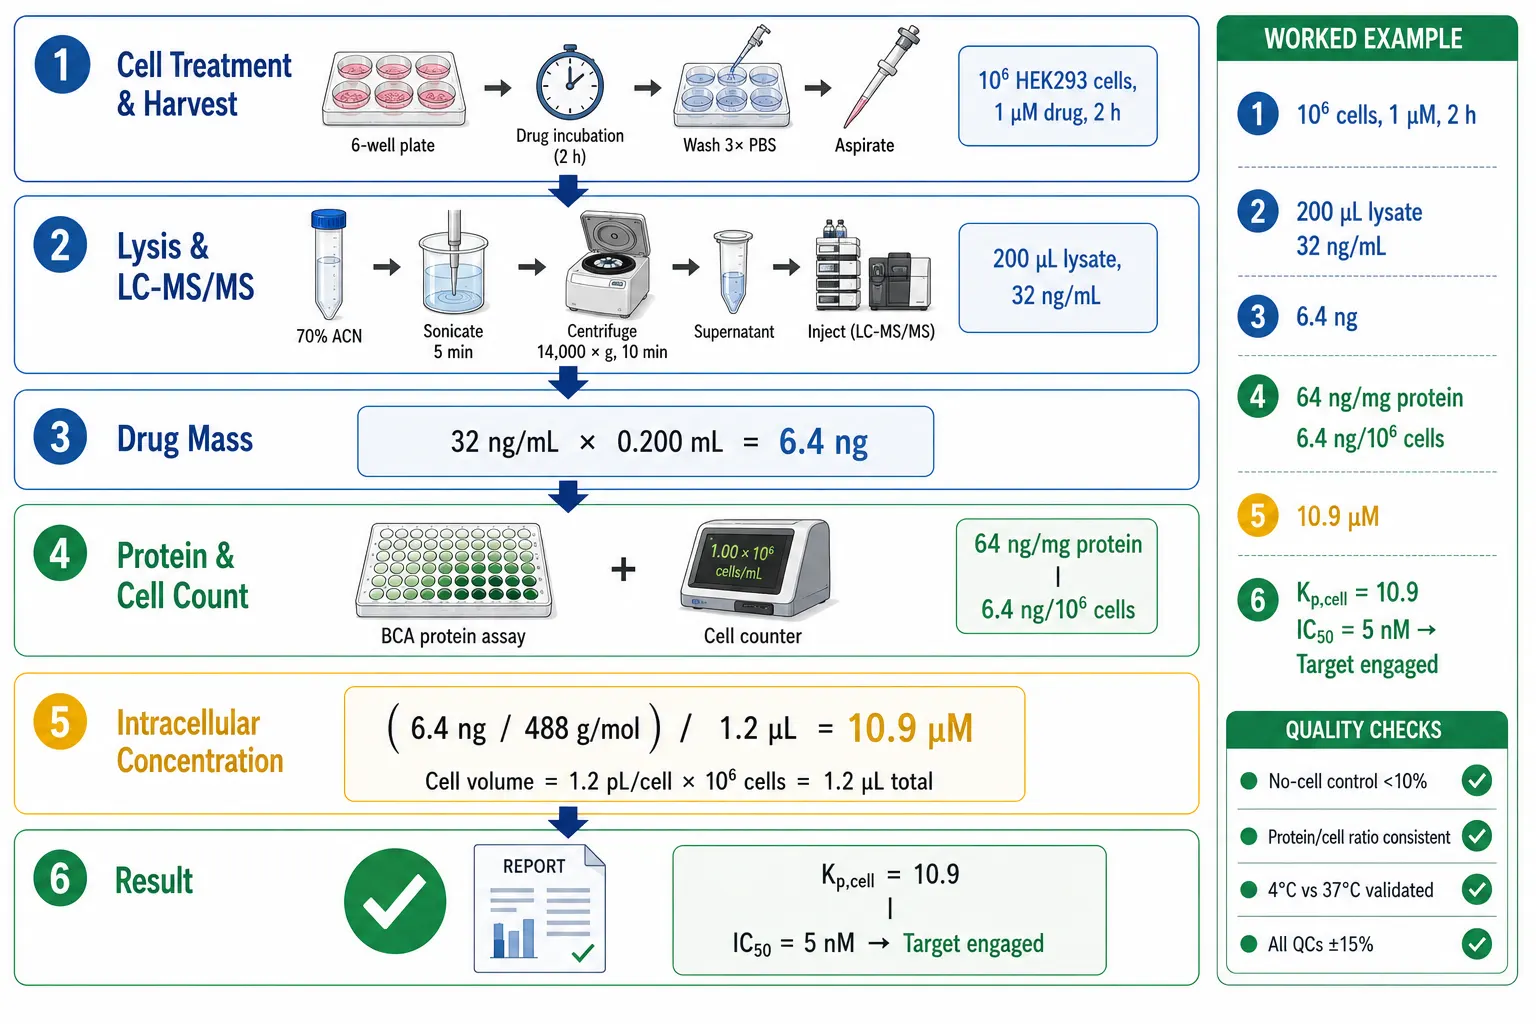 Figure 5: Intracellular concentration calculation workflow. Top-to-bottom pipeline: (1) Cell treatment → washing → lysis → LC-MS/MS → ng/mL lysate; (2) Protein assay → ng/mg protein + cell count → ng/million cells; (3) Cell volume measurement (Coulter/microscopy) → total cell volume (µL); (4) Final calculation: drug mass / total cell volume = intracellular µM → Kp,cell = C_intra / C_medium. Right sidebar: worked example with real numbers (6.4 ng → 10.9 µM → 10.9× accumulation). Clean white background, green accent (#27AE60).
Frequently Asked Questions
Can I use RIPA buffer for cell lysis, or will it ruin my LC-MS/MS?
RIPA buffer contains SDS at 0.1-1%, which produces 50-90% ion suppression in electrospray LC-MS/MS and forms +288 Da SDS adducts with basic drugs. It is not compatible with direct injection and requires a detergent removal step — either detergent removal spin columns (Pierce, Zeba), protein precipitation with acetone, or SPE cleanup — each of which adds variability and potential analyte loss. For LC-MS/MS cell lysate analysis, replace RIPA with 70% acetonitrile sonication (complete lysis, direct injection compatible, no cleanup needed) or validate a detergent removal protocol with recovery >85% for the specific analyte. If you must use RIPA (e.g., for a combined proteomics-plus-drug protocol), include a post-lysis acetone precipitation or SPE desalting step and confirm recovery.
How many PBS washes are enough to remove extracellular drug?
Three washes with a volume that covers the cell monolayer (typically 1 mL per well of a 6-well plate) reduces residual medium by approximately 10⁶-fold (100× per wash × 3), reducing extracellular drug carryover to negligible levels for most experimental conditions. The wash volume should be generous — the limiting factor is the residual liquid film, not the bulk wash. Validate by spiking a fluorescent dye (e.g., Lucifer Yellow, a membrane-impermeant marker) into the medium, performing the wash protocol, and measuring residual fluorescence in the lysate. The residual should be below 0.1% of the original medium concentration.
My drug-free (no-cell) wells show signal — is my data invalid?
Not necessarily invalid, but it requires correction. The no-cell control signal represents drug adsorbed to the plate surface that dissolves in the lysis solvent. If the no-cell signal is less than 10% of the cell-containing well signal, subtract the no-cell value from the cell-containing value and report the corrected concentration. If the no-cell signal exceeds 10%, the method is measuring predominantly plate binding rather than intracellular drug, and the data are unreliable. Mitigate with BSA-coated or low-binding plates and repeat.
Should I normalize by protein or by cell number?
Both. Protein normalization (ng/mg protein, by BCA or Bradford) is the literature standard and is technically straightforward, but it fails when drug treatment alters cellular protein content — mTOR inhibitors suppress translation, reducing protein per cell and artifactually inflating ng/mg values. Cell-number normalization (ng/million cells) is independent of protein content changes and should always be reported alongside protein-normalized values. If the protein-to-cell ratio is consistent across treatment groups (within ±15%), both methods agree and either is reliable. If the ratio changes, cell-number normalization is the more accurate basis for concentration comparison. A simple check: measure total protein per well and divide by cell count. If this ratio differs across treatment groups, protein normalization is misleading.
How do I calculate actual intracellular drug concentration in µM from my LC-MS/MS result?
(1) Drug mass (ng) = LC-MS/MS concentration (ng/mL) × lysate volume (mL). (2) Total cell volume (µL) = cell count per sample × cell volume (µL per cell). Use measured or literature values: hepatocyte ∼3.5 pL, HEK293 ∼1.2 pL, HeLa ∼2.5 pL. (3) Intracellular concentration (ng/µL) = drug mass (ng) / total cell volume (µL). Convert to µM: [C_intra (ng/µL) × 1000] / MW (g/mol) = µM. (4) Accumulation ratio = C_intra (µM) / C_medium (µM). Example: 10⁶ HEK293 cells, 6.4 ng drug, 1.2 pL/cell → total volume = 1.2 µL → 6.4 ng / 1.2 µL = 5,333 ng/µL → [5,333 × 1000] / 488 = 10,930 ng/mL = 10.9 µM. Medium = 1 µM → accumulation ratio = 10.9. This means 11-fold intracellular accumulation.
Does the cold PBS wash change my intracellular drug measurement?
It can, if your drug is a transporter substrate. Cold (4°C) PBS suppresses active efflux transporters (P-gp, BCRP), trapping drug inside cells that would otherwise be pumped out at 37°C. This produces an artificial 2- to 5-fold elevation of measured intracellular concentration. Validate by comparing 4°C wash versus a 37°C rapid wash (completed within 15 seconds). If the concentrations differ by >20%, the drug is affected and you should use the 37°C rapid wash for transporter substrate assessment studies. For routine non-transporter quantification, 4°C is the pragmatic standard — but acknowledge the potential limitation.
What cell volume should I use for my cell type?
Literature values (from Coulter counter measurements of trypsinized cells, assuming spherical geometry): primary human hepatocytes 3.0-4.0 pL, HEK293 1.0-1.5 pL, HeLa 2.0-3.0 pL, Caco-2 1.5-2.0 pL, MDCK 1.3-1.7 pL, CHO 0.9-1.3 pL, Jurkat (suspension) 0.6-1.0 pL, A549 2.0-3.0 pL. These are ranges, not constants — cell volume varies with culture conditions, passage number, and confluence. For quantitative intracellular concentration calculations, measure cell volume for your specific cells and conditions using a Coulter counter or by measuring cell diameter microscopically (volume = 4/3πr³). When using literature values, report the source and acknowledge the uncertainty. For intracellular concentration determination across diverse cell types, our tissue and cell lysate quantification services include cell volume measurement and intracellular concentration calculation for each study.
References
- Chu X, Bleasby K, Evers R. Species differences in drug transporters and implications for translating preclinical findings to humans. Expert Opin Drug Metab Toxicol. 2013;9(3):237-252. doi:10.1517/17425255.2013.741589
- Harwood MD, Achour B, Neuhoff S, Russell MR, Carlson G, Warhurst G, Rostami-Hodjegan A. In vitro-in vivo extrapolation scaling factors for intestinal P-glycoprotein and breast cancer resistance protein: Part I — A cross-laboratory comparison of transporter-protein abundances and relative expression factors in human intestine and Caco-2 cells. Drug Metab Dispos. 2016;44(3):297-307. doi:10.1124/dmd.115.067371
- Mateus A, Matsson P, Artursson P. Rapid measurement of intracellular unbound drug concentrations. Mol Pharm. 2013;10(6):2467-2478. doi:10.1021/mp4000822
- Guo Y, Chu X, Parrott NJ, Brouwer KLR, Hsu V, Nagar S, et al. Advancing Predictions of Tissue and Intracellular Drug Concentrations Using In Vitro, Imaging and Physiologically Based Pharmacokinetic Modeling Approaches. Clin Pharmacol Ther. 2018;104(5):865-889. doi:10.1002/cpt.1183
- Korzekwa K, Nagar S. On the Nature of Physiologically-Based Pharmacokinetic Models — A Priori or A Posteriori? Mechanistic or Empirical? Pharm Res. 2017;34(3):529-534. doi:10.1007/s11095-016-2089-8
- Chien HC, Zur AA, Maurer TS, Yee SW, Tolsma J, Jasper P, et al. Rapid Method To Determine Intracellular Drug Concentrations in Cellular Uptake Assays: Application to Metformin in OCT1-Transfected HEK Cells. Drug Metab Dispos. 2016;44(3):356-364. doi:10.1124/dmd.115.066647
- Mouton JW, Theuretzbacher U, Craig WA, Tulkens PM, Derendorf H, Cars O. Tissue concentrations: do we ever learn? J Antimicrob Chemother. 2008;61(2):235-237. doi:10.1093/jac/dkm476
- Mateus A, Treyer A, Wegler C, Karlgren M, Matsson P, Artursson P. Intracellular drug bioavailability: a new predictor of system dependent drug disposition. Sci Rep. 2017;7:43047. doi:10.1038/srep43047
- Gordon LJ, Allen M, Artursson P, Hann MM, Leavens BJ, Mateus A, Readshaw S, Valko K, Wayne GJ, West A. Direct Measurement of Intracellular Compound Concentration by RapidFire Mass Spectrometry Offers Insights into Cell Permeability. SLAS Discov. 2016;21(2):156-164. doi:10.1177/1087057115604141
Disclaimer: All services and resources mentioned on this site are for research use only (RUO) and are not intended for diagnostic, therapeutic, or clinical applications.
Related Services


