What Is Downstream Metabolite Tracking and Why It Matters
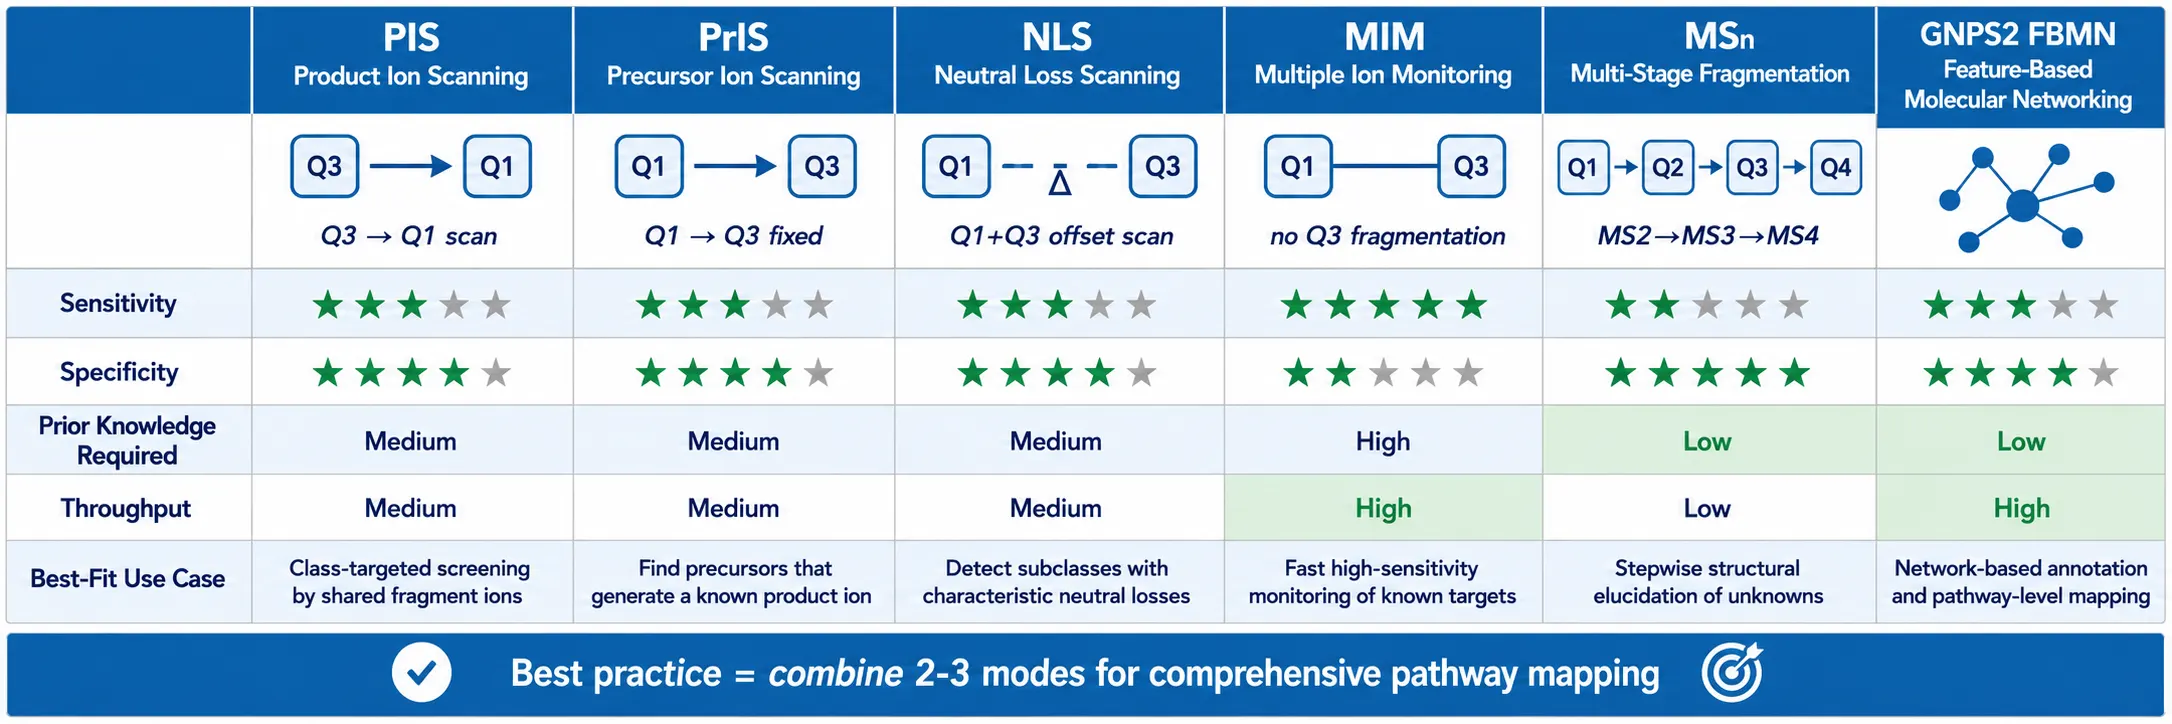 Figure 1: Six technical approaches comparison matrix — PIS, PrIS, NLS, MIM, MSn, and GNPS2 FBMN — with sensitivity, specificity, prior knowledge required, throughput, and best-fit use case for each
Downstream metabolite tracking is the systematic tracing of a drug molecule through sequential biotransformation cascades — from parent to primary metabolite to secondary metabolite to terminal metabolite. It answers the question that metabolite identification (MetID) leaves half-answered: not just "what metabolites are formed?" but "what cascade of enzymatic steps led to each metabolite, and in what order?"
The distinction matters because intermediate metabolites in a cascade can be pharmacologically active, toxic, or both. Acetaminophen illustrates the principle: parent (safe) is metabolized by CYP2E1 to NAPQI (hepatotoxic intermediate), which is then conjugated with glutathione to a non-toxic terminal GSH adduct. The intermediate is the toxicity driver; without tracking the full cascade, NAPQI — and its risk — remain invisible.
Downstream tracking also resolves whether metabolites accumulate. When a primary metabolite forms faster than it is cleared (formation-limited secondary step), it accumulates and steady-state exposure may exceed the parent's. When the secondary step is rapid (elimination-limited), the primary metabolite stays low regardless of formation rate. These kinetic distinctions determine which metabolites need quantitative measurement in safety studies.
Species differences in downstream metabolism create regulatory risk. A primary metabolite M1 may form equally across rat, dog, and human hepatocytes — but if the secondary step (M1 to M2) is efficient in rat and dog yet impaired in human, M1 accumulates disproportionately in human plasma. Without downstream tracking, this species divergence is invisible until first-in-human data — too late to avoid a MIST-triggered clinical hold.
Downstream metabolite tracking completes a three-article metabolite workflow. Metabolite identification establishes what metabolites exist. Drug metabolite quantification measures their concentrations. Downstream tracking maps their sequential relationships — transforming a metabolite list into a predictive biotransformation pathway.
Technical Approaches for Sequential Metabolite Tracking
Six distinct LC-MS/MS scan modes enable sequential metabolite tracking. Each has a different balance of sensitivity, specificity, prior knowledge requirement, and throughput. No single mode is sufficient alone; best practice combines two or three for comprehensive pathway mapping.
Product Ion Scanning (PIS): Set Q3 to a characteristic product ion shared by parent and metabolites; scan Q1 to find all precursors generating that fragment. If the parent produces a piperidine fragment at m/z 116, PIS at m/z 116 identifies every metabolite retaining the piperidine ring — regardless of modifications elsewhere. Metabolites lacking the target fragment are invisible, but those retaining it are found with high confidence. Application: profiling all metabolites conserving a core pharmacophore.
Precursor Ion Scanning (PrIS): The inverse — scan Q1 while Q3 is fixed at a fragment diagnostic of a conjugate class. In negative ion mode, glucuronide conjugates produce m/z 113 (deprotonated glucuronic acid); sulfate conjugates produce m/z 97 (HSO4-); GSH adducts show m/z 272. PrIS at these fixed masses finds every conjugate of that class in a single scan — no need to predict which metabolites carry the modification. Application: class-specific surveys without exact mass prediction.
Neutral Loss Scanning (NLS): Q1 and Q3 scan simultaneously with a fixed mass offset. NL 176 Da: every glucuronide (loss of glucuronyl moiety). NL 80 Da: every sulfate (loss of SO3). NL 129 Da: gamma-glutamyl loss from processed GSH adducts. NL 44 Da: CO2 loss from decarboxylated metabolites. NLS detects conjugates by mass difference alone — no product ion specification needed. Application: unbiased detection of all conjugates of a given type, including unexpected ones missed by list-based prediction.
Multiple Ion Monitoring (MIM): Predict all possible sequential metabolite masses by combining parent mass with common biotransformation shifts, then set MIM transitions monitoring all predicted precursors without Q3 fragmentation. MIM sacrifices structural specificity for sensitivity — detection limits are 5-10x lower than full-scan methods. Application: high-sensitivity targeted tracking when the pathway is partially characterized.
MSn (Multi-Stage Fragmentation): MS2 isolates and fragments the metabolite; MS3 further fragments a specific MS2 product ion. For a metabolite with hydroxylation + glucuronidation, MS2 removes the labile glucuronide first (−176 Da); MS3 of the de-glucuronidated fragment reveals the hydroxylation site by comparison with parent fragmentation. Without MSn, single-stage MS2 may show ambiguous neutral losses where both modifications fragment simultaneously. Application: deconvolution of multi-step metabolites where modification order matters.
GNPS2 Feature-Based Molecular Networking (FBMN): A post-acquisition computational approach — unlike the five acquisition-based scan modes above. LC-MS/MS data files are processed through MZmine or MS-DIAL, then submitted to the GNPS2 web platform. MS2 spectra are compared by cosine similarity; metabolites with similar fragmentation cluster as nodes in a molecular network. Mass differences between connected nodes identify biotransformations: +16 Da = oxidation, +176 Da = glucuronidation, −14 Da = demethylation. The parent node connects to primary metabolites, which connect to secondary metabolites; leaf nodes are terminal metabolites with no further connections. GNPS2 requires no prior knowledge of drug structure — the network topology itself reveals the pathway. Application: untargeted pathway discovery, orthogonal to list-based prediction.
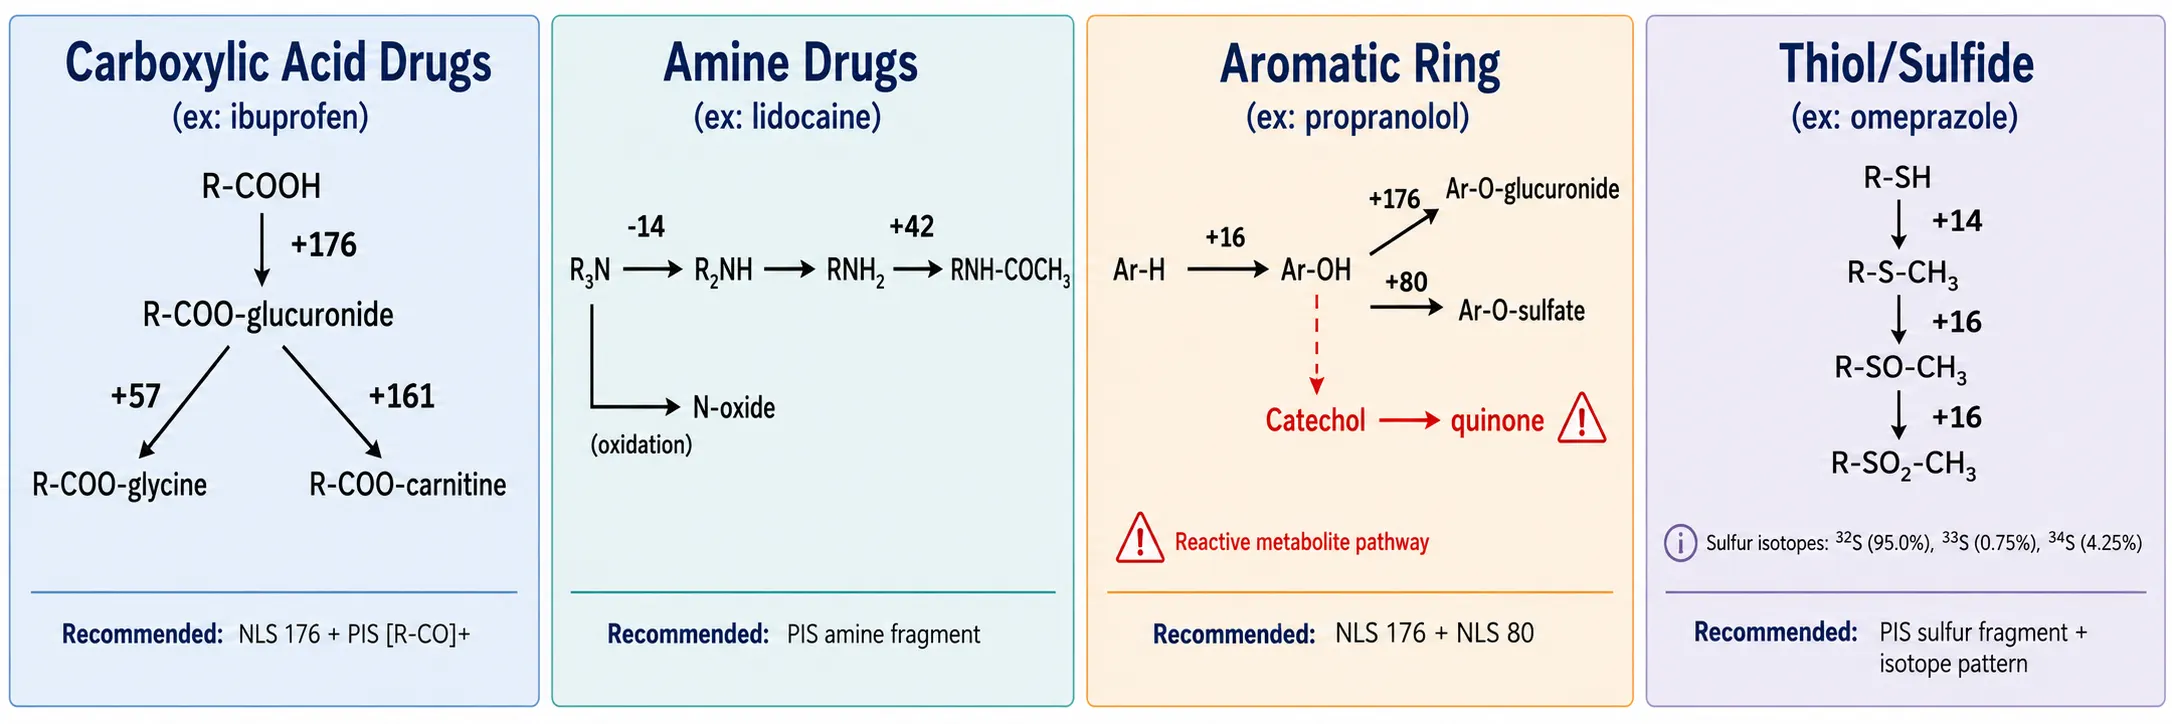 Figure 2: Pathway-specific tracking strategies — carboxylic acid, amine, aromatic ring, and thiol drug cascades with mass shift sequences and recommended scan modes for each step
Pathway-Specific Tracking Strategies
Different drug chemotypes follow characteristic biotransformation cascades. Knowing the likely pathway for a given functional group allows the analyst to select the most efficient scan mode combination and predict the mass shifts to monitor.
Carboxylic acid drugs (ibuprofen, naproxen, valproic acid): Step 1: acyl glucuronidation (+176 Da) — the acyl glucuronide is reactive and pH-labile (half-life minutes to hours at pH 7.4), requiring acidic sample handling (pH 2-4). Acyl migration within the glucuronide ring produces multiple isomeric peaks at identical mass. Step 2: further conjugation to glycine (+57 Da) or carnitine (+161 Da). Track with NLS 176, PIS for the [R-CO]+ acylium fragment, and PrIS m/z 113 in negative mode.
Amine-containing drugs (lidocaine, imipramine, verapamil): Sequential N-dealkylation. Step 1: tertiary amine (R3N) → secondary amine (R2NH, -14 Da for N-demethylation). Step 2: secondary → primary amine (RNH2). Step 3: N-acetylation (+42 Da) or oxidative deamination to carboxylic acid. Track with PIS for the conserved amine fragment. The parallel N-oxide pathway (+16 Da, FMO-catalyzed) is distinguished from C-hydroxylation by MS2: N-oxides show loss of oxygen radical (M-16), while C-hydroxylation shows loss of water (M-18).
Aromatic ring hydroxylation cascade: Step 1: CYP-mediated hydroxylation (+16 Da) produces phenol. Step 2: conjugation — O-glucuronidation (+176 Da) or O-sulfation (+80 Da). Adjacent dihydroxylation (catechol, +32 Da) may auto-oxidize to ortho-quinone — a reactive electrophile detectable via GSH trapping assays (+305 Da). Track with NLS 176, NLS 80, and PIS for the aromatic fragment.
Thiol and sulfide drugs (captopril, omeprazole, tiopronin): Step 1: S-methylation (+14 Da). Step 2: sulfoxidation (+16 Da, sulfoxide). Step 3: further oxidation (+16 Da, sulfone, +32 Da from S-methyl). Each step increases polarity and clearance. Track with PIS for sulfur-containing fragments; the natural 34S isotope pattern (4.2% M+2) persists through all sulfur-containing metabolites.
Prodrug activation tracking: The administered prodrug (inactive ester or phosphate) undergoes enzymatic cleavage to the active drug, which then enters the standard metabolic cascade. Key measurements: activation rate (k_act), active drug-to-prodrug AUC ratio, residual prodrug at Tmax. Track with PIS for the active drug fragment; NLS for activation-specific neutral loss (NL 98 Da for phosphate, NL 60 Da for acetate esters).
Isotope-Assisted Downstream Tracking
Isotope patterns provide an orthogonal dimension of selectivity that distinguishes drug-related metabolites from endogenous interferences regardless of their structure or unexpected mass shifts.
Natural abundance isotope patterns: If the parent drug contains chlorine (35Cl/37Cl, 3:1) or bromine (79Br/81Br, 1:1), every metabolite retaining the halogen shows the same M:M+2 isotope ratio. Extracting ion chromatograms for both M and M+2 eliminates endogenous isobaric interferences — matrix ions lack the halogen pattern. No specialized reagents or labeling are required. Application: rapid differentiation of drug metabolites from matrix background in complex samples (feces, bile, tissue).
13C/15N stable isotope labeling: A 1:1 mixture of unlabeled and 13C/15N-labeled drug produces metabolites as 1:1 doublets in mass spectra — all drug-derived material shows this signature while endogenous compounds appear as singlets. MS2 fragmentation of the doublet reveals which fragments retain labeled atoms, pinpointing the biotransformation site. Application: distinguishing O-demethylation from N-demethylation — identical nominal mass shifts but different labeled-fragment patterns.
14C radiolabel tracking: The definitive method for tracking all drug-related material. Administer 14C-labeled drug; separate plasma, urine, bile, and feces by HPLC with online radio-flow detection. The radiochromatogram quantifies every radiolabeled peak regardless of ionization efficiency — parent, metabolites, and irreversibly protein-bound material are all accounted for. Quantitative metabolite profiling from 14C data, where each peak's radioactivity percentage equals its molar percentage of dose, is the gold standard for determining which metabolites exceed the 10% MIST threshold. The limitation: 14C synthesis is expensive and radiolabel ADME studies are conducted late in development. For discovery-stage tracking, stable isotope approaches are more practical.
Dual labeling for pathway deconvolution: A 1:1 mixture of 12C-parent and 13C-parent (labeled at a specific position) produces metabolites as 1:1 doublets in MS1. When fragmented in MS2, fragments shifting by the label mass contain the labeled atom; unshifted fragments do not. If the label is on the phenyl ring and the metabolite doublet remains 1:1, the modification is elsewhere on the molecule (label retained). If the doublet collapses to a singlet, the modification involved the labeled position (label lost). Application: distinguishing between two possible sites of the same biotransformation — e.g., hydroxylation on ring A vs ring B of a biaryl compound.
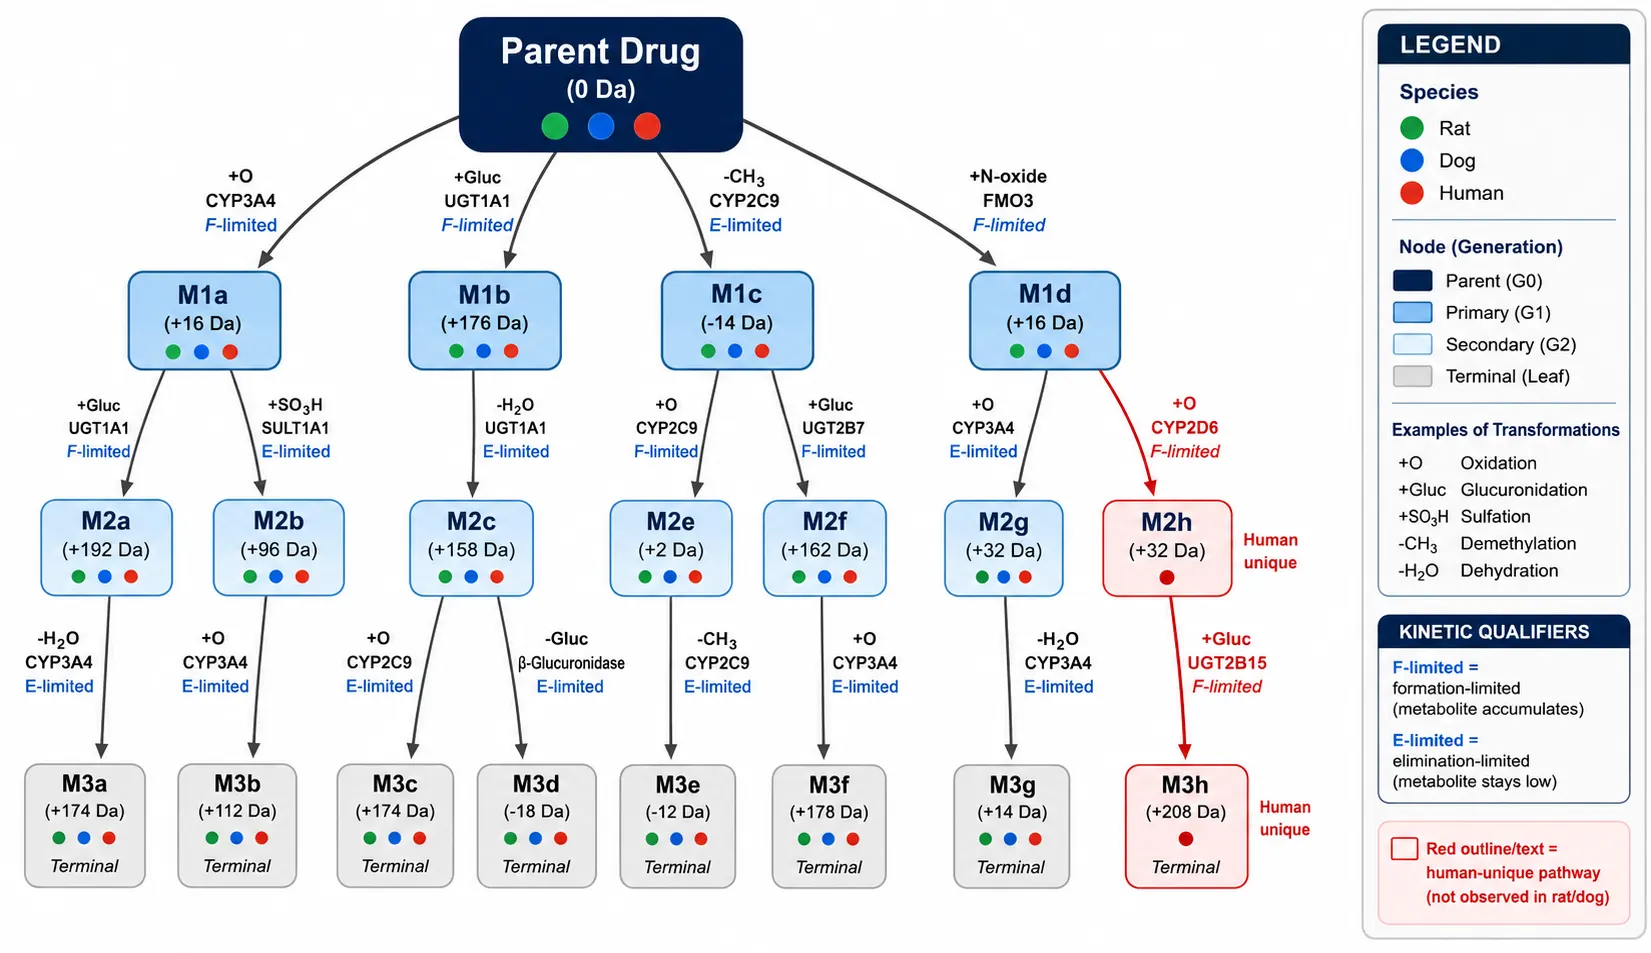 Figure 3: Metabolic pathway map example — parent drug to primary, secondary, and terminal metabolites — with species overlay (rat/dog/human colored dots), enzyme annotations on each arrow, and kinetic qualifiers (formation-limited vs elimination-limited steps)
From Tracking Data to Pathway Map
The raw output of downstream tracking experiments — dozens of metabolite peaks across multiple scan modes, timepoints, and species — must be synthesized into a coherent pathway map that guides decision-making.
Constructing the map: Begin with the parent drug as the root node. Connect each primary metabolite (one biotransformation away from parent) to the parent with an arrow. Connect each secondary metabolite to its primary precursor. Terminal metabolites — those with no further detectable biotransformation products — are leaf nodes with outgoing arrows only. The mass difference on each arrow identifies the biotransformation type (+16 = oxidation, +176 = glucuronidation, -14 = demethylation, etc.). Drug metabolism and biotransformation expertise is essential for assigning the correct biotransformation type to mass differences — several different reactions can produce the same nominal mass shift (+16 could be hydroxylation, epoxidation, or N-oxidation, each with different toxicological implications).
Kinetic qualifiers are assigned to each step by comparing metabolite concentrations across timepoints. If primary metabolite M1 concentration rises and plateaus while secondary metabolite M2 concentration steadily increases, the M1-to-M2 step is elimination-limited (M2 formation outpaces M1 further formation at later timepoints, but M1 is being consumed as fast as it forms). If M1 accumulates linearly while M2 is barely detectable, the M1-to-M2 step is formation-limited (M1 clearance is rate-limiting). Formation-limited secondary steps cause primary metabolite accumulation — these are the metabolites most likely to reach concentrations requiring safety qualification.
Species overlay: For each metabolite node, mark species presence with colored dots — green (rat), blue (dog), red (human). A branch common to all three species confirms adequate tox species coverage. A human-only branch (red dot only) is high-risk — the metabolite lacks preclinical tox coverage. A human-disproportionate branch (>2x human exposure) is intermediate risk — the metabolite is present in tox species but at lower relative exposure. The species overlay is the most important visual output for MIST assessment.
Enzyme annotation: Label each arrow with the enzyme(s) responsible, determined from reaction phenotyping (rCYP panel, selective inhibitors, recombinantly expressed enzymes). CYP3A4-mediated steps are susceptible to drug-drug interactions; UGT1A1-mediated glucuronidation has known pharmacogenetic variation (UGT1A1*28 allele); aldehyde oxidase (AO)-mediated oxidation shows pronounced species differences (high human, low dog, absent rat). Enzyme annotation converts the pathway map from description to prediction — if a competing CYP3A4 substrate is co-administered, the map identifies which branches are at DDI risk.
The pathway map as a living document: Version 1 is generated from in vitro hepatocyte incubation (discovery, low confidence). Version 2 incorporates in vivo plasma, urine, and bile from two preclinical species (pre-IND, moderate confidence). Version 3 is updated after the human 14C-ADME study (clinical, high confidence). The final map submitted in the NDA should account for >90% of drug-related material in human plasma.
Practical Workflow for Downstream Metabolite Tracking
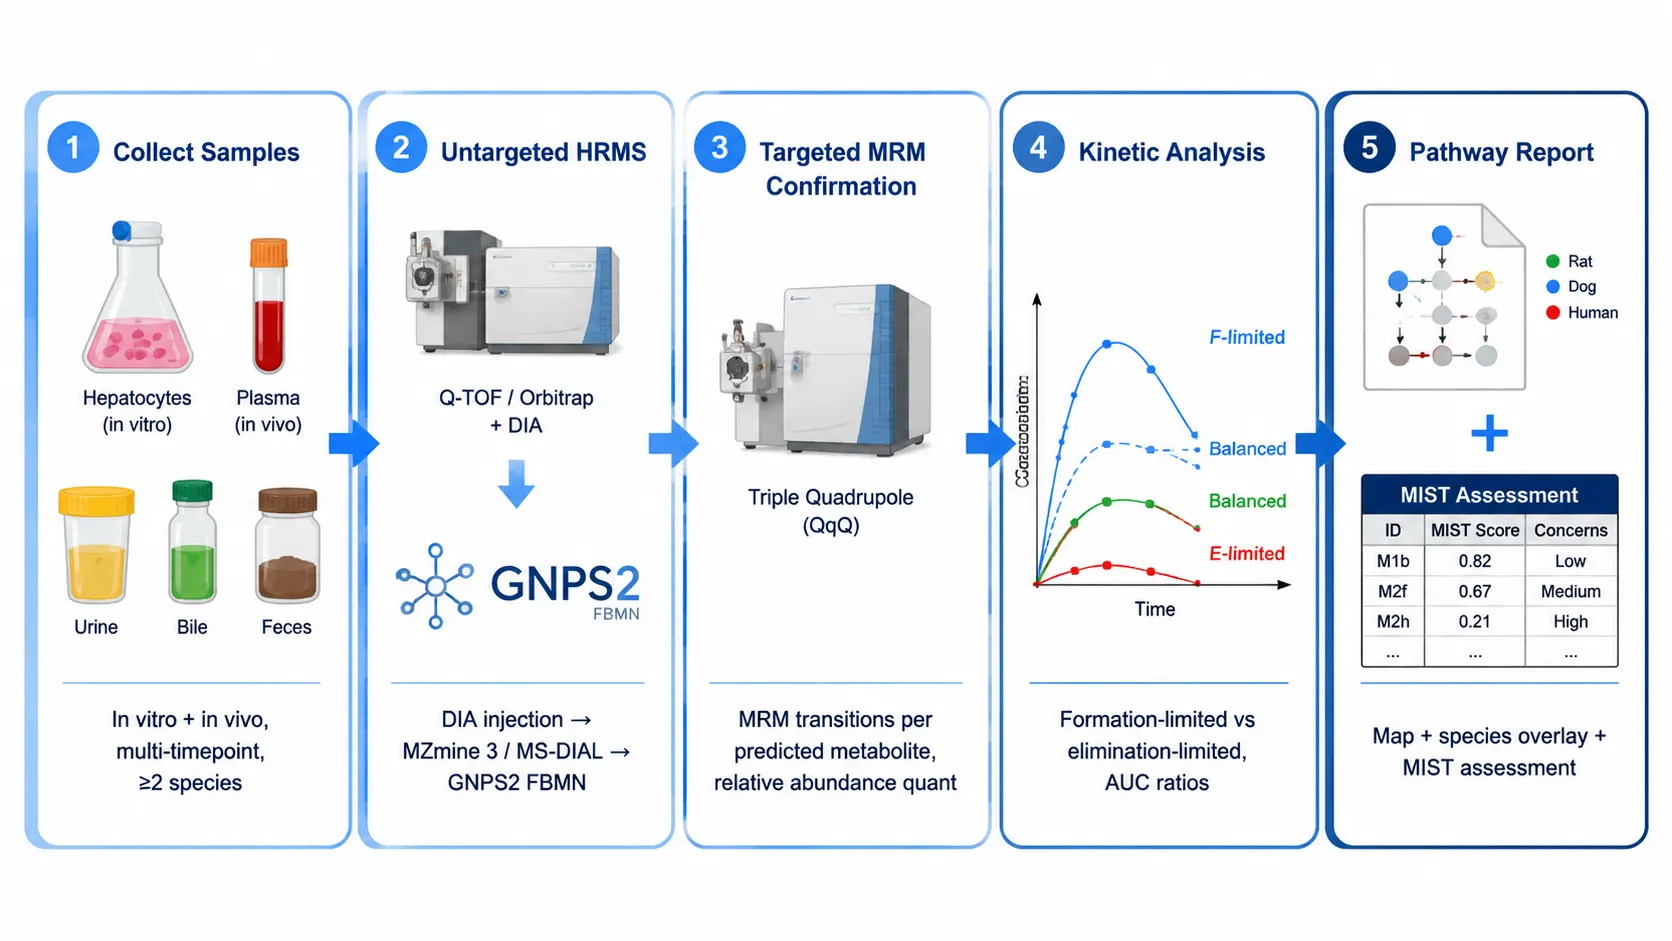 Figure 4: Five-step downstream tracking workflow — sample collection to untargeted HRMS profiling, targeted MRM confirmation, kinetic analysis, and regulatory-ready pathway reporting
A five-step workflow takes downstream metabolite tracking from sample collection through regulatory-ready pathway reporting. Each step builds on the previous, and the complete workflow can be executed within a typical 4-6 week drug candidate characterization timeline.
Step 1 — Collect a comprehensive sample set. In vitro: hepatocyte incubation (human + tox species), 0-240 min, at least 5 timepoints. Multiple timepoints are essential — a single endpoint incubation provides a metabolite list but no formation-rate information. In vivo: plasma (serial, 6+ timepoints), urine (pooled 0-24h), bile (cannulated, pooled 0-8h), and feces (pooled 0-24h) from rat and dog. At minimum, two species are needed for cross-species comparison.
Step 2 — Untargeted HRMS profiling. Run one DIA (MSe or SWATH) injection per sample type on a Q-TOF or Orbitrap. Process data through MZmine 3 or MS-DIAL for feature detection and alignment. Submit the feature table and MS2 spectra to GNPS2 for Feature-Based Molecular Networking. The molecular network identifies all drug-related nodes and their sequential relationships, generating a candidate pathway map — Version 1.
Step 3 — Targeted confirmation. For each metabolite node in the Version 1 map, set up MRM transitions on a triple quadrupole. If reference standards are unavailable (typical for secondary/tertiary metabolites), use predicted transitions from the parent's fragmentation pattern adjusted by the metabolite's mass shift. LC-MS/MS single drug quantification methods serve as the starting point. Measure relative abundance (peak area ratio to parent) at each timepoint and confirm that secondary metabolites appear after primary metabolites chronologically.
Step 4 — Kinetic analysis. Fit a sequential metabolism model to time-course data. For parent-to-M1: calculate M1-to-parent AUC ratio. For M1-to-M2: calculate M2-to-M1 AUC ratio. Classify each step as formation-limited (M1 AUC >> M2 AUC, primary accumulates) or elimination-limited (M1 AUC << M2 AUC). For MIST assessment, rank metabolites by relative abundance at steady state; any metabolite >10% of total drug-related material in human and inadequately covered in tox species requires further evaluation.
Step 5 — Report. Deliverables: (a) Complete pathway map with kinetic qualifiers and species overlay. (b) Metabolite relative abundance table (all timepoints, species, matrices). (c) MIST assessment table listing each metabolite with human abundance, tox species coverage status, and recommended action. (d) Enzyme annotation table linking each biotransformation step to supporting phenotyping data. Flag human-unique metabolites >10%, disproportionate metabolites (>2x human vs tox species), and known toxic intermediates.
Frequently Asked Questions
What's the difference between metabolite identification (MetID) and downstream metabolite tracking?
MetID identifies individual metabolites — what they are and where the modification occurred. Downstream tracking maps the sequential relationships — which metabolite is the precursor to which, and which steps are formation-limited vs elimination-limited. MetID produces a structure list; downstream tracking produces a pathway map with kinetic qualifiers and species comparisons. Downstream tracking depends on MetID results as its starting point.
How does GNPS2 molecular networking help track sequential metabolites without knowing the drug structure?
GNPS2 clusters metabolites based on MS2 spectral similarity — metabolites with similar fragmentation patterns group together as nodes in a molecular network. The mass difference between connected nodes reveals the biotransformation type (+16 Da = oxidation, +176 Da = glucuronidation, etc.). The parent drug node connects to primary metabolites, which connect to secondary metabolites. Leaf nodes with no further connections are terminal metabolites. The network topology itself — nodes and edges — IS the pathway map, generated without any prior knowledge of the drug's metabolic fate. The primary limitation: GNPS2 only detects metabolites that ionize and fragment; poorly ionizing metabolites may be missed in the network.
Can I track downstream metabolites without radiolabeled drug?
Yes. For discovery and preclinical applications, untargeted HRMS with DIA followed by GNPS2 molecular networking provides comprehensive metabolite detection without radiolabels. Stable isotope labeling (13C/15N) offers isotope-assisted specificity without 14C regulatory requirements. Radiolabeled studies remain the gold standard for definitive mass balance but are typically conducted after candidate nomination, not during lead optimization.
Which scan mode should I use to find all glucuronide conjugates of my drug?
Neutral loss scanning (NL 176 Da) in positive ion mode or precursor ion scanning (PrIS m/z 113) in negative ion mode. NLS 176 detects any metabolite losing the glucuronyl moiety during CID. PrIS m/z 113 detects the deprotonated glucuronic acid fragment specifically. Running both provides redundant, complementary detection. Acyl glucuronides can also be identified by pH-dependent degradation — repeat injection at pH 7.4 and pH 2; acyl glucuronide peaks decrease at higher pH.
How do I know if a secondary metabolite will accumulate in vivo?
Compare the secondary metabolite's formation rate (k_form) to its elimination rate (k_elim). If k_form > k_elim, it accumulates. Assess in vitro: incubate the primary metabolite in hepatocytes and measure its depletion; separately measure the secondary metabolite's stability. In vivo, an M2-to-M1 AUC ratio that increases with time suggests accumulation. Single-timepoint ratios are insufficient — reliable classification requires fitting a compartmental model to multi-timepoint data.
References
- Nothias LF, Petras D, Schmid R, Duhrkop K, Rainer J, Sarvepalli A, Protsyuk I, Ernst M, Tsugawa H, Fleischauer M, Aicheler F, Aksenov AA, Alka O, Allard PM, Barsch A, Cachet X, Caraballo-Rodriguez AM, Da Silva RR, Dang T, Garg N, Gauglitz JM, Gurevich A, Isaac G, Jarmusch AK, Kamenik Z, Kang KB, Kessler N, Koester I, Korf A, Le Gouellec A, Ludwig M, Martin HC, McCall LI, McSayles J, Meyer SW, Mohimani H, Morsy M, Moyne O, Neumann S, Neuweger H, Nguyen NH, Nothias-Esposito M, Paolini J, Phelan VV, Pluskal T, Quinn RA, Rogers S, Shrestha B, Tripathi A, van der Hooft JJJ, Vargas F, Weldon KC, Witting M, Yang H, Zhang Z, Zubeil F, Kohlbacher O, Bocker S, Alexandrov T, Bandeira N, Wang M, Dorrestein PC. Feature-based molecular networking in the GNPS analysis environment. Nat Methods. 2020;17(9):905-908.
- Aron AT, Gentry EC, McPhail KL, Nothias LF, Nothias-Esposito M, Bouslimani A, Petras D, Gauglitz JM, Sikora N, Vargas F, van der Hooft JJJ, Ernst M, Kang KB, Aceves CM, Caraballo-Rodriguez AM, Koester I, Weldon KC, Bertrand S, Roullier C, Sun K, Tehan RM, Boya P CA, Christian MH, Gutierrez M, Ulloa AM, Tejeda Mora JA, Mojica-Flores R, Lakey-Beitia J, Vasquez-Chaves V, Zhang Y, Calderon AI, Tayler N, Keyzers RA, Tugizimana F, Ndlovu N, Aksenov AA, Jarmusch AK, Schmid R, Truman AW, Bandeira N, Wang M, Dorrestein PC. Reproducible molecular networking of untargeted mass spectrometry data using GNPS. Nat Protoc. 2020;15(6):1954-1991.
- Zhu M, Zhang H, Humphreys WG. Drug metabolite profiling and identification by high-resolution mass spectrometry. J Biol Chem. 2011;286(29):25419-25425.
- Schymanski EL, Jeon J, Gulde R, Fenner K, Ruff M, Singer HP, Hollender J. Identifying small molecules via high resolution mass spectrometry: communicating confidence. Environ Sci Technol. 2014;48(4):2097-2098.
- Kalgutkar AS, Gardner I, Obach RS, Shaffer CL, Callegari E, Henne KR, Mutlib AE, Dalvie DK, Lee JS, Nakai Y, O'Donnell JP, Boer J, Harriman SP. A comprehensive listing of bioactivation pathways of organic functional groups. Curr Drug Metab. 2005;6(3):161-225.
- Prakash C, Shaffer CL, Nedderman A. Analytical strategies for identifying drug metabolites. Mass Spectrom Rev. 2007;26(3):340-369.
- Dalvie DK, Kalgutkar AS, Khojasteh-Bakht SC, Obach RS, O'Donnell JP. Biotransformation reactions of five-membered aromatic heterocyclic rings and the impact on drug discovery. Chem Res Toxicol. 2002;15(3):269-299.
- Ma S, Chowdhury SK, Alton KB. Application of mass spectrometry for metabolite identification. Curr Drug Metab. 2006;7(5):503-523.
- Frederick CB, Obach RS. Metabolites in Safety Testing: "MIST" for the Clinical Pharmacologist. Clin Pharmacol Ther. 2010;87(3):345-350.
- Luffer-Atlas D. The early estimation of circulating drug metabolites in humans. Expert Opin Drug Metab Toxicol. 2012;8(8):985-997.
Disclaimer: All services and resources mentioned on this site are for research use only (RUO) and are not intended for diagnostic, therapeutic, or clinical applications.
Related Services


