Why Metabolite Quantification Matters in Drug Development
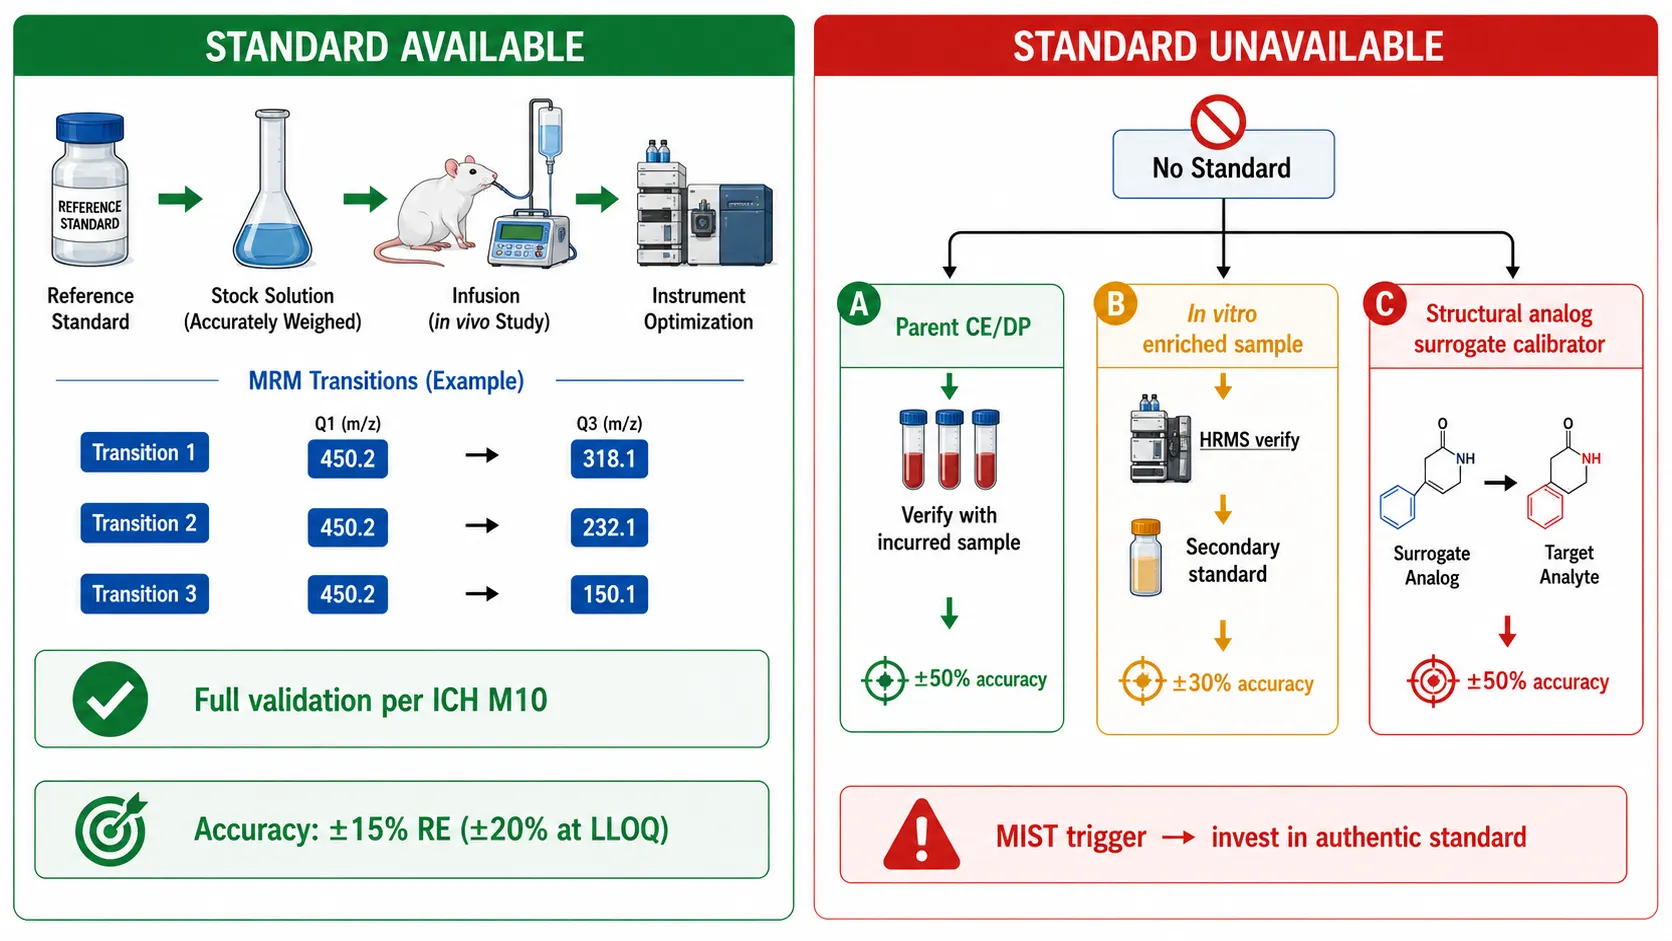 Figure 1: MRM method development decision tree — standard available vs unavailable
When a drug enters the body, it rarely stays intact. CYP enzymes oxidize it. UGTs conjugate it. Esterases hydrolyze it. The result is a cascade of metabolites — some pharmacologically active, some toxic, most inert — circulating alongside the parent drug. Quantifying these metabolites is not an academic exercise. It is a regulatory requirement.
The FDA's MIST guidance (Metabolites in Safety Testing) states clearly: if a human metabolite exceeds 10% of total drug-related exposure or 10% of the parent AUC, it requires safety assessment. You cannot determine whether a metabolite crosses this threshold without quantitative metabolite data. You cannot demonstrate that tox species were adequately exposed to a human metabolite without measuring its concentration in both species. And you cannot file an IND without addressing these questions.
Metabolite quantification is triggered in three key scenarios. First, the unique human metabolite — present disproportionately in human plasma but absent or minor in rat and dog tox species. This is the classic MIST concern and drives many late-stage metabolite synthesis programs. Second, the active metabolite — contributing meaningfully to efficacy or toxicity, sometimes surpassing the parent drug in target engagement. Third, the prodrug — where the parent is a pharmacokinetic vehicle and the metabolite is the active species. In each case, the question is the same: how much metabolite is present, and for how long?
The bioanalytical challenge that distinguishes metabolite quantification from parent drug quantification is straightforward and unforgiving: parent drugs come with reference standards; metabolites often do not. A medicinal chemistry team synthesizes the parent drug at kilogram scale and a small portion becomes the analytical reference standard. Metabolites must be synthesized separately — an expensive, time-consuming process that may require multi-step biosynthesis or chemical synthesis, often yielding milligram quantities at high cost. For a discovery program with a dozen active compounds and five metabolites each, authentic standards for every metabolite are a practical impossibility. This single fact — the frequent absence of a reference standard — defines the entire metabolite quantification problem.
The same LC-MS/MS platform that quantifies parent drugs (see LC-MS/MS single drug quantification) quantifies metabolites. The sample preparation workflows are similar. The chromatography is similar. But every decision — from MRM transition selection to internal standard strategy to calibration approach — must account for the fact that you may be quantifying something you cannot weigh out and dissolve in a volumetric flask.
MRM Method Development for Drug Metabolites
The starting point for metabolite quantification is metabolite identification. You need to know what you are measuring before you can measure it. Metabolite identification (MetID) experiments provide the structural map: what metabolites are formed, in which species, and at what approximate abundance. From this, you predict MRM transitions.
For Phase I metabolites, the mass shifts are predictable: +O adds 16 Da (hydroxylation, N-oxidation, epoxidation), -CH3 removes 14 Da (N- or O-demethylation), +2O adds 32 Da (dihydroxylation, sulfone formation), and -C2H4 removes 28 Da (deethylation). Phase II shifts are larger and more diagnostic: +176 Da for glucuronide conjugation, +80 Da for sulfate conjugation, +305 Da for glutathione (GSH) conjugation, +42 Da for acetylation, +57 Da for glycine conjugation. Each mass shift corresponds to a predictable change in the parent drug's MRM transition — add the mass shift to the precursor ion, then determine whether the product ion also shifts or remains at the parent product ion mass.
When you have an authentic metabolite reference standard, method development follows the same path as parent drug quantification. Weigh the standard, dissolve in an appropriate solvent, prepare a stock solution, infuse into the mass spectrometer, and optimize collision energy (CE) and declustering potential (DP) for each metabolite individually. Build calibration curves and quality control samples exactly as for the parent drug.
When you do not have a standard — the far more common case — three strategies exist. Strategy A uses the parent drug's CE and DP as a starting point, then verifies the transition using a metabolite-containing incurred sample (from in vitro microsome/hepatocyte incubation or in vivo plasma). If the metabolite peak is chromatographically resolved and has acceptable signal-to-noise, the parent-optimized parameters are used. This is acceptable for discovery-stage semi-quantitative profiling. Strategy B generates a metabolite-enriched sample from an in vitro incubation of the parent drug at high concentration with liver microsomes or hepatocytes. After HRMS verification that the enriched sample contains the target metabolite, this sample serves as a "secondary standard" — you cannot weigh it, but you can use it to optimize CE, DP, and verify chromatography. Strategy C uses the closest available structural analog as a surrogate calibrator — a compound with similar core structure and ionization properties. Accuracy ceiling for Strategy A: ±50% at best. Strategy B: ±30%. Strategy C: ±50%. For regulatory submissions where a metabolite triggers MIST, none of these strategies is sufficient; authentic standard is required.
Internal standard strategy for metabolites presents a parallel challenge. The ideal IS is a stable isotope-labeled analog of each metabolite (13C- or 15N-SIL-IS), synthesized alongside the metabolite standard. This is technically feasible but expensive — custom synthesis of a 13C-metabolite from a CRO typically costs $5,000-20,000 per metabolite. When budget or timeline precludes this, the parent drug SIL-IS is often used as a surrogate IS for all metabolites. This works if the metabolite and parent have similar ionization efficiency and extraction recovery — an assumption that must be verified, not assumed. Post-column infusion testing compares metabolite vs parent response with and without the parent SIL-IS. If the IS-normalized response is within ±15% across the expected retention time window, the parent SIL-IS is adequate. If not, structural analog IS or a separately optimized method is needed.
Transition selection requires care. The metabolite must have at least one product ion not shared with the parent drug to avoid cross-interference. For glucuronide metabolites, the neutral loss of 176 Da (dehydroglucuronic acid) is characteristic — monitor the transition [M+H]+ to [M+H-176]+ for quantification and [M+H]+ to [aglycone]+ for confirmation. For sulfate conjugates, the neutral loss of 80 Da (SO3) is characteristic but often source-labile — softer ionization conditions (lower cone voltage, lower source temperature) preserve the precursor ion. When no unique product ion exists, MIM (multiple ion monitoring) — where Q1 and Q3 are set to the same mass — provides a detection signal, albeit with higher background and lower specificity than true MRM.
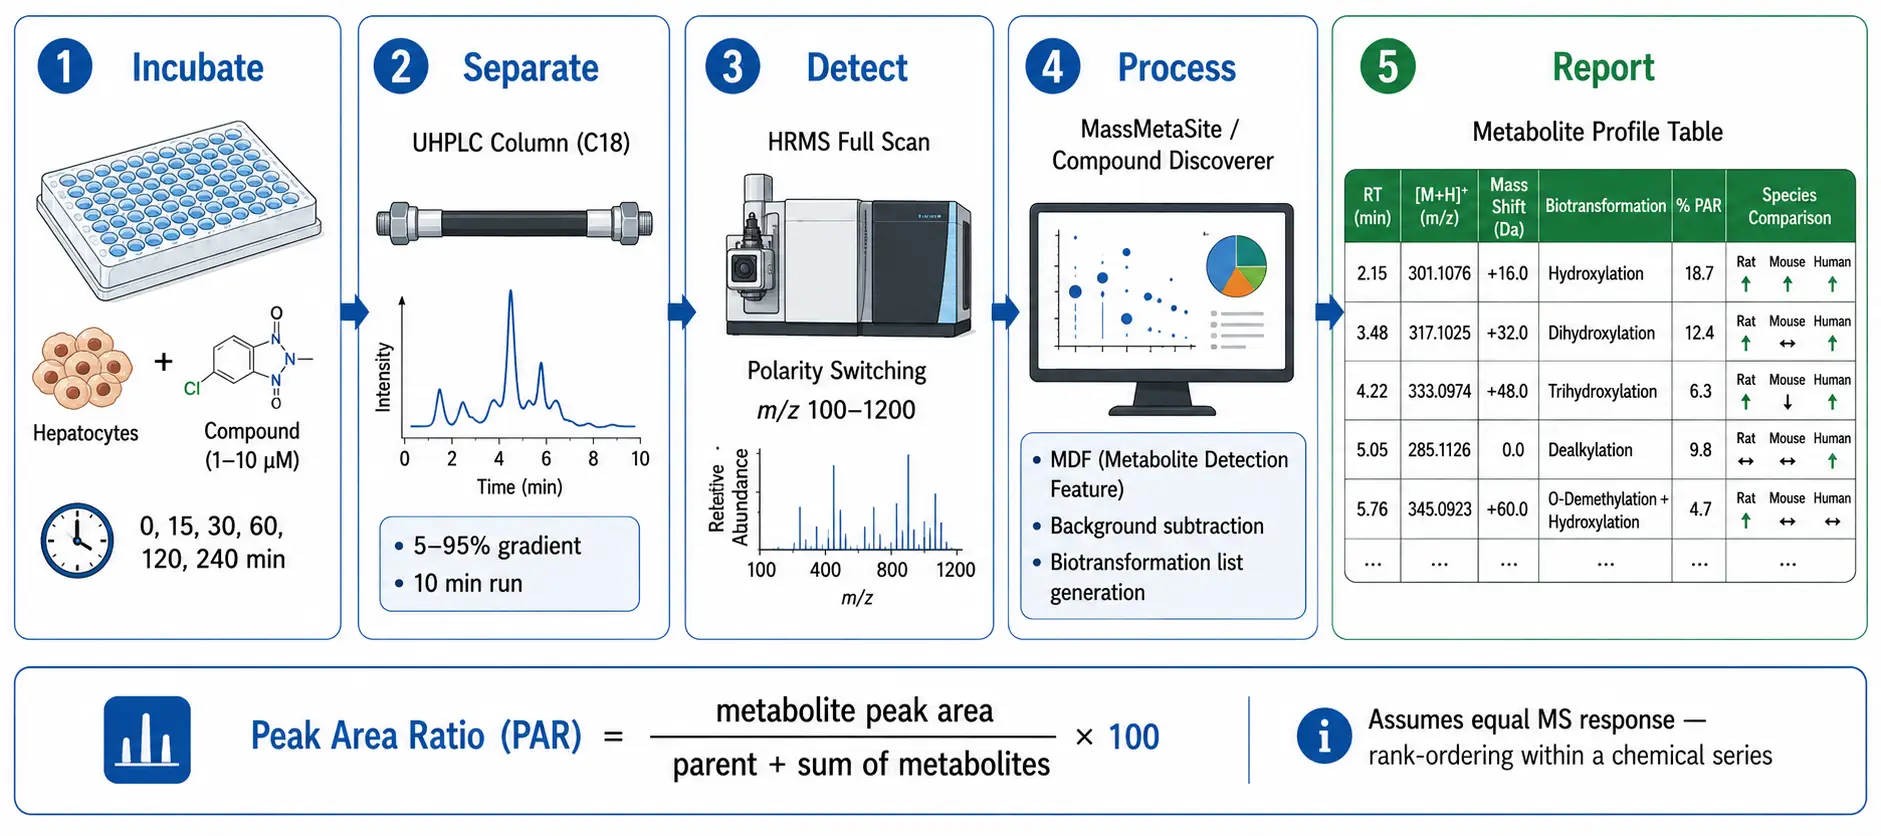 Figure 2: Discovery metabolite profiling workflow — incubation to metabolite table
Sample Preparation for Metabolite-Containing Matrices
Sample preparation for metabolite quantification extends the principles of parent drug extraction (Protein Precipitation, LLE, SPE) but must account for the altered physicochemical properties of metabolites. A parent drug with logP 3.5 becomes more polar upon hydroxylation (logP ∼2.5) and much more polar upon glucuronidation (logP ∼0-1). Extraction conditions optimized for the parent may recover metabolites poorly or, conversely, may degrade labile conjugates.
Plasma and serum remain the default matrices. Protein precipitation with 3:1 acetonitrile to plasma works for most metabolites, but two caveats apply. First, acyl glucuronides are labile at physiological pH — the ester bond between drug and glucuronic acid hydrolyzes with half-lives ranging from minutes to hours at pH 7.4 and 37°C. Acidifying plasma to pH 2-4 with formic acid immediately after collection stabilizes acyl glucuronides. Second, N-oxides can back-convert to the parent drug under basic conditions or elevated temperature. Avoid carbonate buffers during extraction and minimize heat exposure.
Urine is the major elimination route for most drugs and their metabolites. Metabolite concentrations in urine are typically 10-1,000 times higher than in plasma, as the kidney concentrates filtered solutes and water is reabsorbed. This is analytically advantageous — dilution of 1:10 to 1:100 typically brings urine concentrations within the calibration range. However, urine contains a different metabolite profile than plasma: Phase II conjugates (glucuronides, sulfates) dominate because conjugation increases water solubility and renal clearance. Total metabolite quantification in urine often requires enzymatic deconjugation — treatment with beta-glucuronidase (for glucuronides) or arylsulfatase (for sulfates), or a mixed preparation such as Helix pomatia extract, at 37°C for 1-2 hours at pH 5-6 (beta-glucuronidase optimum). The difference between free metabolite concentration (without enzyme treatment) and total (with enzyme treatment) provides the extent of conjugation.
Bile presents a unique challenge. Bile salt concentrations of 10-20 mM cause severe ion suppression in electrospray ionization — the bile salts compete with analytes for surface charge at the droplet interface. Dilution of 1:10 minimum or solid-phase extraction (HLB sorbent) is mandatory before LC-MS/MS injection. Bile also contains high concentrations of glutathione conjugates and their downstream metabolites (cysteinyl-glycine, cysteine, and N-acetylcysteine conjugates) — the mercapturic acid pathway. These are reactive metabolite biomarkers and may require their own optimized MRM methods.
Feces are heterogeneous — fiber, bacteria, water, and drug-related material in varying proportions. Homogenization is critical: add 5-10 volumes of water or buffer (w/v), homogenize the entire sample or a representative aliquot, centrifuge, and extract the supernatant. Fecal background from bacterial metabolites and dietary components raises the practical LLOQ — typically 5-10 times higher than plasma LLOQ for the same analyte. Also, gut bacterial beta-glucuronidase can hydrolyze glucuronide metabolites back to the parent drug in feces — if the parent drug concentration in feces appears unexpectedly high relative to plasma, suspect bacterial deconjugation.
Tissue metabolite quantification follows the tissue homogenization workflow and the same blood contamination correction formula (Kp) applied to parent drug tissue concentrations. Tissue metabolite Kp (metabolite tissue-to-plasma ratio) compared to parent Kp is informative: if Kp_metabolite >> Kp_parent, the metabolite is selectively retained in tissue — potentially a toxicity concern if the metabolite is active and the tissue is a target organ.
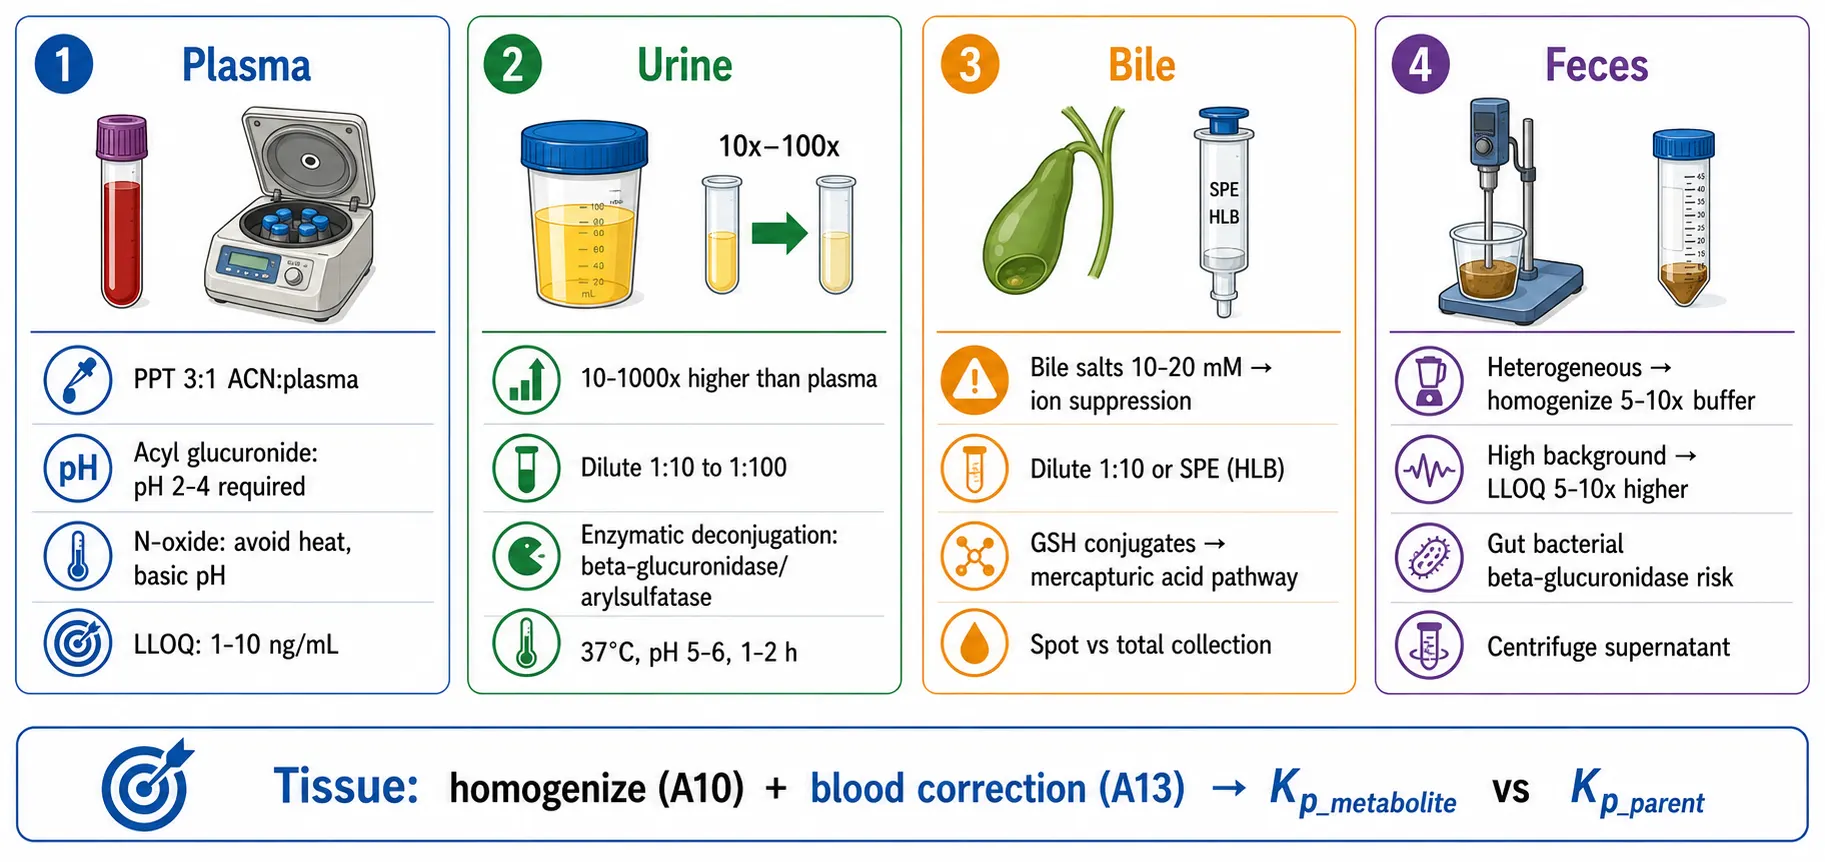 Figure 3: Matrix-specific metabolite considerations — 4-matrix comparison with pH stability, ion suppression, dilution factors
Key Analytical Challenges Unique to Metabolite Quantification
Metabolite-to-parent back-conversion is the most insidious source of error in metabolite quantification. It occurs when a metabolite reverts to the parent drug during sample collection, processing, storage, or analysis. Four mechanisms drive this. First, acyl glucuronides hydrolyze back to the parent carboxylic acid — pH-dependent, accelerated at neutral-to-basic pH. A plasma sample sitting at room temperature for two hours before extraction may lose 20-50% of its acyl glucuronide, with the liberated parent drug inflating the apparent parent concentration. Second, N-oxides thermally degrade back to the parent amine — heat during solvent evaporation or prolonged autosampler residence accelerates this. Third, bacterial beta-glucuronidase in feces (and to a lesser extent in improperly handled plasma) hydrolyzes glucuronide conjugates. Fourth, esterase-mediated cleavage of ester prodrugs or ester-linked metabolites occurs rapidly in whole blood and more slowly in plasma — unless esterase inhibitors (dichlorvos, PMSF, NaF) are added at collection.
The test for back-conversion is straightforward: spike the pure metabolite (if available) into blank matrix at a concentration within the expected incurred range, process the sample through the full analytical method, and measure the parent drug channel. If parent drug appears at greater than 5% of the spiked metabolite concentration, back-conversion is significant and must be mitigated. Mitigation strategies include acidification (pH 2-4 for acyl glucuronides), cooling (all processing at 4°C), enzyme inhibitors (dichlorvos for esterases, 1M acetic acid for acyl glucuronide stabilization), and minimizing time from collection to extraction. Document the residual back-conversion percentage and factor it into method acceptance criteria.
In-source CID conversion is a mass spectrometer artifact: the metabolite fragments in the ion source (before Q1) to produce an ion identical to the parent drug's precursor ion. The parent MRM channel then registers signal from both actual parent and in-source converted metabolite — overestimating parent drug concentration. This is especially problematic for N-oxides (which lose oxygen in the source to regenerate the parent amine), glucuronides (which lose the glucuronic acid moiety), and sulfate conjugates. The test: infuse pure metabolite into the mass spectrometer while monitoring the parent MRM channel. If the parent channel shows greater than 1% of the metabolite channel signal, interference exists. Mitigation options include lowering the cone voltage (reduces in-source fragmentation energy), ensuring chromatographic separation of parent and metabolite (at least 0.5 min retention time difference), or using a different precursor ion adduct for one analyte.
Cross-interference in MRM channels occurs when parent and metabolite share a product ion and co-elute or nearly co-elute. This is common when the metabolite differs from the parent by a modification remote from the fragmenting bond — both produce the same charged fragment. The solution is to identify a unique (or at least preferentially abundant) product ion for each analyte. When no unique product ion exists, high-resolution mass spectrometry (Q-TOF or Orbitrap) can distinguish co-eluting species by exact mass — extraction windows of ±5 ppm around the exact precursor mass separate parent from metabolite even with shared product ions.
Phase II conjugate stability deserves dedicated attention. Acyl glucuronides are the most labile — the ester linkage between carboxylic acid and glucuronic acid undergoes pH-dependent hydrolysis (fastest at pH 7-8, slowest at pH 2-4), intramolecular acyl migration (the acyl group moves between hydroxyl positions on the glucuronic acid ring, generating positional isomers with different MS/MS spectra), and covalent protein binding (transacylation of protein lysine residues — the mechanism of acyl glucuronide-mediated immunotoxicity). Sample handling at pH 2-4 and 4°C minimizes all three. Sulfate conjugates are labile in strongly acidic conditions (stomach pH 1-2, acidic extraction solvents) — avoid prolonged exposure to pH below 3. GSH adducts themselves are stable, but GSH oxidizes rapidly to the disulfide dimer (GSSG) — the GSH trapping assay must include a reducing agent or analyze immediately.
Differential recovery between parent and metabolite is a consequence of altered polarity. A metabolite with an additional hydroxyl group is more polar — it may be poorly retained on a C18 SPE cartridge optimized for the parent drug, or it may partition differently in LLE. If using parent SIL-IS to normalize metabolite recovery, validate that recovery is consistent (±15%) at three concentrations (low, mid, high QC) in the target matrix. If recovery differs substantially, a metabolite-specific extraction method or metabolite-specific IS may be needed.
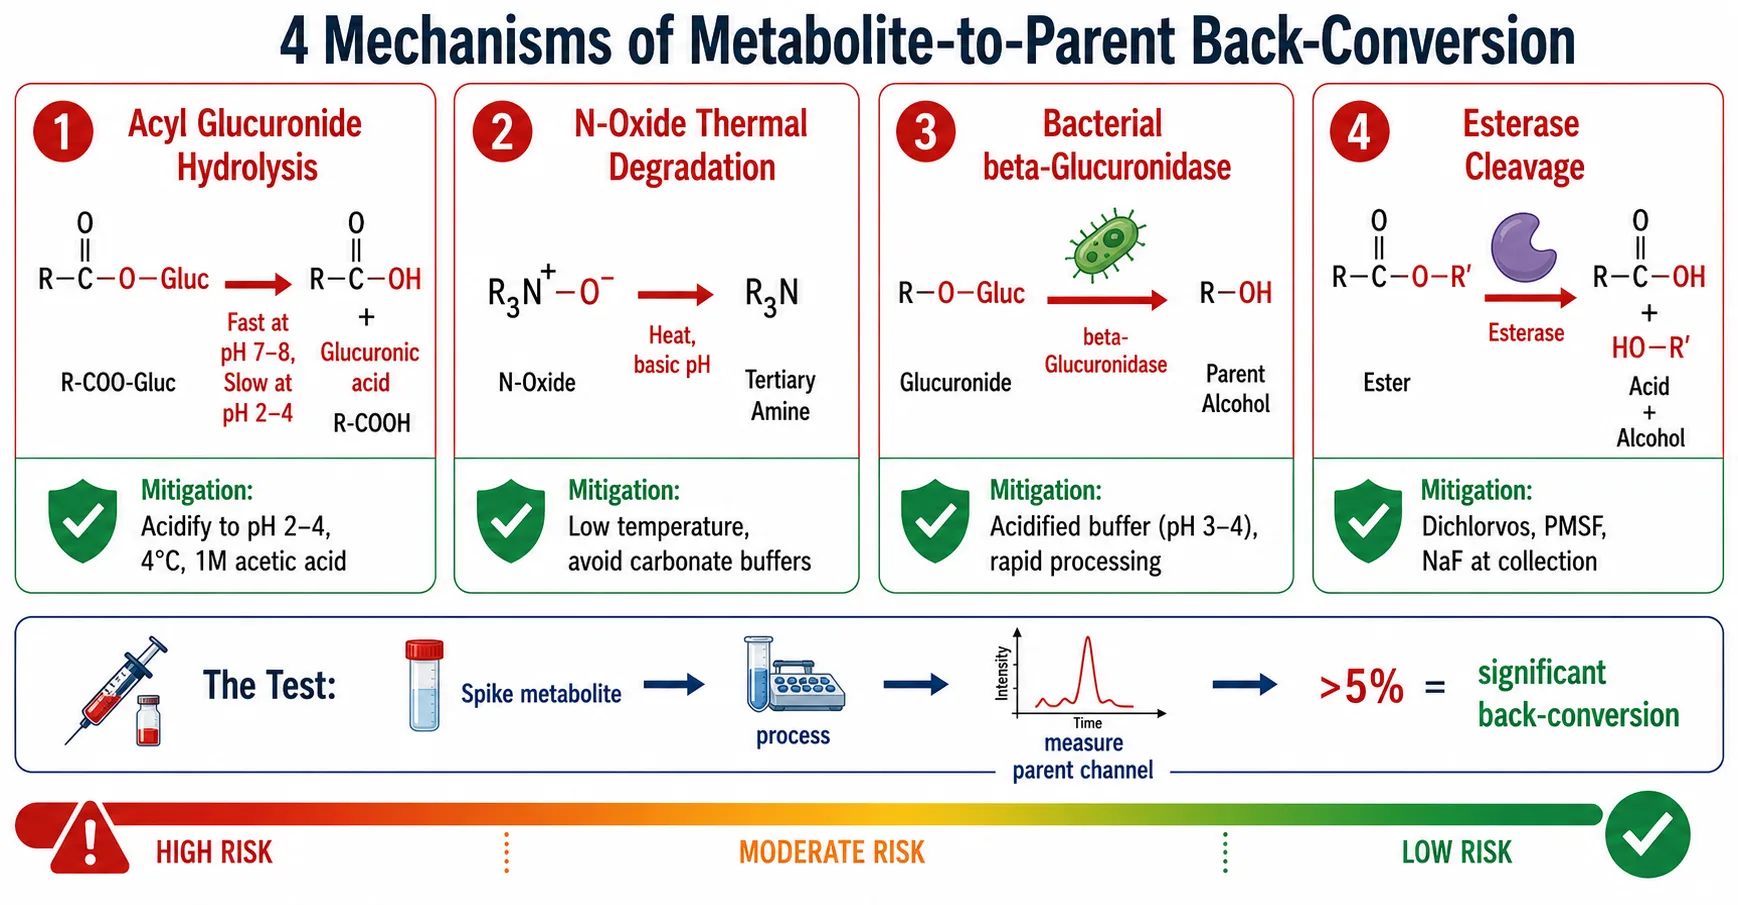 Figure 4: Metabolite-to-parent back-conversion — 4 mechanisms with pH stability ranges and inhibitor checklist
Validation of Metabolite LC-MS/MS Methods
The ICH M10 Bioanalytical Method Validation guideline applies to metabolite methods with the same rigor as parent drug methods — accuracy ±15% RE (±20% at LLOQ), precision ≤15% CV (≤20% at LLOQ), selectivity in at least six individual matrix lots, and full stability characterization. The difference is that many metabolite methods begin life as "qualified" rather than "fully validated" methods, and the distinction matters.
A fully validated metabolite method requires an authentic reference standard of known purity. Accuracy and precision are established by analyzing QC samples prepared from the metabolite standard at known concentrations, exactly as for the parent drug. Linearity, matrix effect (IS-normalized), recovery, dilution integrity, carryover, and stability are assessed with the same acceptance criteria. This is the standard for regulatory (IND/NDA) submissions and for any metabolite that triggers the MIST threshold.
A qualified method is used when no metabolite standard is available — which is the majority of discovery and early preclinical metabolite work. In a qualified method, calibration is based on the parent drug response factor: metabolite concentration is reported as "parent-equivalent concentration" or "metabolite-to-parent peak area ratio." The critical caveat — stated explicitly in every report — is that different ionization efficiencies between parent and metabolite mean that "parent-equivalent" is not the true concentration. For metabolites that ionize more efficiently than the parent (common with basic amine metabolites), parent-equivalent concentration overestimates true concentration. For metabolites that ionize less efficiently (common with sulfate and glucuronide conjugates), it underestimates.
Cross-validation is required when upgrading from a qualified to a fully validated method — once the metabolite standard has been synthesized and characterized. Analyze at least six incurred study samples by both the qualified method (parent calibration) and the validated method (metabolite calibration). The cross-validation acceptance criterion is that at least 67% of the paired results agree within ±20%. If the qualified method systematically over- or under-estimates relative to the validated method, a correction factor can be derived — but this must be prospectively defined and validated, not retroactively applied.
Stability assessment for metabolites goes beyond the standard freeze-thaw and bench-top panels. Acyl glucuronide stability must be tested at pH 2-4 (acidified condition) and pH 7.4 (physiological) to establish acceptable processing pH and time windows. Metabolite stability in the presence of enzymes present in the matrix — esterases in whole blood, beta-glucuronidase in feces and some plasma samples, sulfatases in tissue — must be evaluated using inhibitor-treated vs untreated matrix. Stock solution stability of metabolite standards is often more limited than parent stocks — metabolites with reactive functional groups (thiols, catechols, quinones) may degrade in solution within hours unless protected (antioxidants, chelating agents, low pH).
Metabolite LLOQ requirements depend on the question. For MIST assessment, the LLOQ must be low enough to reliably quantify the metabolite at 10% of the parent Cmax or AUC — if the parent Cmax is 1,000 ng/mL, the metabolite LLOQ must be at most 100 ng/mL, and practically 10-50 ng/mL to quantify below the threshold with confidence. For active metabolite assessment, the LLOQ must capture the metabolite at pharmacologically relevant concentrations — which may be lower than the parent if the metabolite is more potent. For prodrug activation monitoring, both the prodrug and active metabolite require validated methods across the full concentration range observed in vivo.
Quantitative Metabolite Profiling in Discovery
In discovery, the question is not "what is the exact concentration of metabolite M23?" but "which metabolites are formed, in what rank order, and is there a metabolite that warrants a closer look?" This is the domain of semi-quantitative metabolite profiling.
The workflow begins with an in vitro incubation of the test compound at a clinically relevant concentration (1-10 uM) with hepatocytes — the most complete in vitro metabolic system. Timepoints span 0 to 240 minutes to capture both formation and secondary metabolism. The quenched supernatant is analyzed by UHPLC coupled to high-resolution mass spectrometry (HRMS) in full-scan mode, acquiring data across m/z 100-1200 with polarity switching. Data processing uses metabolite identification software — Metabolynx (Waters), MassMetaSite (Molecular Discovery), or Compound Discoverer (Thermo) — with mass defect filtering, background subtraction against a no-cofactor control, and biotransformation list matching.
The output is a "metabolite profile": a table listing each detected metabolite by retention time, [M+H]+ (or [M-H]-), mass shift from parent, proposed biotransformation, major MS2 fragments, and peak area. Metabolites are ranked by peak area as a percentage of total drug-related material (parent + sum of metabolites). The peak area ratio (PAR) method calculates each metabolite's relative abundance: metabolite peak area / (parent peak area + sum of all metabolite peak areas) x 100. This assumes equal MS response across all species — an assumption that is demonstrably false but acceptable for rank-ordering within a chemical series where all analogs share the same core structure and similar ionization properties.
The PAR method answers the key discovery questions: what is the major metabolite? Does a reactive metabolite appear (GSH adduct detected)? Are there disproportionate metabolites in human vs rat hepatocytes? Is the metabolic profile consistent across the chemical series, or does this compound have unusual liability? These answers, derived without a single authentic metabolite standard, guide the medicinal chemistry strategy — which position to block, which series to advance.
CAD (charged aerosol detection) offers an alternative for semi-quantitative work without standards. CAD response is proportional to the mass of nonvolatile analyte, independent of chemical structure — unlike UV (chromophore-dependent) and MS (ionization-dependent). For metabolites, CAD provides structure-independent quantification using the parent drug as a single calibrant. The limitation is specificity: CAD cannot distinguish co-eluting peaks and has a higher LOD than MRM (typically 0.5-1 ng on-column vs 1-10 pg for MRM). Its best application is alongside MS detection — MS confirms peak identity, CAD provides concentration estimate.
The decision of when to invest in an authentic metabolite standard is fundamentally a risk-management calculation. A custom metabolite standard — either chemically synthesized or biosynthesized using recombinant enzymes or microbial systems — costs $5,000-20,000 and takes 4-12 weeks. A metabolite-specific safety study for a MIST-triggering metabolite — including GLP toxicology with the synthesized metabolite — costs $50,000-200,000+ and delays the program by months. Identifying the MIST concern early, synthesizing the standard, and quantifying the metabolite prospectively costs less and delays less than discovering the problem in the 28-day tox study or, worse, in the Phase I human ADME study. When a metabolite exceeds 10% of total drug-related material in human in vitro systems and is absent or minor (<5%) in rat and dog — invest in the standard immediately.
Common Pitfalls in Metabolite Quantification
The first pitfall is assuming the parent SIL-IS corrects for metabolite response. The parent SIL-IS is a different molecule with different ionization efficiency. If the metabolite ionizes 3-fold more efficiently than the parent, a 50 ng/mL true concentration reads as 150 ng/mL parent-equivalent — a 200% overestimate. Always verify relative response by post-column infusion: infuse the metabolite (from in vitro incubation or synthetic standard) post-column while the parent SIL-IS is infused pre-column. The ratio of metabolite peak area to parent SIL-IS area, compared to the same ratio for the parent drug, gives the relative response factor. If the ratio differs by more than 2-fold, parent-equivalent concentrations are unreliable.
The second pitfall is missing the major metabolite because you are only looking for what you expect. MRM methods for "known metabolites" based on in silico prediction or prior literature will miss unexpected biotransformations — uncommon oxidations (aldehyde oxidase, MAO), gut microbial metabolites, or non-enzymatic degradation products. Every metabolite quantification study should include at least one full-scan HRMS injection per species and matrix to confirm the expected metabolite profile is complete. A metabolite that is not identified cannot be quantified, and an unquantified major metabolite is the most common MIST audit finding.
The third pitfall is back-conversion during storage. A plasma sample collected for metabolite analysis, thawed, aliquoted, and left on the bench for two hours before extraction has undergone unknown and uncontrolled metabolite degradation. The measured metabolite-to-parent ratio is artifactually low, and the parent concentration is artifactually high. If the metabolite is a MIST-trigger, this error can make a >10% metabolite appear as a <10% metabolite — the regulatory equivalent of a false negative. Always validate freeze-thaw and bench-top stability for both parent AND metabolite, and include stability QC samples (stored identically to study samples) in every analytical run.
The fourth pitfall is sampling at the wrong time. Metabolites are formed after the parent drug — their Tmax is later than the parent Tmax. If a tissue distribution study for metabolites collects samples only at the parent Tmax, metabolite concentrations are underestimated. Metabolite PK should cover the full time course, or at minimum, include a late timepoint (3-5x parent Tmax) to capture metabolite Cmax.
The fifth pitfall is ignoring matrix-specific metabolite profiles. The metabolites circulating in plasma are a subset of all metabolites formed — highly polar metabolites and those actively transported into urine or bile may never reach meaningful plasma concentrations. Liver-first-pass metabolites may appear in the portal vein and bile but not in systemic plasma. A complete metabolite picture requires multiple matrices: plasma for systemic exposure, urine for renally cleared metabolites, bile for hepatobiliary metabolites, and feces for unabsorbed drug and gut microbial metabolites. When possible, include tissue from target organs — the metabolite concentration in the tissue that matters (e.g., liver for hepatotoxicity) may not be predictable from plasma alone.
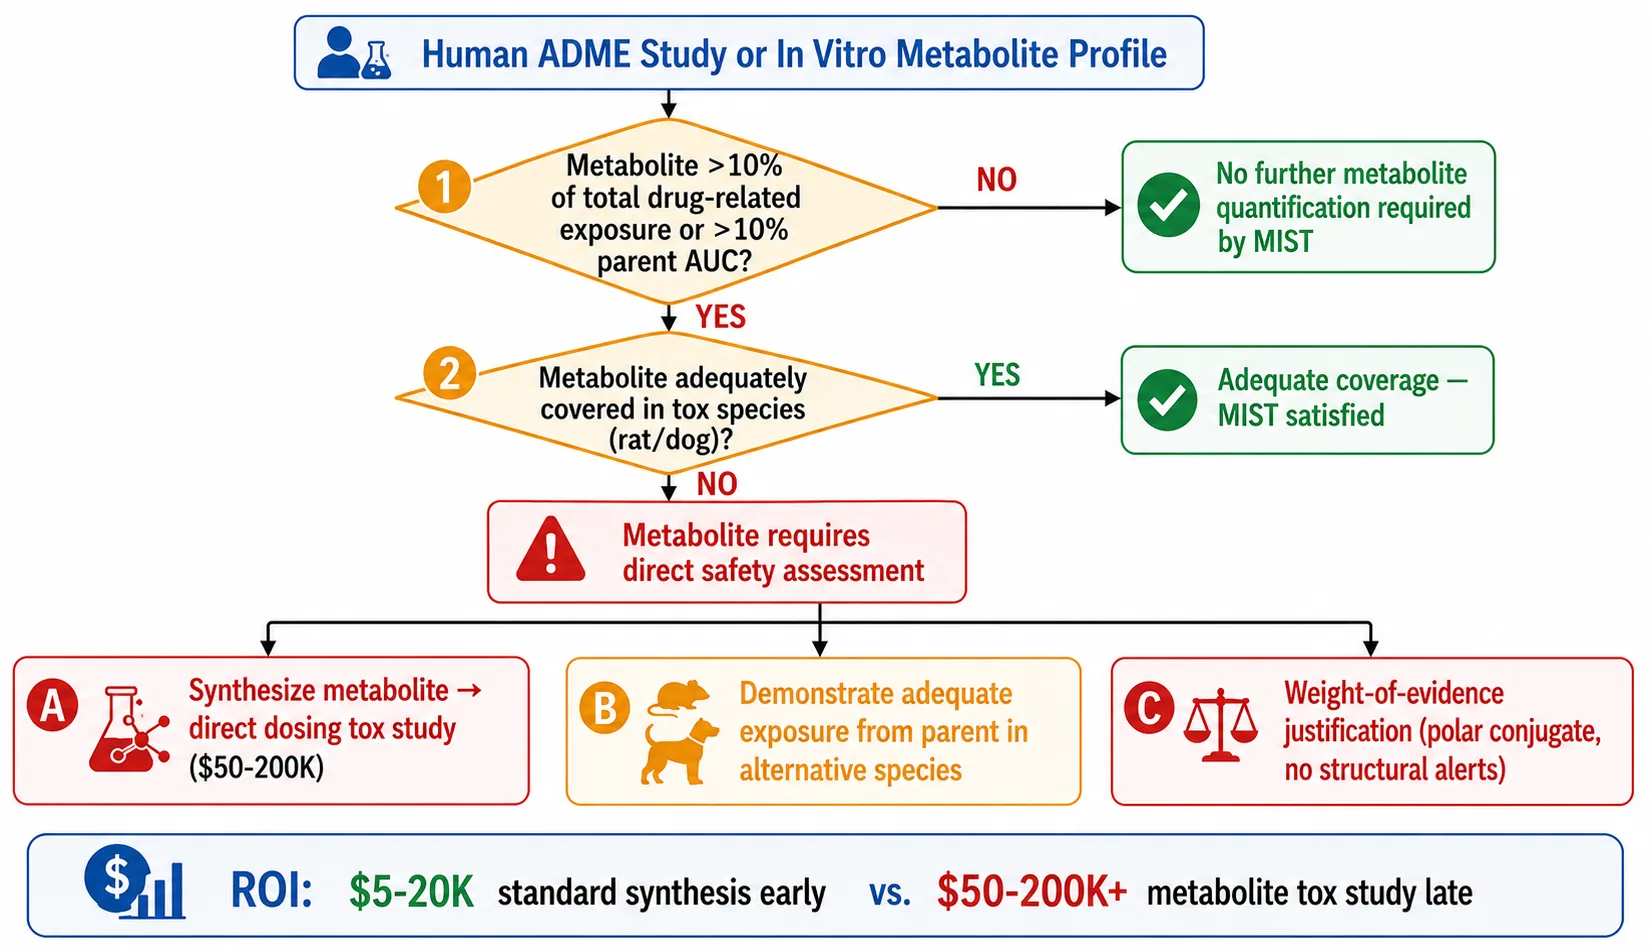 Figure 5: MIST guidance decision tree — when to trigger full metabolite quantification vs semi-quantitative profiling
Frequently Asked Questions
Do I need a separate validated method for each metabolite, or can I add metabolites to the parent drug method?
You can add metabolites to the parent drug method if they are chromatographically resolved and do not interfere with parent or other metabolite MRM channels. This is common practice — a single LC-MS/MS method can simultaneously quantify the parent drug and 3-5 metabolites. Each metabolite requires its own MRM transitions (optimized if standard available, predicted if not), its own calibration curve (authentic standard or parent-equivalent), and its own QC samples. Validation must demonstrate selectivity across all channels, no cross-interference, and acceptable accuracy/precision for each analyte independently. The practical limit is determined by dwell time per transition — with typical dwell times of 20-50 ms, a method can accommodate 20-30 transitions while maintaining at least 12-15 data points across a chromatographic peak.
How do I quantify a metabolite without an authentic reference standard?
Three approaches, in order of decreasing accuracy. (1) Biosynthesize an enriched metabolite sample from an in vitro incubation (high concentration parent + hepatocytes or microsomes, extended incubation), verify the metabolite by HRMS, quantify the metabolite concentration in the enriched sample by qNMR or by assuming complete conversion from a known parent starting concentration, and use this as a secondary standard. Accuracy: ±20-30% if carefully executed. (2) Use the parent drug as a surrogate calibrator and report results as "parent-equivalent concentration." Accuracy: ±50-200% depending on ionization efficiency differences. Acceptable for discovery but not for regulatory. (3) Use HRMS-based relative quantification — report metabolite peak area as a percentage of total drug-related peak area (parent + metabolites). No absolute concentration — purely relative. Acceptable for rank-ordering across compounds or species.
What is the difference between a qualified and a fully validated metabolite method?
A fully validated method uses an authentic metabolite reference standard of known purity and meets all ICH M10 acceptance criteria (accuracy ±15% RE, precision ≤15% CV, full stability, selectivity, etc.). A qualified method does not use a metabolite standard — calibration is based on the parent drug (parent-equivalent units) — and is suitable for discovery and early preclinical studies where the purpose is relative comparison rather than absolute accuracy. The key operational difference: a fully validated method can support regulatory submissions (IND, NDA, MIST assessment); a qualified method cannot. When a metabolite triggers the MIST threshold in a qualified method, upgrade to a fully validated method by synthesizing the metabolite standard.
At what metabolite-to-parent ratio does the MIST guidance trigger?
The FDA MIST guidance uses 10% of total drug-related exposure (AUC) as the threshold. If a metabolite AUC exceeds 10% of (parent AUC + sum of all metabolite AUC) in humans, the metabolite is considered "disproportionate" and requires safety coverage in tox species. A metabolite at 10% of parent AUC alone also triggers concern. Practically, this means if parent Cmax is 1,000 ng/mL, a metabolite at 100 ng/mL (10% of Cmax) or at 10% of parent AUC triggers the guidance. The threshold is not an absolute regulatory requirement but a recommendation — however, the FDA consistently expects sponsors to address MIST for metabolites above 10%, and the question is raised in most IND reviews.
Can I use the parent drug's calibration curve for metabolite semi-quantification?
Yes, but with four mandatory caveats. (1) The MS response factor of the metabolite relative to the parent must be stated — either determined (if metabolite standard available) or acknowledged as unknown (if not). (2) Results must be reported as "parent-equivalent concentration" or "semi-quantitative," not as absolute concentration. (3) The method must be designated as "qualified" not "validated" in the bioanalytical report. (4) Any conclusions drawn from the data (e.g., "metabolite does not exceed 10% of parent AUC") must be qualified with the uncertainty range. If the parent-equivalent concentration suggests the metabolite is near the MIST threshold, invest in an authentic standard for definitive quantification.
How do I prevent acyl glucuronide hydrolysis during sample collection?
Four measures. (1) Acidify the collection tube or plasma immediately after separation — add formic acid to achieve pH 2-4 (typically 10-20 uL of concentrated formic acid per mL plasma). (2) Cool immediately — place samples on wet ice (4°C) or in a refrigerated centrifuge (4°C) for plasma separation. (3) Process rapidly — from collection to extraction, target under 30 minutes at 4°C. Do not leave samples on the bench at room temperature. (4) Add 1M acetic acid (5% v/v) to plasma as a stabilization agent. For long-term storage, store plasma at -80°C at pH 2-4. At analysis, thaw on ice and extract immediately. For urine, acidify to pH 3-4 with formic acid. For feces, homogenize with acidified buffer (pH 3-4) to inhibit bacterial beta-glucuronidase.
References
- U.S. FDA. Guidance for Industry: Safety Testing of Drug Metabolites. 2020.
- ICH. M10 Bioanalytical Method Validation and Study Sample Analysis. 2022.
- Ahlqvist M, Karlsson IB, Ekdahl A, Ericsson C, Jurva U, Miljkovic F, Chen Y, Winiwarter S. Metabolite Identification Data in Drug Discovery, Part 1: Data Generation and Trend Analysis. Mol Pharm. 2025;22(10):5055-5069.
- Regan SL, Maggs JL, Hammond TG, Lambert C, Williams DP, Park BK. Acyl glucuronides: the good, the bad and the ugly. Biopharm Drug Dispos. 2010;31(7):367-395.
- Park BK, Boobis A, Clarke S, Goldring CEP, Jones D, Kenna JG, Lambert C, Laverty HG, Naisbitt DJ, Nelson S, Nicoll-Griffith DA, Obach RS, Routledge P, Smith DA, Tweedie DJ, Vermeulen N, Williams DP, Wilson ID, Baillie TA. Managing the challenge of chemically reactive metabolites in drug development. Nat Rev Drug Discov. 2011;10(4):292-306.
- Matuszewski BK, Constanzer ML, Chavez-Eng CM. Strategies for the assessment of matrix effect in quantitative bioanalytical methods based on HPLC-MS/MS. Anal Chem. 2003;75(13):3019-3030.
- Luffer-Atlas D. Unique/major human metabolites: why, how, and when to test for safety in animals. Drug Metab Rev. 2008;40(3):447-463.
- Timmerman P, Kall MA, Gordon B, Laakso S, Freisleben A, Hucker R. Best practices in a tiered approach to metabolite quantification: views and recommendations of the European Bioanalysis Forum. Bioanalysis. 2010;2(7):1185-1194.
- Evans DC, Watt AP, Nicoll-Griffith DA, Baillie TA. Drug-protein adducts: an industry perspective on minimizing the potential for drug bioactivation in drug discovery and development. Chem Res Toxicol. 2004;17(1):3-16.
- Timmerman P, Blech S, White S, Green M, Delatour C, McDougall S, Mannens G, Smeraglia J, Williams S, Young G. Best practices for metabolite quantification in drug development: updated recommendations from the European Bioanalysis Forum. Bioanalysis. 2016;8(12):1297-1305.
Disclaimer: All services and resources mentioned on this site are for research use only (RUO) and are not intended for diagnostic, therapeutic, or clinical applications.
Related Services


