What Is MetID and Where Does It Fit in Drug Discovery?
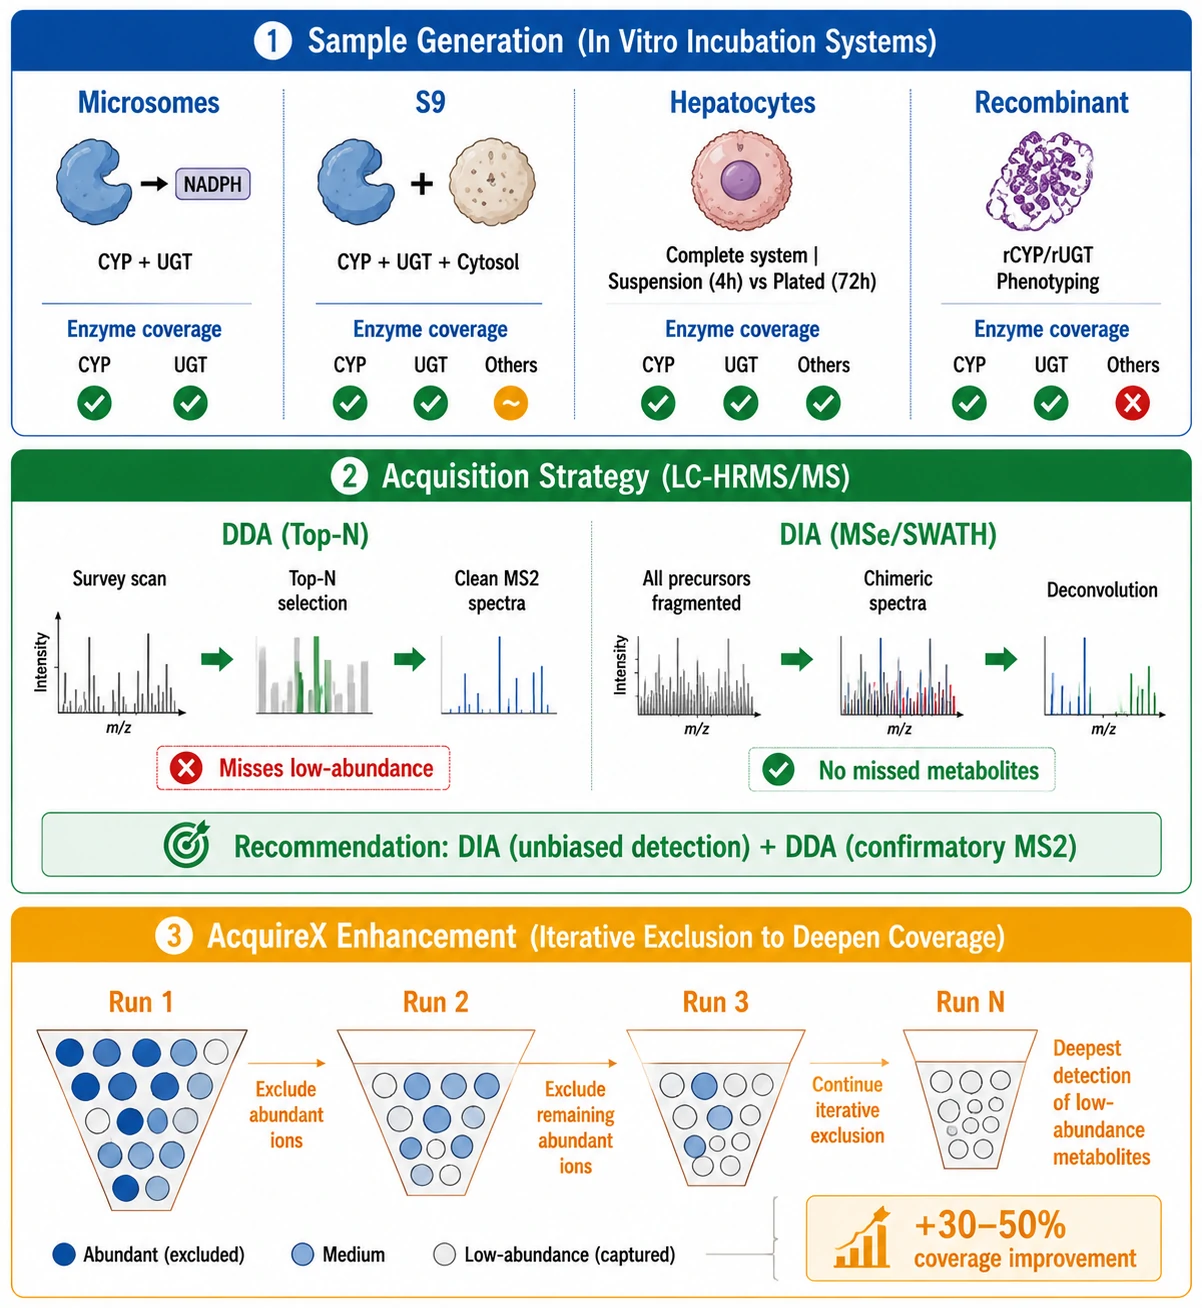 Figure 1: MetID experimental workflow — incubation systems comparison (microsomes/S9/hepatocytes/recombinant) to LC-HRMS acquisition (DDA vs DIA)
Metabolite identification — MetID — is the analytical process of detecting, characterizing, and structurally elucidating drug biotransformation products. It answers four questions: What metabolites are formed? Where on the molecule does the modification occur? By which enzymes? And in which species? Unlike drug metabolite quantification, which asks "how much?", MetID asks "what is it?" — and the answer shapes decisions from lead optimization through IND filing.
MetID occupies a defined position in the DMPK pipeline. During lead optimization, MetID identifies metabolic soft spots — positions on the molecule vulnerable to enzymatic modification — and guides medicinal chemistry toward more stable analogs. During candidate selection, MetID compares metabolite profiles across preclinical species and predicts human metabolites, flagging compounds with disproportionate or unique human metabolism. During IND-enabling studies, MetID provides the structural basis for MIST (Metabolites in Safety Testing) assessment: you cannot determine whether a human metabolite is adequately covered in tox species unless you know what that metabolite is. And during clinical development, MetID characterizes circulating metabolites to confirm that the preclinical tox species were indeed exposed to all major human metabolites.
MetID is the structural foundation for downstream DMPK activities. Drug metabolite quantification measures metabolite concentrations, but only after MetID has established what needs to be measured. Downstream metabolite tracking maps sequential biotransformation cascades, but every pathway arrow starts from a metabolite that MetID has characterized. And parent drug quantification by LC-MS/MS provides the baseline — the parent's MRM behavior, MS2 fragmentation pattern, and chromatographic retention serve as the reference frame for every metabolite identified. The 2026 MetID toolkit can generate 'omics-scale metabolite profiles from a single LC-HRMS injection, but the fundamental challenge has not changed: confident structural assignment still requires MS2 spectral interpretation by an experienced analyst. Software proposes candidates; the analyst decides which are real.
Generating MetID Data: In Vitro and In Vivo Systems
The quality of MetID data begins with the quality of the sample. A poorly designed incubation or a single-timepoint in vivo collection will miss major metabolites, and no amount of sophisticated data processing can recover metabolites that were never generated in the first place.
In vitro incubations are the workhorse of discovery MetID. Liver microsomes, supplemented with NADPH and UDPGA, provide CYP and UGT enzyme activity in a simple, reproducible system — ideal for high-throughput screening and CYP reaction phenotyping — but miss cytosolic enzymes (aldehyde oxidase, sulfotransferases) and transporter-mediated clearance. S9 fraction contains both microsomes and cytosol for broader enzyme coverage. Hepatocytes, in suspension (4-6 hours) or plated (up to 72 hours for low-turnover compounds), represent the most complete in vitro metabolic system. Recombinant enzymes (rCYP, rUGT) are used for reaction phenotyping, not comprehensive MetID.
The Ahlqvist et al. 2025 dataset — the largest publicly available MetID dataset, analyzing 120 AstraZeneca compounds in human hepatocytes — provides a benchmark. Key findings: compounds averaged 3-8 metabolites each; oxidation dominated Phase I (50-60%), followed by N-dealkylation (15-20%); glucuronidation was the most common Phase II pathway; and in vitro-to-in vivo correlation was compound-dependent — hepatocyte MetID predicted plasma metabolites poorly for high-clearance drugs, where elimination rate exceeds formation rate.
Incubation design: substrate at 1-10 uM (therapeutic free plasma concentrations), timepoints from 0 to 240 minutes, controls including no-NADPH and boiled-enzyme, and a positive control such as verapamil. Supra-pharmacological concentrations (50-100 uM) may saturate high-affinity pathways and exaggerate low-affinity ones, distorting the metabolite profile.
In vivo, each matrix reveals a different window. Plasma contains circulating metabolites. Urine concentrates renally cleared metabolites 10-1,000 fold and is enriched in Phase II conjugates. Bile captures hepatobiliary metabolites. Feces contains unabsorbed drug and gut microbiome metabolites. Liver-first-pass metabolites may appear in portal vein and bile but never reach systemic plasma at meaningful concentrations — a metabolite abundant in urine may be undetectable in plasma.
The MS acquisition strategy determines what is detected. Data-dependent acquisition (DDA, top-N) provides clean MS2 spectra ideal for structural elucidation but biases toward abundant metabolites. Data-independent acquisition (DIA, MSe/SWATH) fragments all precursors without pre-selection, ensuring no metabolite is missed, but produces complex chimeric spectra. The recommended strategy: one DIA injection for unbiased detection, followed by confirmatory DDA injections. Intelligent background exclusion (AcquireX) improves DDA coverage 30-50% by funneling MS2 time toward lower-abundance drug-related peaks.
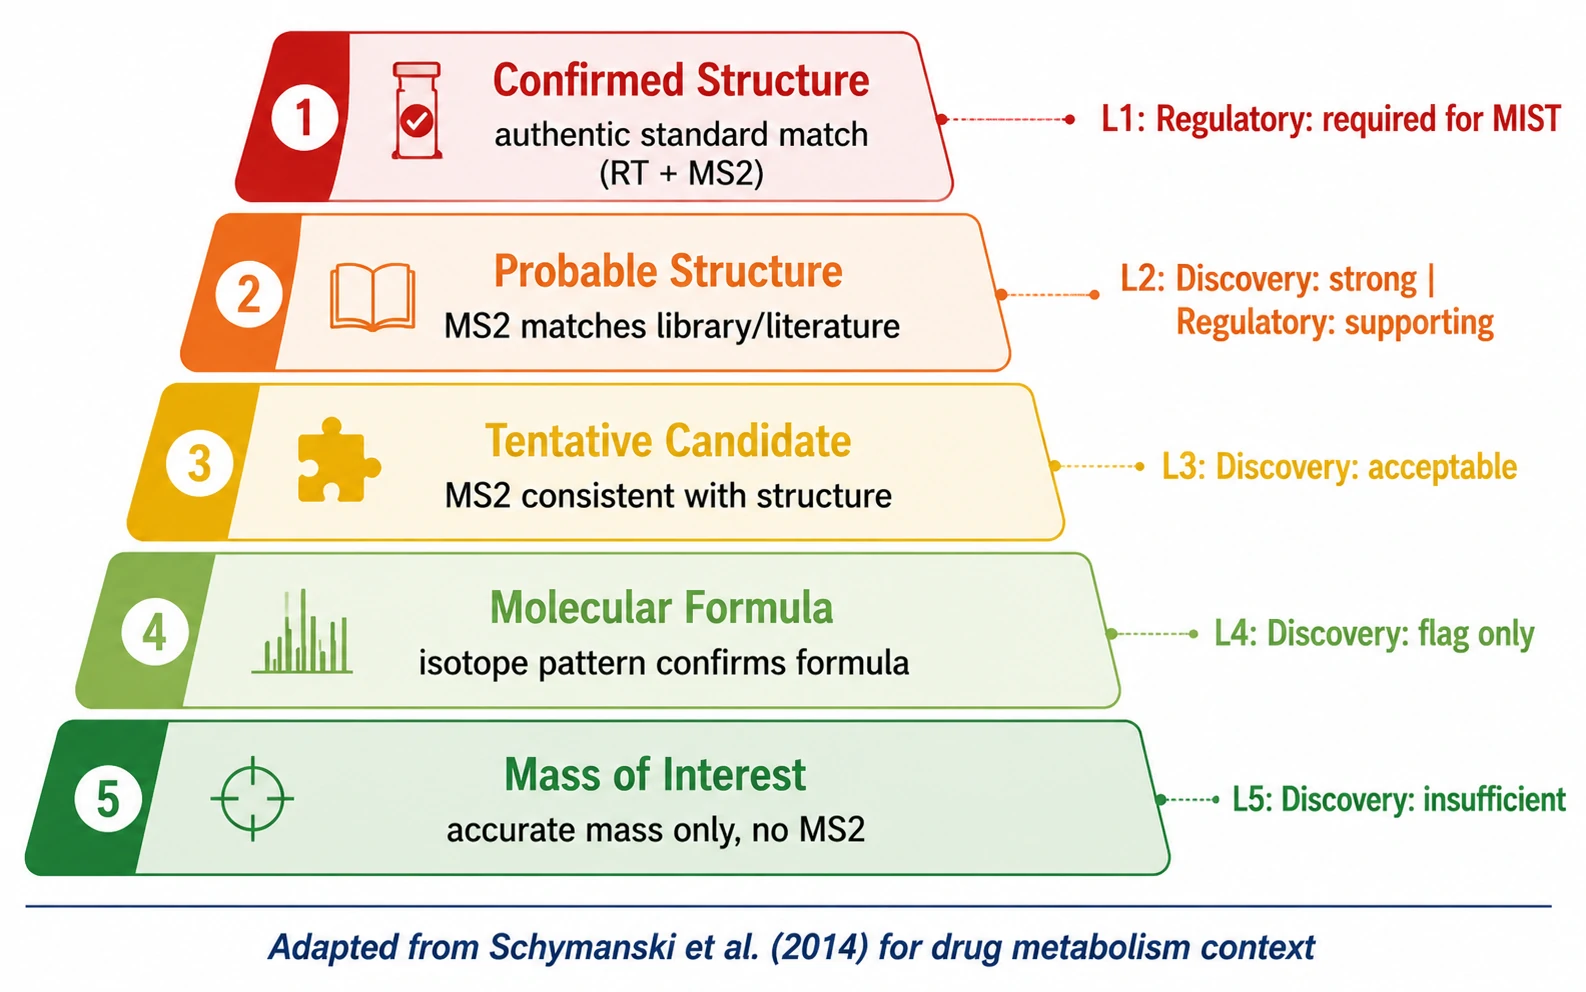 Figure 2: Five-level metabolite identification confidence scale (Level 1-5) with analytical data requirements for each level
LC-HRMS Data Processing for Metabolite Detection
The raw data file from a 60-minute LC-HRMS run contains thousands of features — ions defined by retention time and accurate mass. The overwhelming majority are endogenous matrix components, not drug metabolites. The data processing challenge is to filter this haystack down to the drug-related needles.
Mass defect filtering (MDF) is the first and most powerful filter. All drug metabolites retain a similar mass defect — the fractional component of accurate mass — because they share the parent's core elemental composition. A drug with mass defect +0.1500 Da will produce metabolites within approximately ±50 mDa of that value, while most endogenous matrix ions fall outside this window. MDF typically removes ∼90% of matrix ions, dramatically enriching for drug-related material.
Background subtraction processes the control sample through the same pipeline, removing features common to both control and drug-containing samples. Biotransformation list matching predicts all theoretically possible metabolites from the drug structure plus common mass shifts. Phase I: +O (+15.9949 Da), -CH3 (-14.0157 Da), +2O (+31.9898 Da), -C2H4 (-28.0313 Da). Phase II: +glucuronide (+176.0321 Da), +sulfate (+79.9568 Da), +glutathione (+305.0682 Da), +acetyl (+42.0106 Da), +glycine (+57.0215 Da). The software extracts ion chromatograms at each predicted mass, flags peaks with drug-like LC peak shapes, and ranks candidates. The limitation: list matching only finds what you predict — unusual or non-enzymatic metabolites are invisible.
The 2026 software landscape offers multiple platforms. MassMetaSite (Molecular Discovery) is the industry standard: peak detection, background subtraction, biotransformation matching, MS2 interpretation, and site-of-metabolism probability scoring in batch workflow. Compound Discoverer (Thermo) integrates with Orbitrap platforms, offering FISh scoring and isotope pattern confirmation. Metabolynx (Waters) combines MDF, biotransformation matching, and fragment correlation for Q-TOF MSe data. MetabolitePilot (SCIEX) leverages IDA with parallel data mining algorithms. On the open-source side, GNPS2 enables molecular networking without prior drug knowledge, and BioTransformer 3.0 provides free in silico prediction. Best practice: one commercial platform for primary processing, GNPS2 as orthogonal validation.
Structural Elucidation: From Candidate Peak to Confirmed Metabolite
A candidate metabolite peak — a feature with the correct accurate mass, mass defect, and a plausible retention time — is a hypothesis, not a result. Structural elucidation transforms that hypothesis into a confirmed or refuted structural assignment.
MS2 fragmentation is the primary tool for structural elucidation, following a systematic five-step workflow. (1) Identify the precursor mass and charge state from the isotope pattern. (2) Calculate the mass shift from parent — +15.9949 suggests oxidation, +176.0321 suggests glucuronidation. (3) Propose biotransformations consistent with the mass shift — if glucuronidation, is it O-glucuronide, N-glucuronide, or acyl glucuronide? (4) Analyze MS2 fragments: conserved fragments indicate unmodified regions; shifted fragments localize the modification site. (5) Assign the site: if the parent produces m/z 295 and the metabolite produces m/z 311 (+16), oxidation occurred within that fragment.
Diagnostic neutral losses provide rapid structural classification: 176 Da (glucuronide, loss of dehydroglucuronic acid), 80 Da (sulfate, loss of SO3), 129 Da (GSH adduct, gamma-glutamyl loss), 44 Da (CO2, carboxylic acid), 18 Da (H2O, aliphatic alcohol). These are monitored via dedicated NLS or extracted from DIA data post-acquisition.
Electron-activated dissociation (EAD) on the ZenoTOF platform addresses a critical CID limitation: CID preferentially cleaves labile bonds (ester linkages in acyl glucuronides, N-O bonds in N-oxides, sulfate esters), destroying the structural information needed to localize the modification. EAD preserves these bonds, revealing the attachment site — essential for distinguishing glucuronide positional isomers (O-glucuronide, N-glucuronide, acyl glucuronide) that share the same exact mass but differ in chemical stability and toxicological significance.
The Metabolite Identification Confidence Scale, adapted from Schymanski et al., provides standardized language for structural certainty. Level 1 — Confirmed: matches authentic reference standard in retention time and MS2 spectrum (gold standard, required for regulatory MIST assessment). Level 2 — Probable: MS2 matches published library or literature, retention time consistent with proposed structure. Level 3 — Tentative: MS2 fragments consistent with proposed structure, no reference standard or library match. Level 4 — Molecular Formula: accurate mass and isotope pattern provide unique formula, but exact structure unknown. Level 5 — Mass of Interest: plausible accurate mass, no MS2 data. Most discovery MetID operates at Levels 2-3; regulatory MetID requires Level 1 for key metabolites.
When MS cannot distinguish regioisomers — same formula and MS2, different substitution positions — NMR provides definitive resolution. Hypha Discovery's integrated LC-MS/MS plus cryoprobe NMR workflow enables structural elucidation from sub-microgram quantities using 700 MHz NMR with a 1.7 mm cryoprobe after micropreparative LC collection. This is practical for major metabolites where structural ambiguity blocks critical decisions.
Reactive Metabolite Detection and Structural Alerts
Reactive metabolites are the dark side of drug metabolism. They are transient, electrophilic species that covalently bind to proteins, forming drug-protein adducts that can act as haptens — triggering immune-mediated idiosyncratic toxicity manifesting as hepatotoxicity, skin reactions (Stevens-Johnson syndrome), or agranulocytosis. Drug withdrawals and black box warnings linked to reactive metabolites — troglitazone (hepatotoxicity), lumiracoxib (hepatotoxicity), nefazodone (hepatotoxicity), felbamate (aplastic anemia) — have embedded reactive metabolite screening firmly in the discovery MetID workflow.
The GSH trapping assay is the primary reactive metabolite screen. The test compound is incubated with liver microsomes, NADPH, and a 1:1 mixture of unlabeled and stable isotope-labeled GSH (13C2,15N-GSH). If a reactive metabolite forms, it is trapped as a GSH adduct appearing as a diagnostic 3-Da doublet in the mass spectrum — unique to drug-GSH adducts and unambiguous even in complex matrices. Clozapine (nitrenium ion former) serves as positive control. Results are reported semi-quantitatively as GSH adduct peak area relative to parent.
Cyanide trapping complements GSH trapping for harder electrophiles. GSH (soft thiol nucleophile) reacts with Michael acceptors, epoxides, and quinones; cyanide (hard nucleophile) traps iminium ions from N-dealkylation. The cyanide assay uses potassium cyanide (1 mM) in the microsomal incubation, with CN-adducts detected by neutral loss of 27 Da (HCN). A compound negative in GSH trapping may be positive in cyanide trapping — the two assays are complementary, not redundant.
Common structural alerts guide medicinal chemistry away from problematic chemotypes. Anilines form nitrenium ions via CYP oxidation — highly electrophilic, DNA/protein-reactive. Hydrazines can be directly alkylating. Thiophenes undergo S-oxidation to electrophilic epoxides that ring-open to reactive carbonyls. Furans epoxidize to unsaturated dialdehydes. Quinones undergo redox cycling plus Michael addition to protein thiols. Kalgutkar et al. catalogue over 100 functional groups associated with bioactivation.
MetID-driven de-risking follows a defined cycle: (1) identify the metabolic soft spot producing the reactive intermediate; (2) block metabolism through structural modification — fluorination, cyclopropylation, heteroatom substitution, or ring replacement (thiazole for thiophene); (3) verify reduced GSH adduct formation while maintaining potency; (4) confirm metabolic stability. A documented case: replacing thiophene with thiazole in a lead series eliminated GSH adduct formation entirely while preserving potency.
Species Comparison and Human Metabolite Prediction
Species differences in drug metabolism are the norm, not the exception. CYP isoform expression differs: rat CYP2C11 has no direct human ortholog; human CYP2C9 metabolizes acidic drugs that rat CYP2C enzymes handle differently. UGT isoform expression varies — rodent hepatic UGT1A1 expression exceeds human, leading to more extensive glucuronidation in rats for some substrates. Aldehyde oxidase (AO) expression is high in human liver, very low in dog, and functionally absent in rat — an AO-generated metabolite may be major in human but entirely absent in both standard tox species. A metabolite observed at 25% of total drug-related material in human hepatocytes may be present at 2% in rat and undetectable in dog — a textbook MIST concern.
In vitro cross-species MetID is the standard approach for predicting human metabolite profiles and assessing tox species coverage. The compound is incubated with hepatocytes from rat, dog, monkey, and human, under identical conditions (same concentration, same timepoints, same analytical method). Metabolite profiles are compared qualitatively (presence or absence in each species) and semi-quantitatively (peak area rank order within each species). Metabolites are categorized as shared (present in human plus at least one tox species), unique human (present in human, absent in both rat and dog), or disproportionate (present in all species but >2-fold higher in human by peak area). Unique human metabolites exceeding 10% of total drug-related material in human hepatocytes are the primary MIST risk — they require either direct safety testing via synthesized metabolite dosing or demonstration of adequate exposure from parent drug metabolism in an alternative tox species.
The species coverage concept is central to MIST compliance: tox species must be exposed to all human metabolites exceeding 10% of total drug-related exposure. For unique human metabolites, three options exist: (A) synthesize the metabolite for direct tox study dosing ($50,000-200,000+); (B) demonstrate adequate exposure from parent metabolism in an alternative species; (C) weight-of-evidence justification — applicable for polar Phase II conjugates with no structural alerts and rapid renal clearance.
In vivo verification closes the loop: plasma, urine, bile, and feces from tox species PK studies are profiled by HRMS and compared against the in vitro hepatocyte profile. Calibrating in vitro-to-in vivo prediction accuracy for each chemotype builds confidence that negative in vitro MetID results are genuinely negative.
In silico tools provide an orthogonal layer. BioTransformer 3.0 combines rule-based expert knowledge with ML models for CYP, UGT, and gut microbial metabolism. SMARTCyp predicts CYP site-of-metabolism from atomic reactivity and steric accessibility. XenoSite uses deep learning trained on CYP substrates. Best practice: run three different tools — where all three predict the same metabolite, prioritize that transition for MRM development. Where they disagree, trust experimental MetID data.
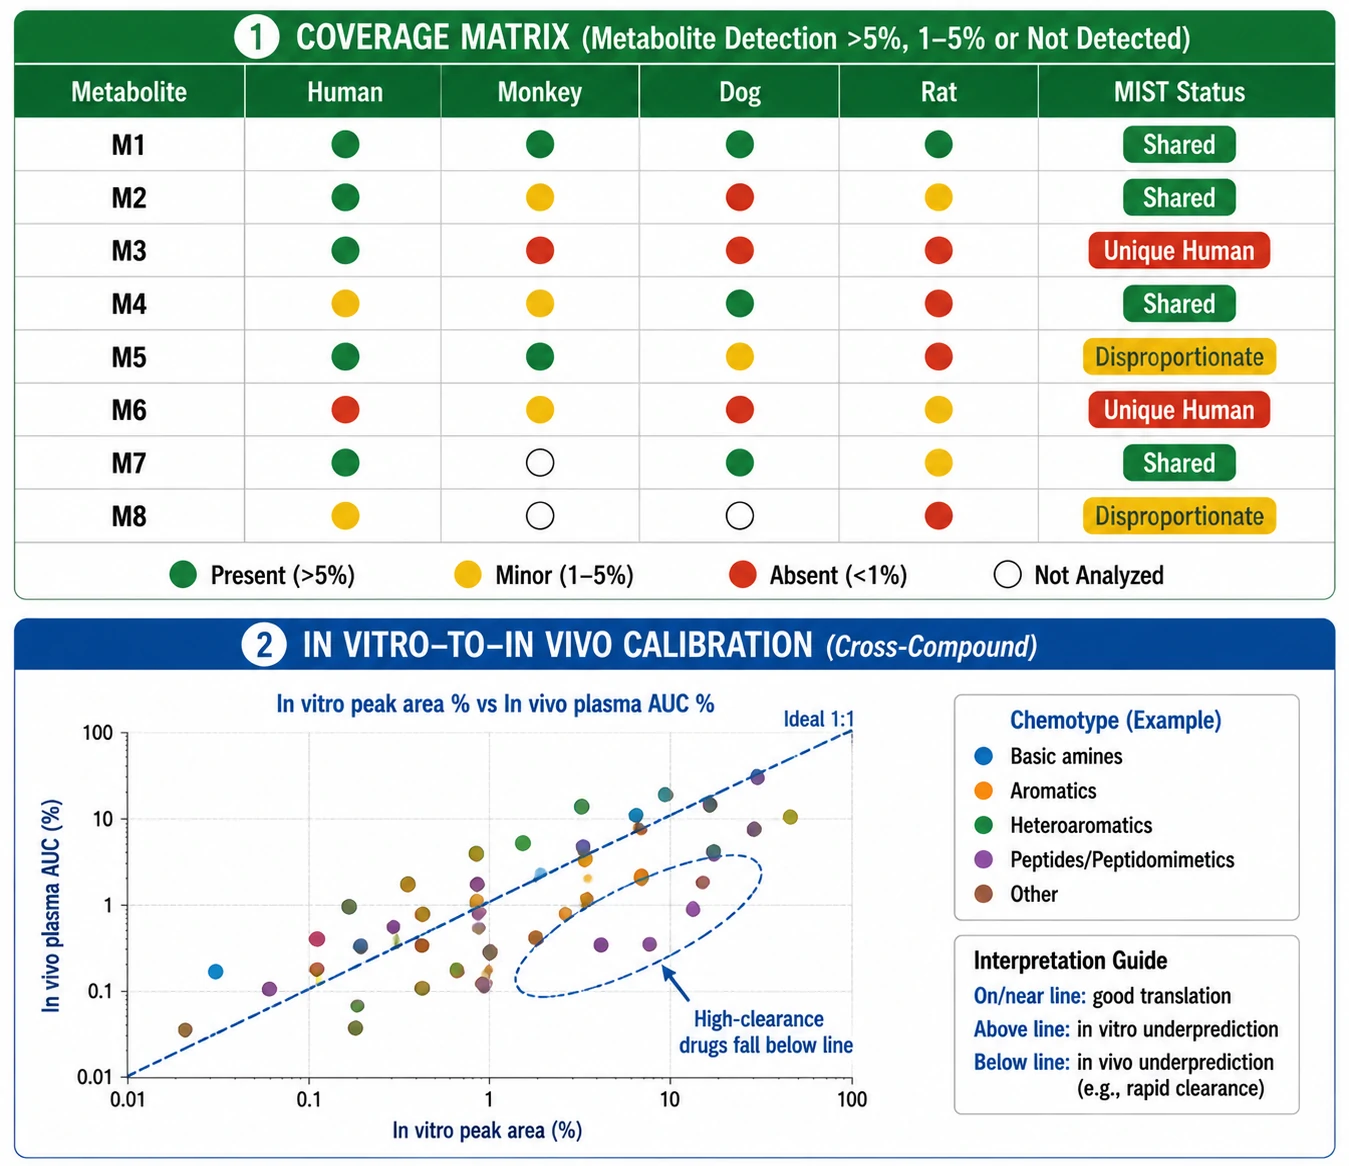 Figure 3: Cross-species metabolite profile comparison — qualitative coverage matrix with in vitro-to-in vivo calibration
Trend Analysis: What Does Your MetID Data Tell You?
Individual compound MetID data answers compound-specific questions. Trend analysis across a chemical series answers structural questions that guide the entire program — which substituents consistently increase oxidative metabolism, which positions are predictably glucuronidated, which core structures trigger reactive metabolite formation regardless of peripheral substitution.
The Ahlqvist et al. 2025 dataset exemplifies aggregated MetID analysis: across 120 compounds, patterns emerge that are invisible at the single-compound level — certain biotransformations dominate specific chemical classes, metabolite counts follow predictable distributions, and in vitro-in vivo concordance varies with logD (higher logD = poorer correlation). A compound whose profile is an outlier for its class — 15 metabolites when the class average is 5 — warrants investigation.
Soft spot trends guide medicinal chemistry. Para-substituted phenyl rings are CYP-susceptible; blocking with fluorine, chlorine, or cyclopropyl reduces oxidative clearance. N-alkyl groups (N-methyl, N-ethyl) are universal N-dealkylation sites; N-cyclopropyl or N-trifluoroethyl replacements resist CYP-mediated C-N cleavage. Terminal linear alkyl chains undergo omega/omega-1 oxidation; branching or cyclization reduces this liability. Tertiary amines are substrates for both N-oxidation (FMO) and N-dealkylation (CYP); amide, sulfonamide, or constrained ring nitrogen replacements address both pathways.
Reporting MetID data to medicinal chemists requires a visual format. The most effective: a MetID heat map on the chemical structure — red for major sites (>25%), yellow for minor (5-25%), green for trace (<5%). An accompanying table provides percentage parent remaining, major metabolites and abundance, proposed biotransformations, and cross-species comparison. The entire report fits on one page.
Accumulated proprietary MetID data — generated with the same lab, hepatocyte lot, and software — provides the training set for internal machine learning models of site-of-metabolism prediction. The Ahlqvist dataset serves as a public benchmark, but internal data consistently outperforms public models on proprietary chemical space because the major variation source in MetID data is inter-laboratory noise (different donors, conditions, instruments, processing parameters). An investment of 2-3 years of systematic collection across 200-300 compounds builds a predictive model that guides compound design before the first incubation is run.
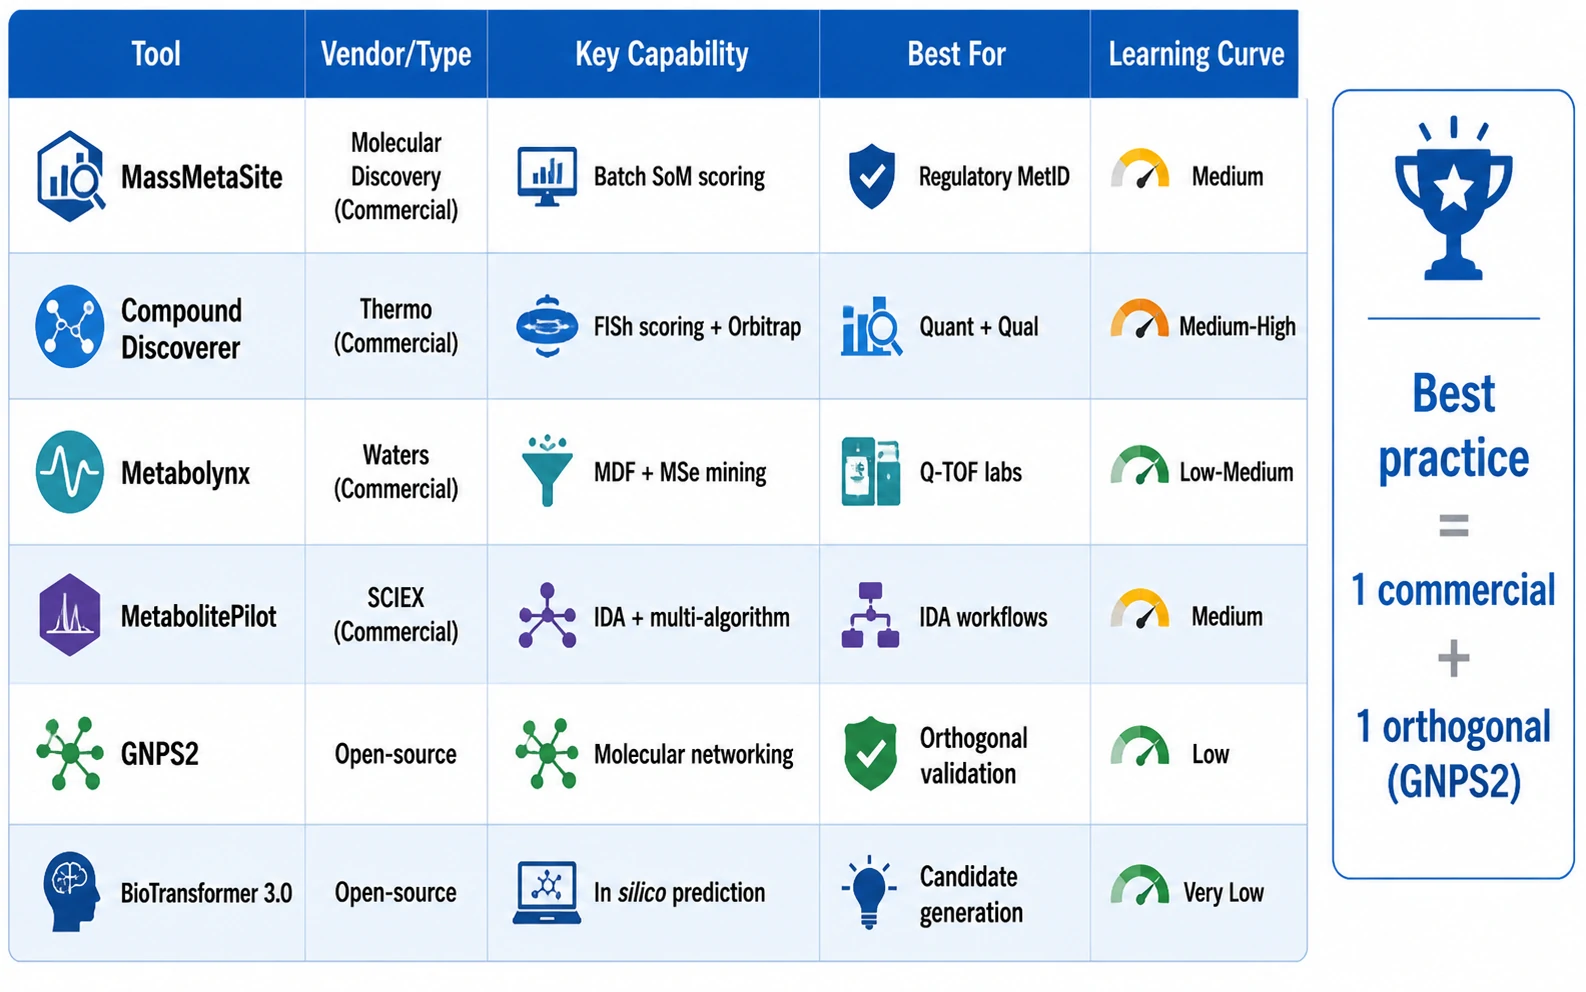 Figure 4: MetID software landscape 2026 — comparison of commercial and open-source tools with capabilities and best-fit use cases
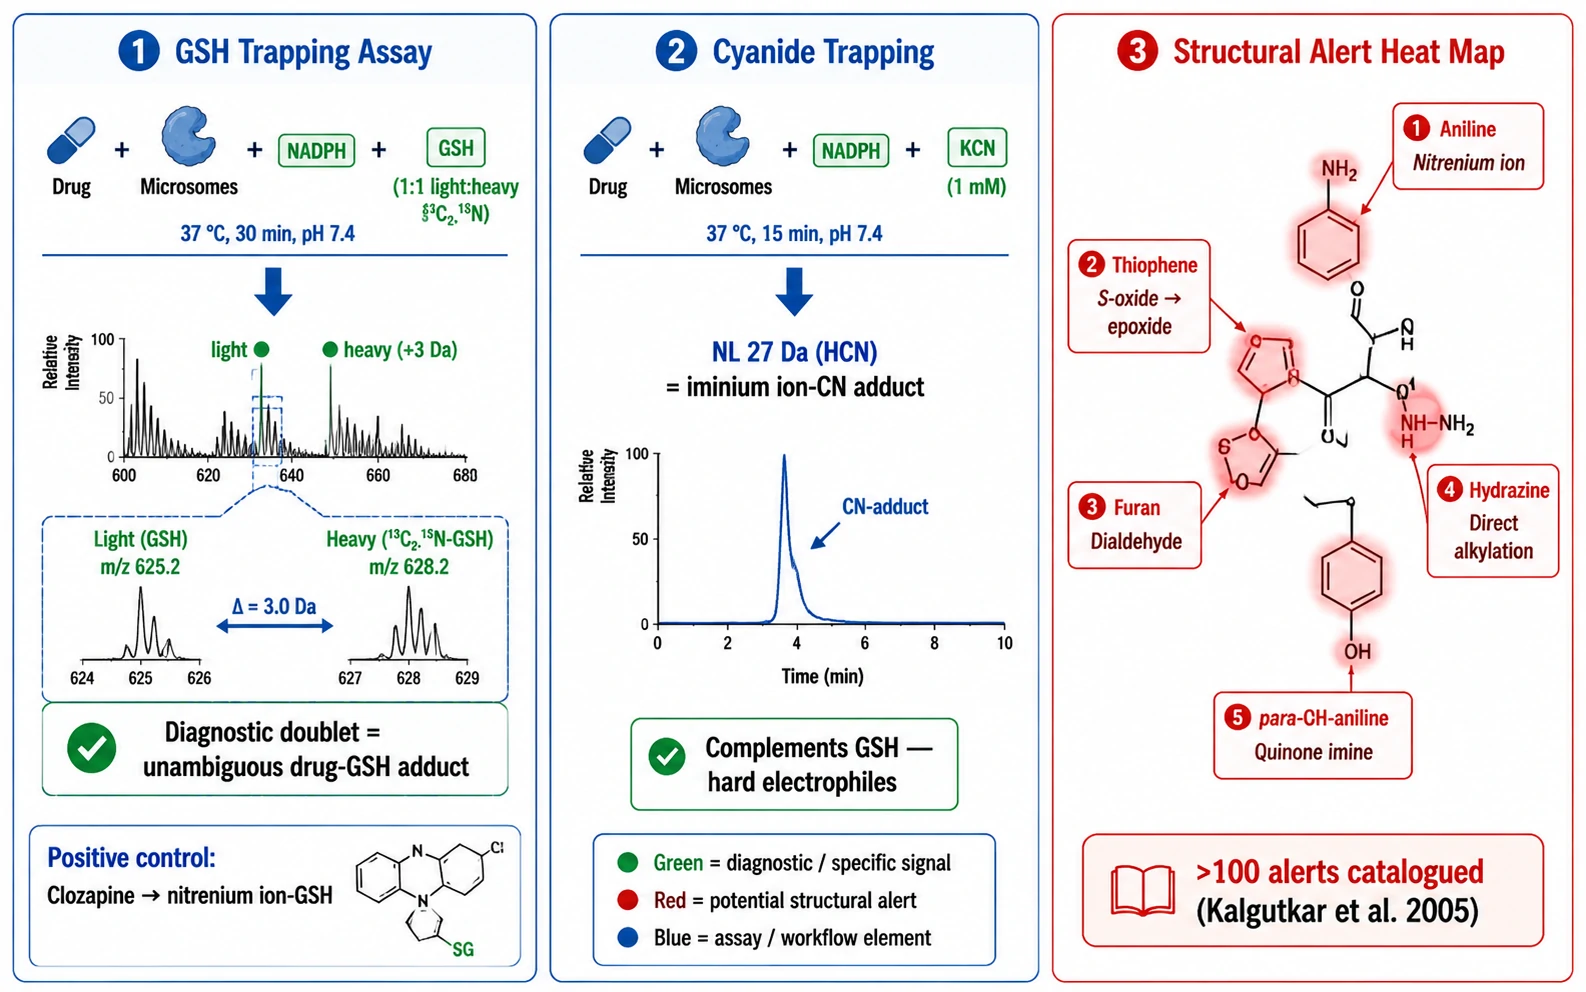 Figure 5: Reactive metabolite detection workflow — GSH trapping schematic with diagnostic 3-Da doublet and structural alert heat map
Frequently Asked Questions
What is the minimum data required to confidently identify a drug metabolite?
At minimum, you need accurate mass (HRMS, mass error <5 ppm) and MS2 fragmentation data. Accurate mass alone provides molecular formula but not structure — multiple isomers share the same formula. MS2 fragmentation is required for structural assignment. For Level 3 (tentative) confidence: accurate mass + MS2 fragments consistent with a proposed biotransformation on the parent structure. For Level 2 (probable): add MS2 spectral matching against a library or literature reference. For Level 1 (confirmed): add matching retention time and MS2 spectrum against an authentic reference standard. Without MS2 data, you have Level 4 (molecular formula) or Level 5 (mass of interest) — insufficient for regulatory decisions. With MS2 data and no standard, you have Level 3 — sufficient for discovery but not for regulatory MetID.
How does in vitro MetID compare to in vivo metabolite profiles, and when do they disagree?
In vitro hepatocyte MetID is a closed system driven by formation rate; in vivo MetID is an open system driven by formation, elimination (metabolic clearance, renal clearance, biliary clearance), and distribution. They disagree most often when: (1) the drug has high metabolic clearance — formed metabolites are rapidly eliminated in vivo and may appear minor despite extensive formation in vitro; (2) extra-hepatic metabolism contributes significantly — gut CYP3A4, gut microbiome, or plasma esterases produce metabolites that hepatocyte incubations miss; (3) transporter-mediated hepatic uptake or biliary efflux concentrates metabolites in bile that are minor in hepatocyte supernatant; (4) enterohepatic recirculation delays metabolite appearance in plasma beyond the standard sampling window. Disagreement is most common for high-clearance drugs and drugs with significant Phase II conjugation — both cases where elimination kinetics, not formation, determine the circulating metabolite profile.
What software tools are most commonly used for metabolite identification?
Four commercial platforms dominate: MassMetaSite (Molecular Discovery — industry standard, automated SoM scoring), Compound Discoverer (Thermo — Orbitrap integration, FISh scoring), Metabolynx (Waters — Q-TOF MSe optimized), and MetabolitePilot (SCIEX — IDA with parallel mining algorithms). On the open-source side, GNPS2 enables molecular networking for orthogonal validation, and BioTransformer 3.0 provides free in silico prediction. Most groups use one commercial platform plus GNPS2 for confirmation.
At what point in drug discovery should MetID be performed?
MetID should be performed at four stages. (1) Lead optimization: MetID identifies metabolic soft spots that guide structural modification. This should begin when the first in vitro metabolic stability data shows moderate-to-high clearance — understanding why a compound is cleared quickly informs whether the problem is fixable by structural modification. (2) Candidate selection: cross-species MetID (rat, dog, human hepatocytes) compares metabolite profiles and identifies compounds with disproportionate or unique human metabolites — a key selection criterion alongside potency and PK. (3) IND-enabling: definitive MetID in human hepatocytes (and/or liver microsomes with appropriate cofactors) identifies all metabolites exceeding 10% of total drug-related material, forming the basis of the MIST assessment in the IND. (4) Clinical development: MetID on human plasma, urine, and feces from the Phase I human ADME study confirms the in vitro predictions and identifies any unanticipated human-specific metabolites. Performing MetID only at the IND stage — when the compound is already selected — forfeits the opportunity to use MetID data for compound optimization and candidate differentiation.
How do I detect reactive metabolites, and what structural alerts should I prioritize?
Detection uses GSH trapping (for soft electrophiles) and cyanide trapping (for hard electrophiles like iminium ions) as complementary in vitro screens. A compound positive in either screen warrants structural alert analysis. Prioritize structural alerts that are: (1) present in the core scaffold (harder to remove than peripheral substituents), (2) associated with known toxicity in marketed drugs of the same class, and (3) predicted to be the major site of metabolism (if CYP primarily oxidizes elsewhere, a structural alert may be metabolically silent). The highest-priority alerts — because they are common and strongly associated with idiosyncratic toxicity — are anilines, hydrazines, thiophenes, furans, and para-hydroxyaniline/para-aminophenol motifs (which oxidize to quinone imines). Acyl halide precursors and Michael acceptors in the parent structure (rather than requiring metabolic activation) are an immediate red flag.
Can I reliably predict human metabolites from in vitro hepatocyte data alone?
In vitro human hepatocyte incubations predict the majority of human circulating metabolites for most drugs, but three classes of metabolites are systematically under-predicted or missed entirely. First, gut microbiome metabolites — reduction, hydrolysis, and deconjugation reactions mediated by gut bacteria — are absent from hepatocyte incubations and require fecal incubations or in vivo samples. Second, metabolites formed by enzymes not expressed or functional in cryopreserved hepatocytes — plasma esterases, gut wall CYP3A4, renal CYP and UGT enzymes — may be missed. Third, metabolites that are formation-rate-limited in vitro but elimination-rate-limited in vivo — the hepatocyte incubation shows the metabolite is formed, but does not reveal that in vivo it will accumulate because elimination is slow. Therefore: hepatocyte MetID provides the baseline metabolite profile, but regulatory MetID always includes in vivo verification. For discovery and candidate selection, hepatocyte-only MetID is standard and, used with awareness of its limitations, is sufficiently predictive to guide decision-making.
References
- Ahlqvist M, Karlsson IB, Ekdahl A, Ericsson C, Jurva U, Miljkovic F, Chen Y, Winiwarter S. Metabolite Identification Data in Drug Discovery, Part 1: Data Generation and Trend Analysis. Mol Pharm. 2025;22(10):5055-5069.
- U.S. FDA. Guidance for Industry: Safety Testing of Drug Metabolites. 2020.
- Schymanski EL, Jeon J, Gulde R, Fenner K, Ruff M, Singer HP, Hollender J. Identifying small molecules via high resolution mass spectrometry: communicating confidence. Environ Sci Technol. 2014;48(4):2097-2098.
- Evans DC, Watt AP, Nicoll-Griffith DA, Baillie TA. Drug-protein adducts: an industry perspective on minimizing the potential for drug bioactivation in drug discovery and development. Chem Res Toxicol. 2004;17(1):3-16.
- Park BK, Boobis A, Clarke S, Goldring CEP, Jones D, Kenna JG, Lambert C, Laverty HG, Naisbitt DJ, Nelson S, Nicoll-Griffith DA, Obach RS, Routledge P, Smith DA, Tweedie DJ, Vermeulen N, Williams DP, Wilson ID, Baillie TA. Managing the challenge of chemically reactive metabolites in drug development. Nat Rev Drug Discov. 2011;10(4):292-306.
- Prakash C, Shaffer CL, Nedderman A. Analytical strategies for identifying drug metabolites. Mass Spectrom Rev. 2007;26(3):340-369.
- Kalgutkar AS, Gardner I, Obach RS, Shaffer CL, Callegari E, Henne KR, Mutlib AE, Dalvie DK, Lee JS, Nakai Y, O'Donnell JP, Boer J, Harriman SP. A comprehensive listing of bioactivation pathways of organic functional groups. Curr Drug Metab. 2005;6(3):161-225.
- Zhu M, Zhang H, Humphreys WG. Drug metabolite profiling and identification by high-resolution mass spectrometry. J Biol Chem. 2011;286(29):25419-25425.
- Ma S, Chowdhury SK, Alton KB. Application of mass spectrometry for metabolite identification. Curr Drug Metab. 2006;7(5):503-523.
- Dalvie DK, Kalgutkar AS, Khojasteh-Bakht SC, Obach RS, O'Donnell JP. Biotransformation reactions of five-membered aromatic heterocyclic rings and the impact on drug discovery. Chem Res Toxicol. 2002;15(3):269-299.
Disclaimer: All services and resources mentioned on this site are for research use only (RUO) and are not intended for diagnostic, therapeutic, or clinical applications.
Related Services


