ICH M10 bioanalytical method validation is the first globally unified guideline for chromatographic assays. After decades of parallel but slightly different frameworks — FDA BMV 2018, EMA BMV 2011, PMDA, Health Canada, ANVISA — a single standard now governs how every LC-MS/MS method must be validated for regulatory submission. China dropped its Guideline 9012 in 2025 and adopted ICH M10. Pharmaceutical companies and CROs filing to any ICH member can cite one validation report.
The guideline landed in May 2022. As of mid-2025, the industry has three years of implementation experience. Some sections are working well. Others are causing real pain. This article covers: what actually changed, where methods are failing in practice, and what to do when something goes wrong.
The Parameter Framework
ICH M10 validation parameters for chromatographic methods:
Selectivity / Specificity. The guideline separates these. Selectivity = ability to measure the analyte in the presence of blank matrix endogenous components. Specificity = ability to distinguish the analyte from related substances — metabolites, isomers, degradation products, concomitant medications. Six individual matrix lots minimum. Interference ≤20% of LLOQ at the analyte retention time. IS interference ≤5%.
For specificity during method development, spike the analyte at LLOQ into blank matrix extracts, then independently spike each potential interferent at its expected Cmax concentration (metabolites, co-administered drugs) or at 10× the analyte concentration (isomers, degradation products). The analyte peak area must remain within ±15% of the un-spiked control. Run this in at least two matrix lots — interferent binding to matrix proteins can shift interference severity between donors. Document the list of tested compounds and their concentrations in the validation report.
Selectivity is the parameter most likely to fail on the first pass. The problem is never the clean solvent standard. It is Lot 4 — the one with 15-year-old donor plasma showing an endogenous peak that sits 0.02 minutes from the analyte. This is where most discovery-stage methods unravel when they encounter clinical matrix diversity. For a systematic approach to building selectivity and specificity from the start, see our guide on bioanalytical method development and validation.
Failure Case — Selectivity. A method for a tyrosine kinase inhibitor measured at 1 ng/mL LLOQ passed all six selectivity lots during development. During clinical sample analysis, a late-arriving sample from a renally impaired patient produced an interference peak at the analyte retention time — the endogenous compound, elevated in renal disease, was not present in the healthy-donor lots used for selectivity testing. The interference produced a 25% overestimation. The fix: add one lot each of hemolyzed, lipemic, and renally impaired matrix to the selectivity panel during method development, not just healthy donors. ICH M10 does not require disease-state matrix for selectivity, but regulators expect labs to document why the selected lots represent the study population.
Calibration Curve. Six to eight non-zero standards spanning the expected concentration range. Back-calculated concentrations within ±15% of nominal (±20% at LLOQ). At least 75% of standards must meet these criteria. The weighting function — almost always 1/x² for LC-MS/MS — must be justified by residual plots. For methods requiring full ICH M10 validation from the ground up, our full, partial, and cross-validation services cover every parameter with pre-validated templates and regulatory-ready documentation packages.
Accuracy and Precision. Within-run and between-run, at four QC levels: LLOQ, Low (~3× LLOQ), Mid (30-50% of ULOQ), High (≥75% of ULOQ). This MQC definition changed from earlier guidances. FDA 2018 used "mid-range." ICH M10 specifies 30-50% of calibration range. Acceptable accuracy: within ±15% (±20% at LLOQ). Precision: CV ≤15% (≤20% at LLOQ).
QC Run Acceptance. QCs distributed through each batch, at least every 10-20 injections. At least 67% of all QCs and at least 50% at each level must meet acceptance criteria for the run to pass. Failed runs require re-extraction or re-injection per pre-defined decision trees — ad hoc re-analysis is a regulatory risk.
A practical note on run failure documentation: regulators now expect to see the investigation, not just the re-run. "We re-injected and it passed" is insufficient. Document what you think happened, even if you cannot prove it.
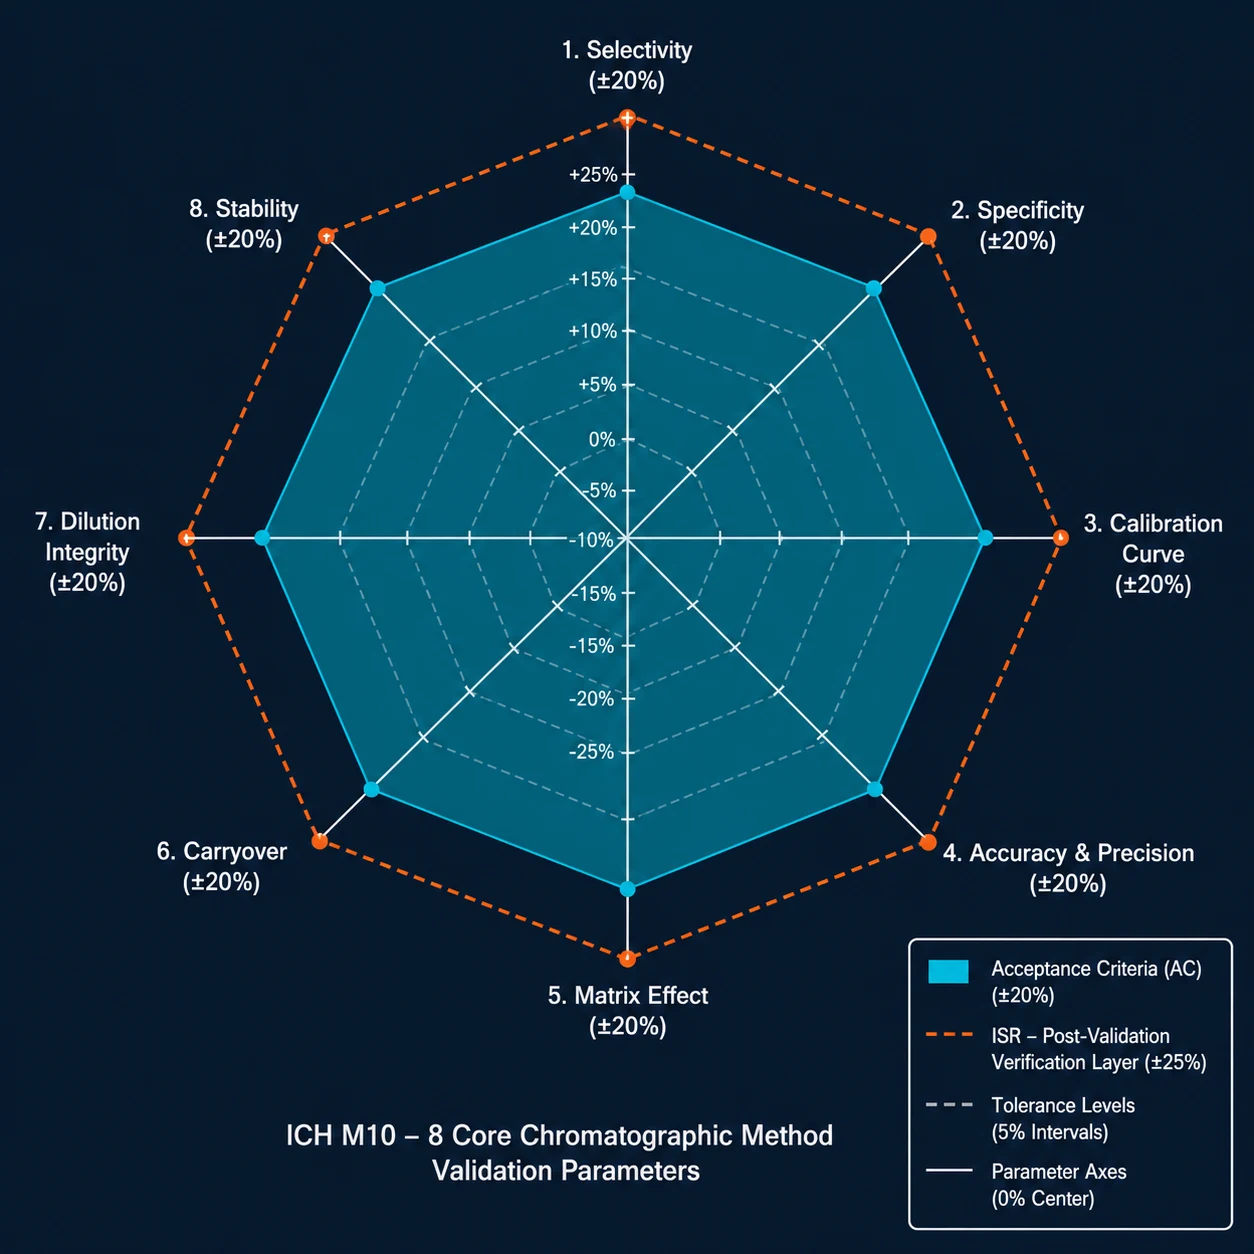 Figure 1: ICH M10 Validation Parameter Radar — A hexagonal radar chart showing the 8 core chromatographic method parameters (Selectivity, Specificity, Calibration, Accuracy & Precision, Matrix Effect, Carryover, Dilution Integrity, Stability) with their acceptance criteria thresholds radially plotted. Center = 0% tolerance; outer ring = widest criteria. ISR shown as a concentric outer band — the post-validation verification layer surrounding all other parameters.
Matrix Effect Assessment
The matrix factor (MF) concept is unchanged, but ICH M10 brought two important shifts.
First, the IS-normalized matrix factor is now the primary metric. Calculate MF_analyte and MF_IS separately in each of ≥6 individual matrix lots, at both low and high QC concentrations. IS-normalized MF = MF_analyte / MF_IS. The CV across all lots must be ≤15%. A CV above this threshold means the IS is not adequately tracking the analyte's ionization behavior.
Second, ICH M10 explicitly requires evaluation of matrix effect across all matrix species and anticoagulants used in the study. If a method is validated in K2EDTA human plasma but study samples arrive in Li-heparin, the matrix effect data from K2EDTA does not transfer. This is a common rejection point during regulatory review.
For a deeper treatment of matrix effect mechanisms and the full mitigation pyramid, see our comprehensive guide on matrix effects in LC-MS/MS bioanalysis.
Carryover
Carryover = signal from a preceding high-concentration sample appearing in a subsequent blank. ICH M10: carryover at the analyte retention time must be ≤20% of LLOQ, and IS carryover ≤5% of the mean IS response.
The carryover debate. A live discussion in the BEBAC Bioequivalence Forum (April 2025) crystallized a real tension: some practitioners advocate placing at least one double-blank immediately after the highest calibrator in every run, not just during validation. The rationale — real-study chromatograms differ from validation runs, and column aging changes carryover behavior. CROs resist because it adds injections; regulators have raised carryover as a showstopper issue during inspections. The practical middle ground: include one blank after the ULOQ calibrator in every batch. One injection. Zero questions later.
Failure Case — Carryover. A semaglutide LC-MS/MS method (Bhosale et al., Int J Pharm Sci, 2025) exhibited 100% carryover with isocratic/binary flow conditions. The 3.3 kDa peptide stuck to the column and autosampler surfaces, reappearing in every subsequent blank. Switching to a gradient method (5% to 90% organic phase) eliminated carryover completely (0.00% at both analyte and IS retention time relative to LLOQ) and simultaneously improved LLOQ sensitivity. The lesson: carryover problems are chromatographic or adsorptive at root — needle wash protocols help, but gradient and column chemistry are the real fix. For methods requiring systematic carryover troubleshooting and chromatographic re-optimization, our custom LC-MS/MS method development services address adsorptive carryover, gradient optimization, and column chemistry selection for problematic compounds including peptides, prodrugs, and chiral molecules.
Stability
ICH M10 stability requirements cover: bench-top, autosampler/post-preparative, freeze-thaw (minimum three cycles at intended storage temperature), and long-term frozen storage. Each must be tested at low and high QC concentrations.
The single most impactful change: multi-aliquot stability QCs. ICH M10 requires ≥3 aliquots per concentration per stability time point. Prior guidances (FDA 2018, EMA 2011) did not specify aliquot count, and many labs ran single aliquots. This requirement came from a 2015 Health Canada notice and is now harmonized. If your validation predates ICH M10 and used single-aliquot stability testing, add multi-aliquot data before submission — at minimum for short-term stability and one long-term time point.
Four recurring stability gaps that cause inspection friction:
- Pre-analytical time-to-freeze not documented. A sample sitting on the bench for 45 minutes before centrifugation experiences different stability than a 15-minute sample. Document the actual interval, not the SOP ideal.
- Worst-case freeze-thaw not tested. Three cycles in a lab freezer at -70°C with stable power is not the same as three cycles during shipment with temperature excursions. Match the stress to reality.
- IS stock stability not independently verified. ICH M10 explicitly requires both short- and long-term stability of IS in stock and working solutions. For stable-label (¹³C) IS, you can reference the unlabeled analyte data. For structural analog IS, all stability studies must be run independently. Selecting the right IS from the start avoids re-validation — our internal standard selection and optimization services provide SIL-IS sourcing, feasibility testing, and matrix effect tracking across species.
- Container-surface interactions at low concentrations. At LLOQ levels, nonspecific binding to polypropylene tubes or glass vials can deplete analyte concentration by 20-50%.
Failure Case — Stability. A prodrug compound for an oncology program passed all three freeze-thaw cycles during method validation at -70°C. During a clinical study in Southeast Asia, a freezer malfunction at -20°C went undetected for 36 hours. The compound underwent partial hydrolysis back to the active drug. Study samples from the affected period showed parent drug concentrations 40-60% below expected, with corresponding metabolite elevations. The CAPA: continuous temperature monitoring with SMS alerts, minimum two independent freezers per site, and pre-validated freeze-thaw data at -20°C as a contingency — because real-world storage is never as controlled as validation conditions.
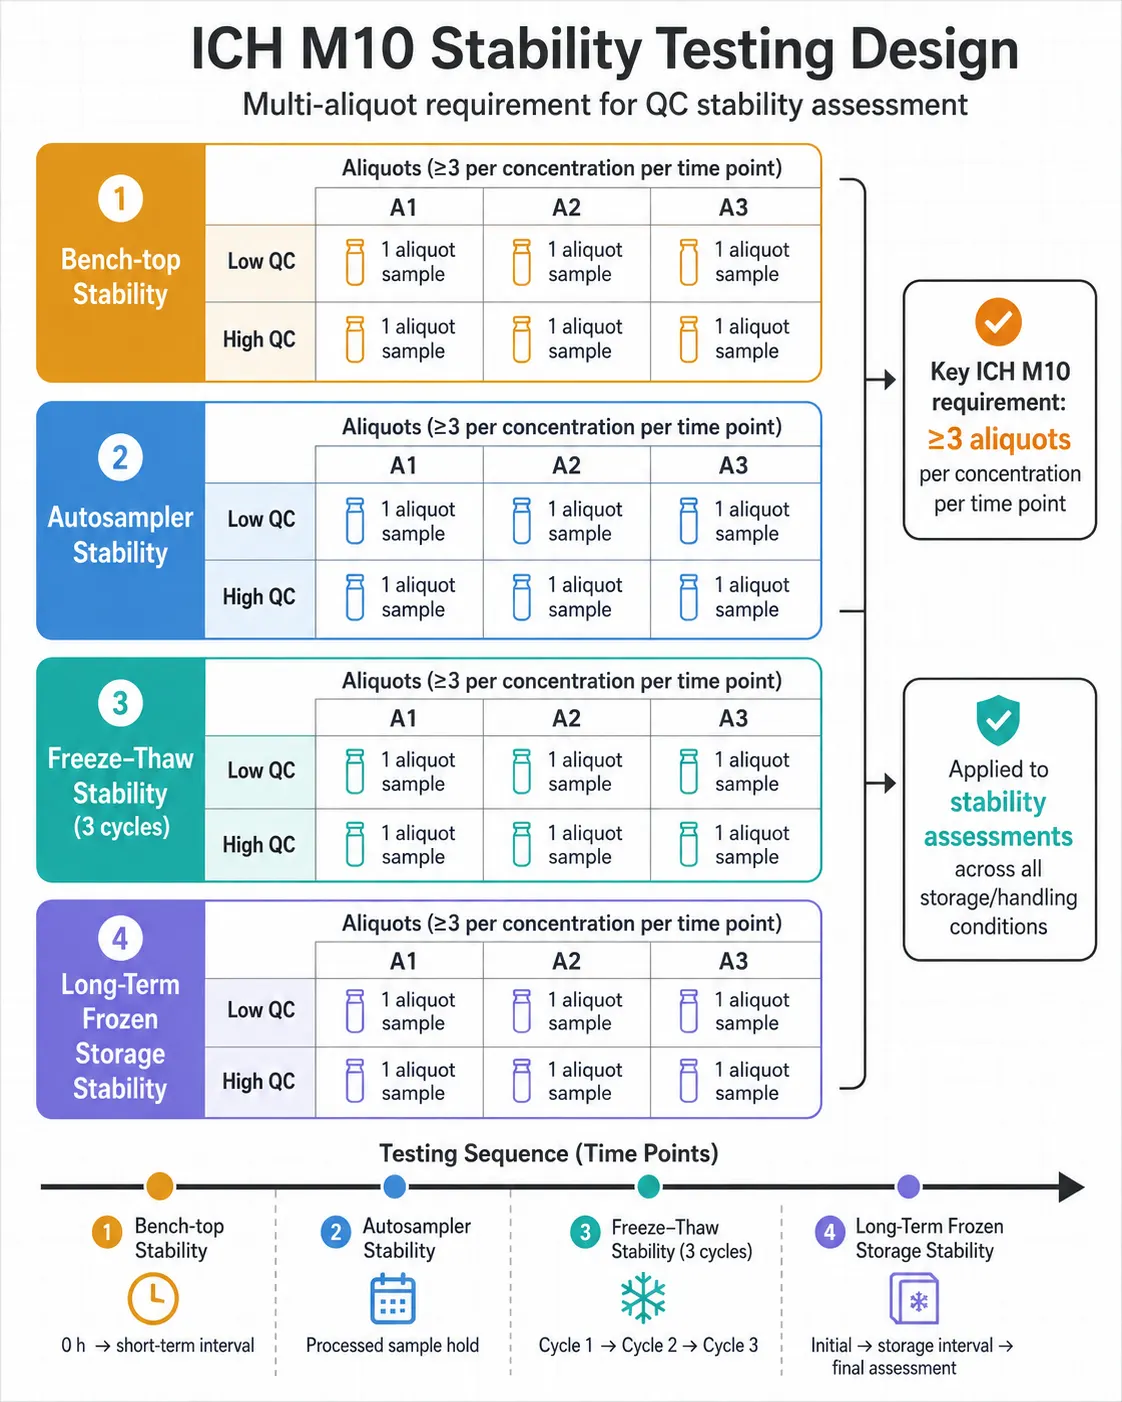 Figure 2: ICH M10 Stability Testing Design — Multi-Aliquot Layout, Conditions, Time Points, Acceptance Criteria
Incurred Sample Reanalysis
ISR is the ultimate validation check: re-analyze a subset of study samples and confirm the original result is reproducible. ICH M10 requires ISR for all in-life studies. The scope is study samples — not QCs or calibrators.
Selection. Approximately 10% of study samples, minimum 20 samples per study, covering Cmax, elimination phase, and near-LLOQ concentrations. Spread evenly throughout the study — not all at the end.
Acceptance criteria. At least 67% of reanalyzed samples must have percent difference ≤20% of the mean of the original and repeat values. The formula: [(repeat - original) / mean] × 100.
Trend analysis. This is new under ICH M10. Previous guidances said ISR should be "assessed" — ICH M10 explicitly requires investigation of systematic trends. If all ISR failures are positive (repeat > original), or all fall within one dosing group, or all originate from one analytical batch — investigate. Regulators are now applying this retrospectively. A documented case from November 2024: a regulatory authority requested ISR trend investigation for a study conducted under EMA 2011 guidelines, citing ICH M10 expectations, even though M10 did not apply at the time of study conduct.
The numbers. Industry-wide ISR failure rate is approximately 4.5% across preclinical and clinical studies. The root causes: drug/metabolite instability in matrix (61% of failures), sample processing issues (25%), human error (10%), and inherent method deficiencies (4%). Stability-related ISR failures dominate — if your compound is unstable in matrix, even a perfect analytical method will produce ISR failures. When metabolite interconversion is suspected, parallel monitoring of parent drug and key metabolites — rather than parent alone — distinguishes analytical artifacts from genuine pharmacokinetic differences. Our high-resolution metabolite quantification services provide simultaneous parent-metabolite profiling with LC-MS/MS methods validated per ICH M10, covering both discovery and regulated bioanalysis.
Failure Case — ISR. In June 2024, the FDA issued a warning letter to a CRO after an inspection found that the laboratory substituted reanalyzed data for original valid data without justification. ISR failures originally showing a BE study failing were selectively replaced with passing reanalysis results. The CRO attributed discrepancies to "processing errors" with no supporting evidence. The finding was classified as data integrity, not scientific error. The regulatory consequence: all study data from that laboratory placed under heightened scrutiny, and the sponsor was required to re-conduct portions of the bioequivalence study. The practical lesson: ISR failures are scientifically manageable if investigated. Concealing them is not.
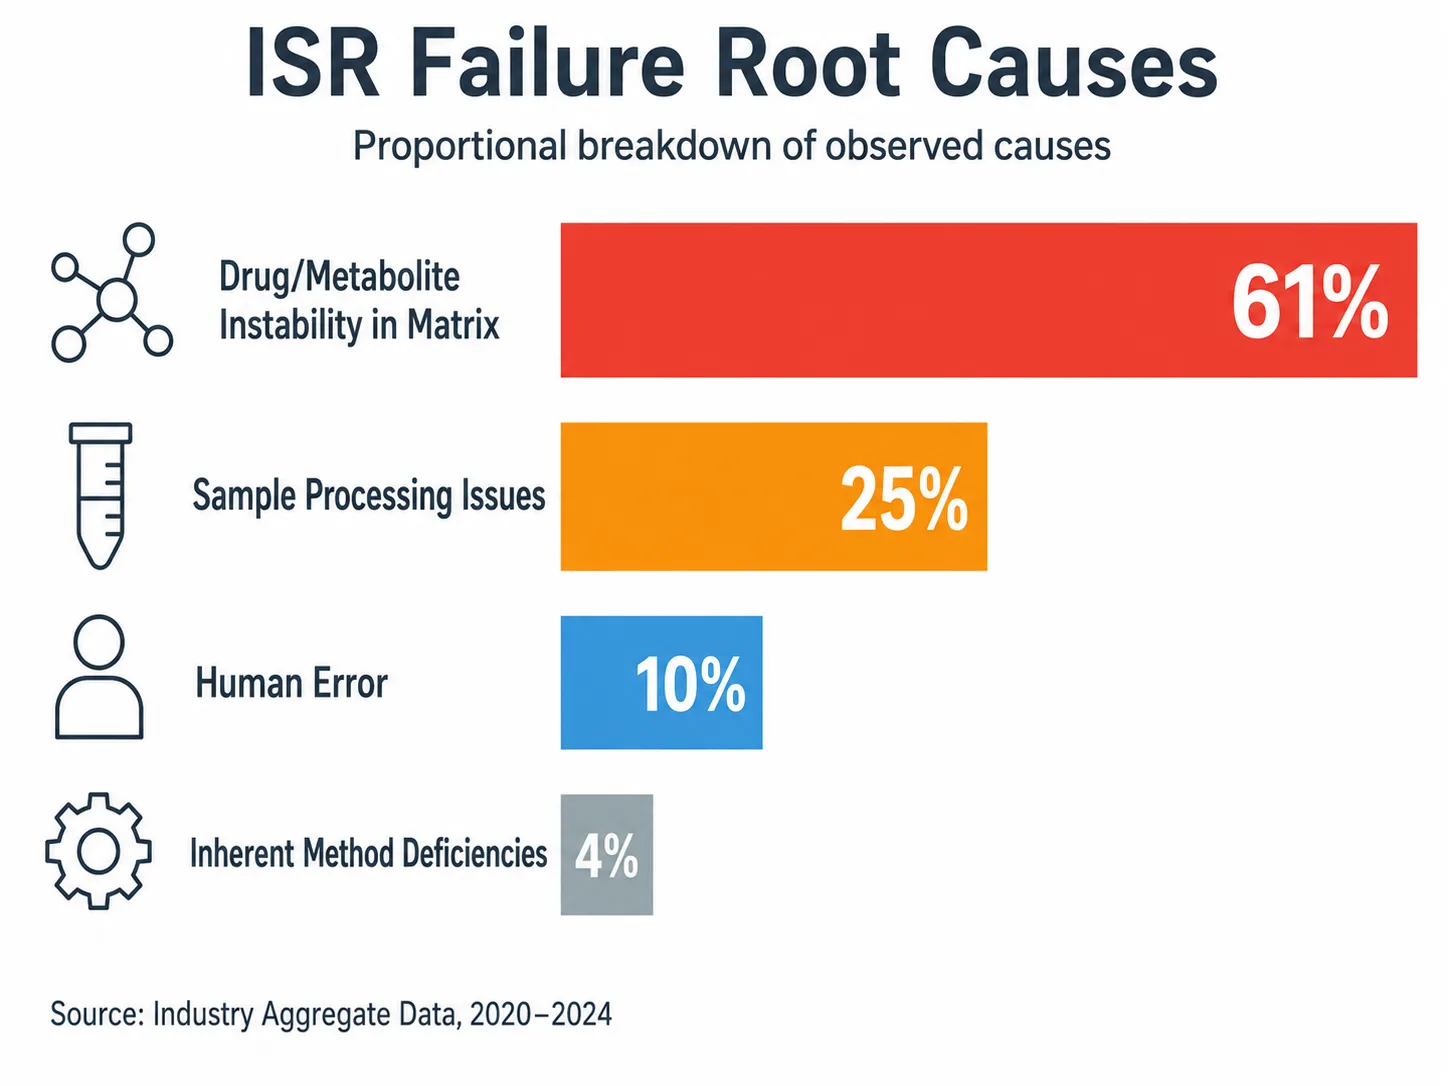 Figure 3: ISR Failure Root Cause Distribution — Stability 61%, Processing 25%, Human Error 10%, Method 4%
Cross-Validation: From Pass/Fail to Bias Assessment
The most consequential conceptual shift in ICH M10 is the treatment of cross-validation.
Under prior guidances (FDA 2018, EMA 2011), cross-validation was treated as a near-binary pass/fail. If two methods or two laboratories produced results within ±20% for ≥67% of samples, cross-validation passed. If not, it failed. This created perverse incentives: labs whose cross-validation barely failed would re-analyze samples until the 67% threshold was met, without understanding why the methods differed.
ICH M10 replaces pass/fail with statistical bias assessment. Compare methods using the same QCs (at least low and high concentrations) and a minimum of 30 incurred samples covering the expected concentration range. Calculate the percent difference for each sample pair. Plot the differences against concentration. If a systematic bias exists — Method B consistently reads 10% lower than Method A — the bias is quantified. Whether that bias is acceptable depends on the study's risk. A 10% bias is irrelevant for a discovery PK screen; for a bioequivalence study where the 90% CI straddles 80-125%, it matters.
This is a more honest approach. It acknowledges that two separately developed, separately validated methods, running on different instruments in different laboratories, will never produce identical results. The goal is to understand the bias and decide whether it matters, not to force a pass through re-analysis.
Practical implementation. The minimum 30 incurred samples should span the observed concentration range, not be clustered around Cmax. Include near-LLOQ samples — low-concentration bias is often larger and more clinically relevant than mid-concentration bias. Compare both methods using Bland-Altman plots and Deming regression, not just percent difference tables. Our method transfer and cross-validation services provide cross-site protocol harmonization, incurred-sample-based bias assessment per ICH M10, and statistical documentation packages ready for regulatory review.
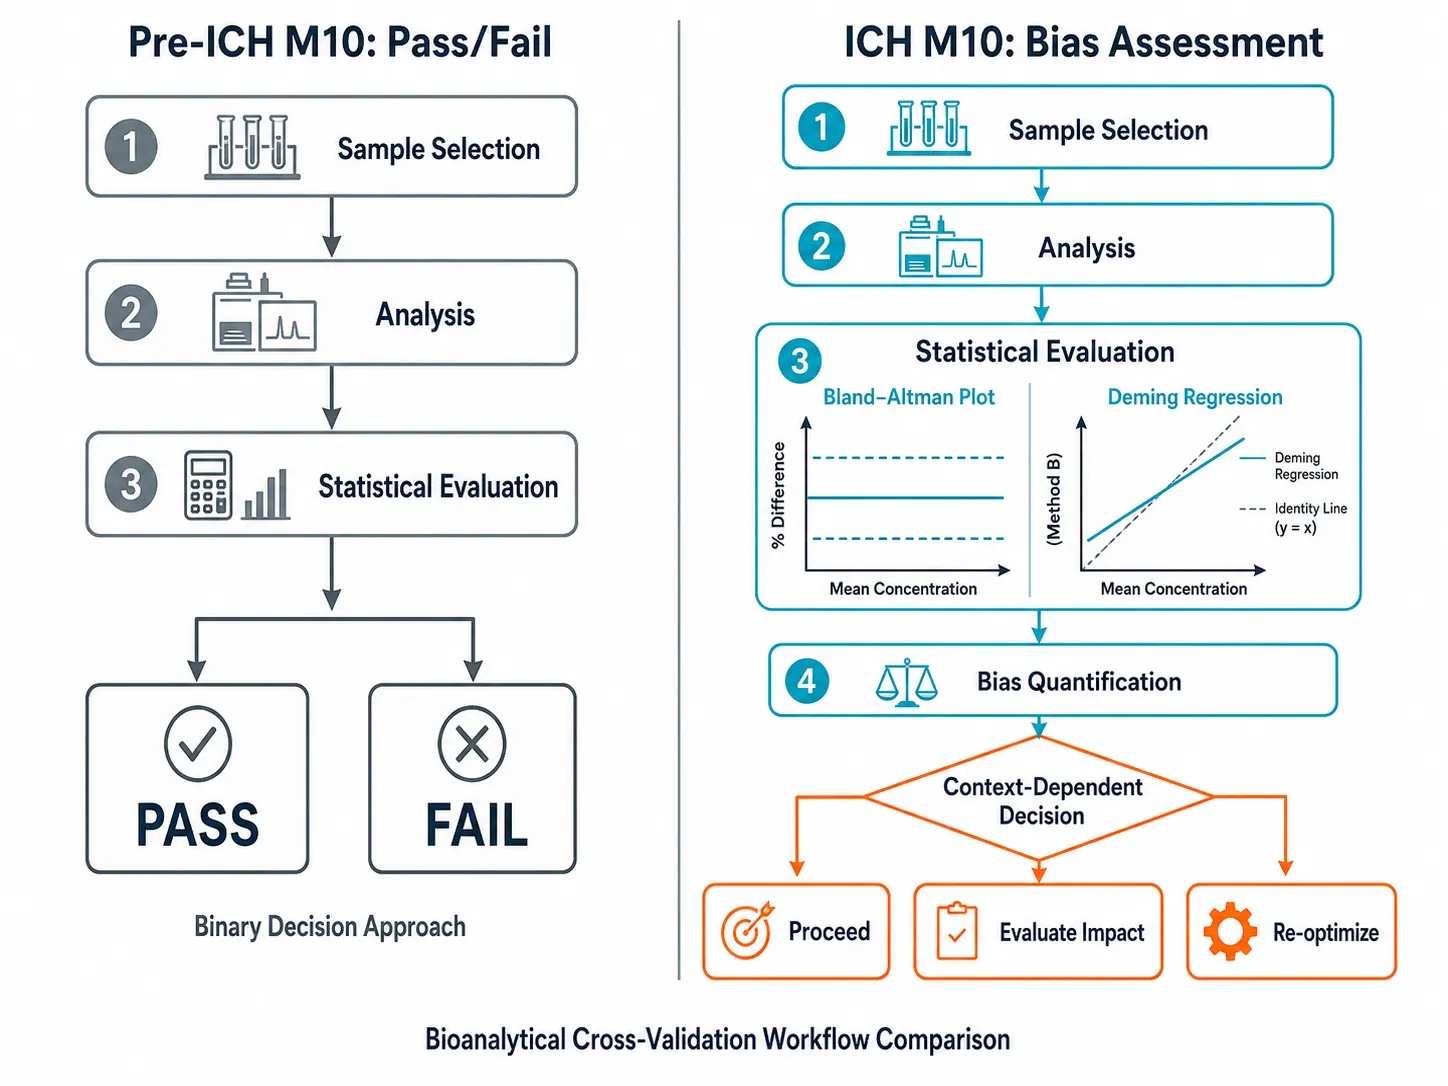 Figure 4: Cross-Validation Bias Assessment — Before/After ICH M10 Approach Comparison
Dilution Integrity
ICH M10 requires dilution QCs prepared at a concentration above the ULOQ, then diluted with blank matrix into the calibration range using the same dilution factor applied to study samples. The acceptance criteria match the run QC criteria — accuracy within ±15%, precision ≤15% CV.
The key change from prior guidances: the dilution QC must be prepared from a concentration outside the calibration range, and the dilution factor must bracket the factor used for study samples. If study samples require 10× dilution, the dilution QC must use at least 10×. If multiple dilution factors are used across a study, the validation must cover each factor.
Common pitfall: validating a 2× dilution QC for a method where actual study samples require 20× dilution (e.g., urine samples at 200× expected plasma concentration). Under ICH M10, this is a gap. Either validate the actual dilution factor or describe in the analytical plan why the validated factor is sufficient. The diluent itself matters: using blank matrix as diluent preserves matrix composition but consumes precious matrix volume. Using neat solvent is acceptable only if matrix effects have been shown to be dilution-independent — verify with one experiment comparing matrix-diluted vs solvent-diluted QCs at the target dilution factor. Dilution integrity is part of the broader quantification workflow — for methods validated across multiple matrices and dilution ranges, our LC-MS/MS single drug quantification services include dilution QC validation at study-relevant factors for plasma, serum, urine, and tissue homogenates.
Endogenous Analyte Bioanalysis
ICH M10 Section 7.1 addresses endogenous analytes for the first time in a harmonized guideline. When the analyte is present endogenously, a true blank matrix does not exist. The three accepted approaches: surrogate matrix (stripped or artificial), surrogate analyte (stable-labeled standard as calibrator), or standard addition (spiking analyte into the actual matrix and back-calculating from the standard curve). Each approach has regulatory precedent. The critical requirement is documenting why the chosen approach is fit for purpose, including demonstration that the surrogate matrix or surrogate analyte behaves identically to the authentic matrix or analyte. In practice, surrogate matrix is the most common choice for small-molecule LC-MS/MS: charcoal-stripped plasma removes >95% of endogenous steroids, hormones, and bile acids. The surrogate must be validated for parallelism — the calibration curve slope in surrogate matrix must match the slope in authentic matrix within ±10% — and for recovery at low and high QC concentrations. Standard addition is more labor-intensive but avoids the surrogate matrix validation burden entirely. For endogenous biomarkers and compounds where matrix selection is the primary development challenge, our bioanalysis services for challenging compounds and complex matrices include surrogate matrix preparation, parallelism validation, and standard addition protocols per ICH M10 Section 7.1.
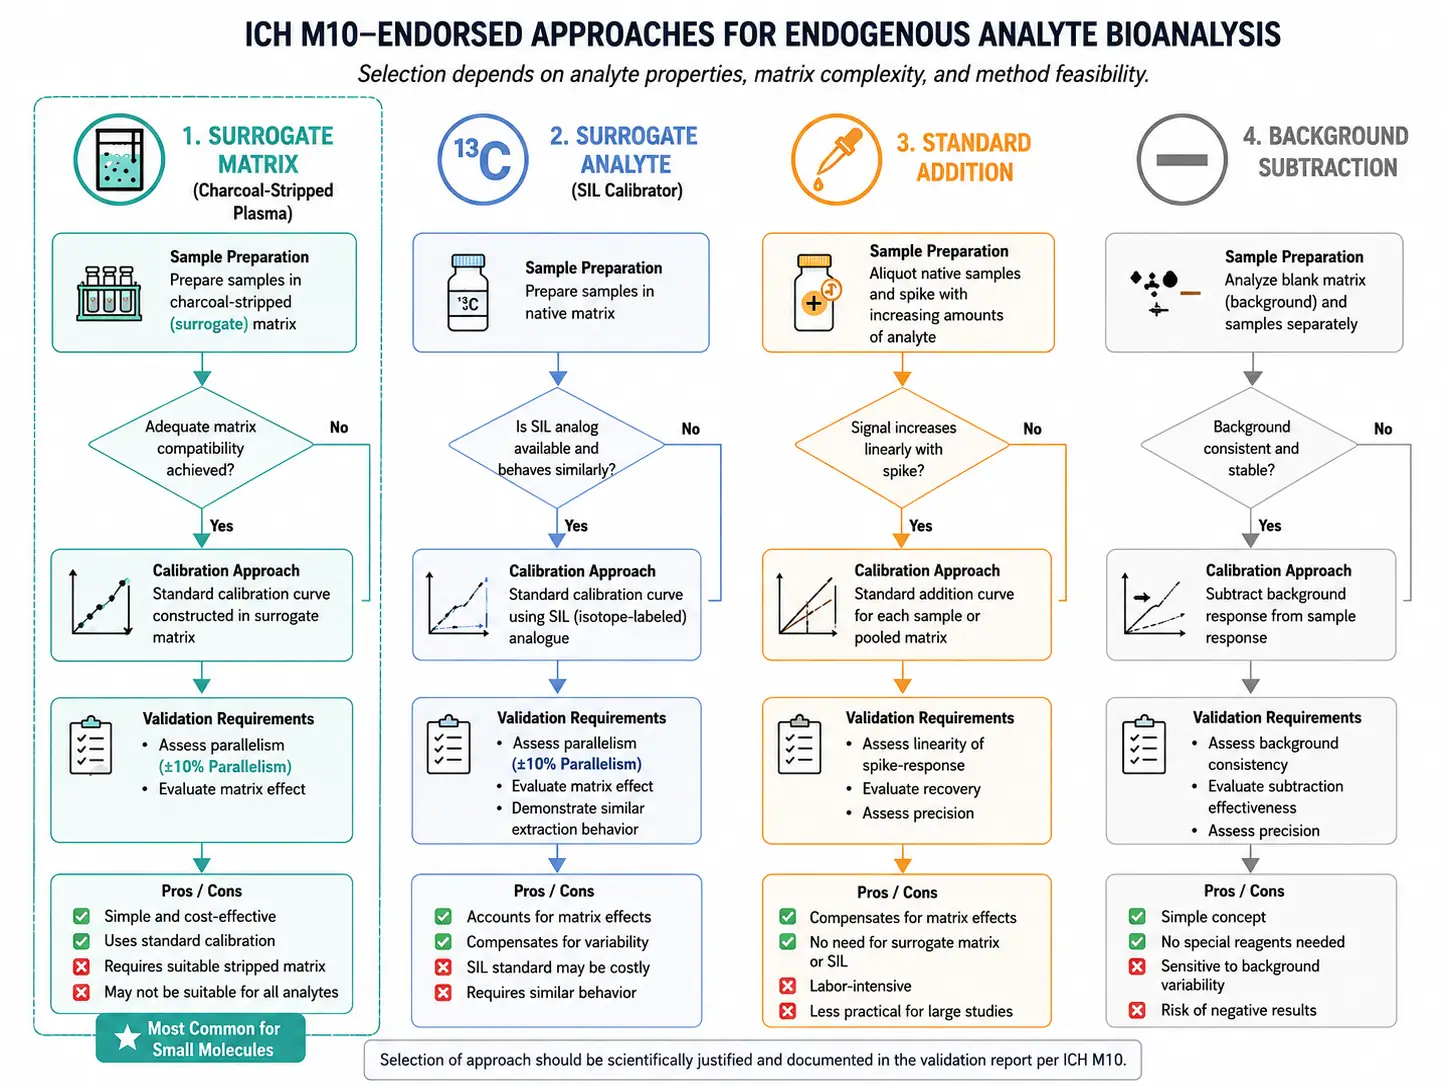 Figure 5: Endogenous Analyte Bioanalysis Strategy — Surrogate Matrix vs Alternate Matrix vs Standard Addition vs Background Subtraction
Practical Decision Trees for Common Failures
When Selectivity Fails
- One lot shows interference at the analyte retention time exceeding 20% of LLOQ.
- Step 1: Identify the interferent. If it is a known endogenous compound elevated in specific populations (renal/hepatic impairment), two options: add affected-donor lots to the method's selectivity panel and accept reduced scope, or modify chromatography to resolve.
- Step 2: Modify gradient. A shallower gradient adds resolution. Changing organic modifier (MeOH vs ACN) changes selectivity. A different column chemistry (phenyl-hexyl, HILIC) provides different interaction modes.
- Step 3: If interference persists, switch to MS³ or pre-extraction immunoaffinity cleanup.
- Step 4: If unresolved, document the limitation and exclude affected populations from the analytical plan.
When Matrix Factor CV Exceeds 15%
- This means the IS is not tracking the analyte's matrix behavior.
- Step 1: Check IS type. If using a structural analog IS, the fix is switching to stable-isotope-labeled IS (¹³C, ²H). SIL-IS co-elutes and experiences nearly identical ionization — IS-normalized MF CV typically drops from 25-40% to <8%.
- Step 2: If already using SIL-IS and CV remains >15%, the problem is probably a deuterium isotope effect — ²H-labeled IS elutes 0.02-0.05 min earlier, entering a different suppression zone. Switch to ¹³C-labeled IS (no retention time shift).
- Step 3: If failure persists, the matrix effect is too strong for IS compensation. Escalate sample preparation — switch from PPT to mixed-mode SPE or HybridSPE. See our matrix effects mitigation guide for the full decision logic.
When ISR Fails
- Less than 67% of ISR samples meet the ±20% criterion.
- Step 1: Classify the failure pattern. Are all failures in one direction (repeat consistently > or < original)? One direction = systematic issue (stability, sample handling). Both directions = random error (sample inhomogeneity, processing artifacts).
- Step 2: If systematic and positive (repeat > original), suspect drug/metabolite interconversion ex vivo — metabolites hydrolyzing back to parent drug in stored samples. Check collection-to-freeze intervals and freeze-thaw history.
- Step 3: If systematic and negative (repeat < original), suspect parent drug degradation or analyte adsorption to storage containers.
- Step 4: If failures cluster in specific samples (Cmax samples, samples from one site, samples from one storage location), investigate those specific conditions.
- Step 5: Document the investigation, implement targeted CAPA, and re-validate affected parameters. If re-analysis is scientifically justified, perform it under a pre-approved SOP with full documentation — never re-analyze ad hoc.
When Cross-Validation Shows Bias
- A systematic bias exists between methods or laboratories.
- Step 1: Quantify the bias. Is it constant across concentrations (parallel shift = extraction recovery difference) or proportional (slope difference = calibration or IS integration issue)?
- Step 2: If bias is ≤10% across the range, document and proceed. 10% is within combined analytical variability for most methods.
- Step 3: If bias is 10-20%, evaluate clinical impact. For a BE study with 90% CI near the boundary, even 10% matters. For a preclinical PK comparison, it does not.
- Step 4: If bias exceeds 20%, the methods are not cross-validated. Re-optimize the poorer-performing method, identify the root cause of the discrepancy, and re-run cross-validation.
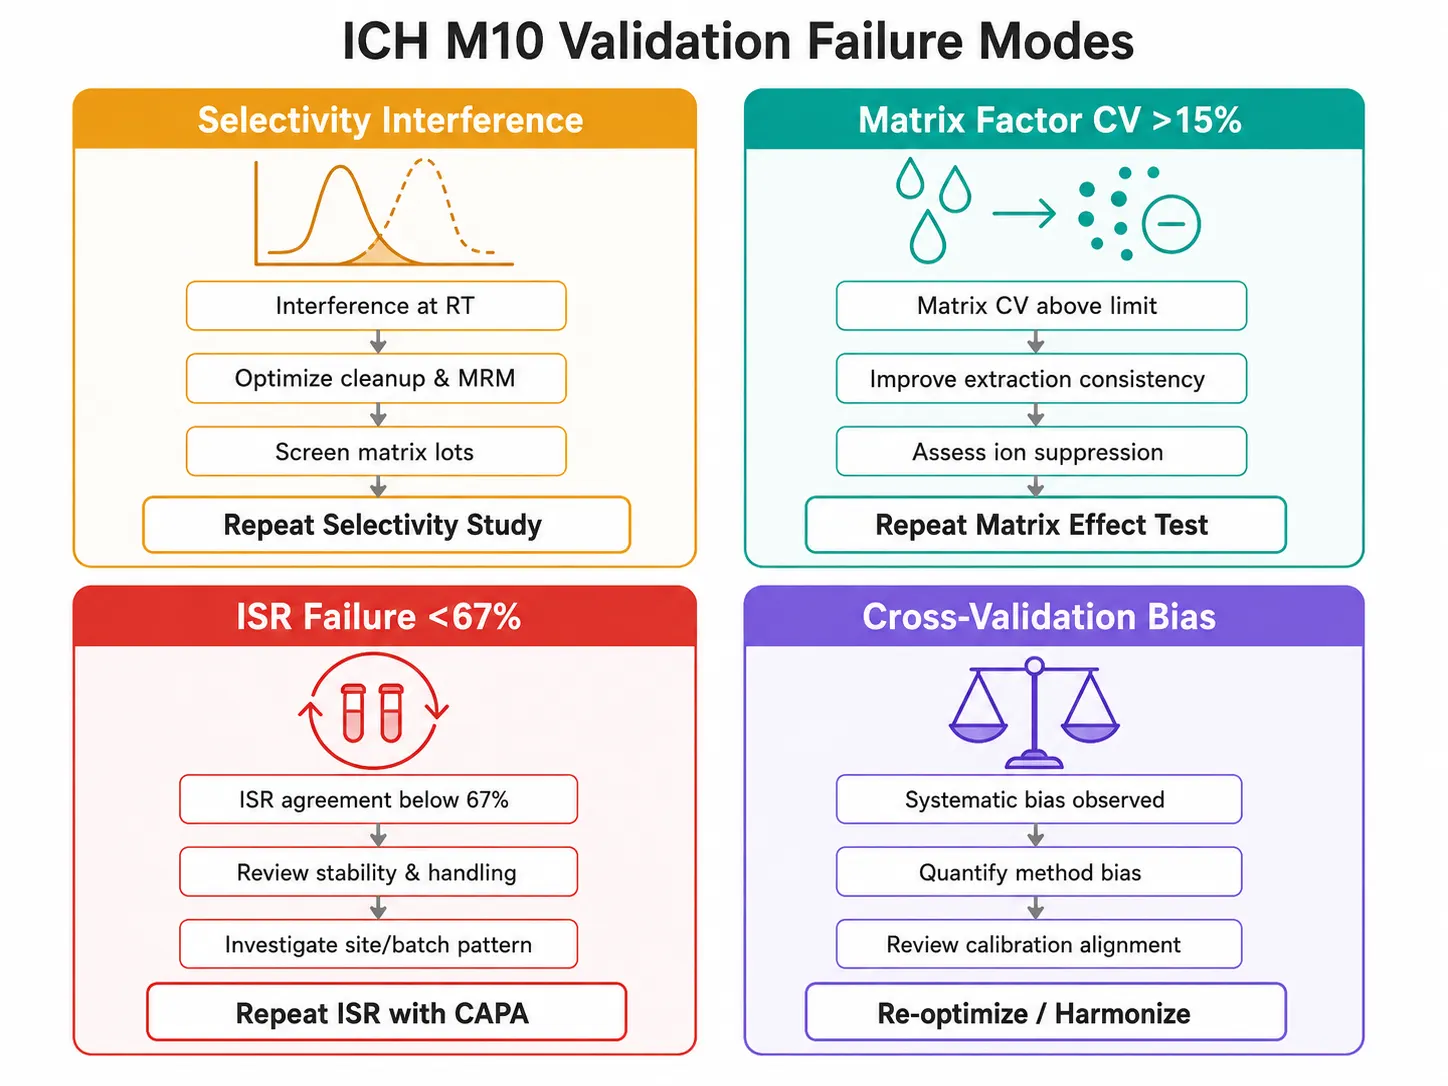 Figure 6: ICH M10 Method Validation Decision Tree — Four Common Failure Modes with Root-Cause Analysis and CAPA Pathways
Frequently Asked Questions
Do I need to re-validate all my existing methods to ICH M10?
No. ICH M10 does not retroactively invalidate existing validations. However, if a method was validated under FDA 2018 or EMA 2011 and you intend to use it in a new regulatory submission, two gaps should be addressed before filing: (1) add multi-aliquot stability data (ICH M10 requires ≥3 aliquots per time point), and (2) verify IS stock and working solution stability data is documented. These are the two items most likely to be absent from pre-M10 validations.
How is ICH M10 different from FDA 2018 BMV Guidance?
Five key differences: (1) ICH M10 defines MQC concentration as 30-50% of ULOQ rather than "mid-range"; (2) multi-aliquot stability QCs are now required; (3) IS stock and working solution stability must be explicitly documented; (4) cross-validation uses bias assessment instead of pass/fail; (5) endogenous analyte bioanalysis strategies are formally described. For most labs running LC-MS/MS methods, items 1-4 are the practical impact points.
Can I combine selectivity and specificity into one experiment?
No. ICH M10 separates them. Selectivity is tested against blank matrix (endogenous components). Specificity is tested against related substances (metabolites, isomers, co-administered drugs). The experiments use different spiking solutions and different blank matrices. The results must be reported separately in the validation report. Combining them under one heading labeled "Selectivity/Specificity" is not ICH M10-compliant.
What is the single most common ISR failure cause?
Drug or metabolite instability in the biological matrix, accounting for 61% of ISR failures. The compound degrades or interconverts between original analysis and reanalysis, producing a genuine concentration difference rather than an analytical error. The countermeasure: run preliminary stability tests before committing to a large PK study, minimize collection-to-freeze intervals, and pre-validate stability under worst-case shipping conditions.
How many matrix lots are really needed for selectivity?
Six is the ICH M10 minimum. In practice, 10 lots are standard across the industry to provide statistical confidence. Diversity matters more than count: six healthy young male volunteers are less informative than three lots from females, one from an elderly donor, one hemolyzed, and one lipemic. If the study population includes specific disease states, include those matrix types — even though ICH M10 does not explicitly require it, regulators expect justification of lot selection relative to the study population.
What happens if my ISR passes the 67% rule but shows a clear trend?
ICH M10 requires investigation of trends regardless of whether the 67% pass criterion is met. A dataset where 72% of samples pass (above the 67% threshold) but all failures are in a single direction — e.g., all reassay values are >20% above original values — is not acceptable without investigation. The trend indicates a systematic bias that may affect all samples, not just those exceeding the 20% threshold. Document the investigation and address the root cause.
References
- ICH Harmonised Guideline. Bioanalytical Method Validation and Study Sample Analysis M10. International Council for Harmonisation; 2022.
- European Medicines Agency. ICH Guideline M10 on Bioanalytical Method Validation and Study Sample Analysis. EMA/CHMP/ICH/172948/2019; 2022.
- Myler H, Evans C, Garofolo F, et al. ICH M10 Bioanalytical Method Validation Guideline — 1 Year Later. The AAPS Journal. 2024;26:103. CC BY 4.0.
- European Bioanalysis Forum. The use of surrogate matrices in bioanalytical preclinical safety testing using chromatographic methods: a recommendation from the European Bioanalysis Forum. Bioanalysis. 2024;16(19-20):1069-1079. PMC free.
- Almalki AH, Alshehri MA, Althobaiti YS, Alrobaian M, Alshehri SA, Alotaibi AM. Advancing bioanalytical method validation: a comprehensive ICH M10 approach for validating LC-MS/MS to quantify fluoxetine in human plasma. Molecules. 2024;29(19):4588. CC BY 4.0.
- Centanni M, van der Ham M, de Haan JJ, et al. Therapeutic drug monitoring of selumetinib in pediatrics: a combined LC-MS/MS and LC-HRMS approach for pharmacokinetic profiling and metabolite identification. Frontiers in Pharmacology. 2025;16:1649335. CC BY 4.0.
- Villaverde-de-Saa E, Quintana JB, Rodil R, Cela R. Evaluation of matrix effect in the determination of pharmaceuticals and personal care products in complex biological matrices by LC-MS/MS. Separations. 2023;10(3):157. CC BY 4.0.
- 16th GCC Closed Forum: ICH M10 implementation; NGS, qPCR/dPCR, flow cytometry validation; tissue biomarkers; IS response; immunogenicity harmonization; bioanalytical industry status. Bioanalysis. 2024;16(11):505-517.
- Panuwet P, Hunter RE Jr, D'Souza PE, et al. Biological matrix effects in quantitative tandem mass spectrometry-based analytical methods: advancing biomonitoring. Critical Reviews in Analytical Chemistry. 2016;46(2):93-105.
- Cortese M, Gigliobianco MR, Magnoni F, Censi R, Di Martino P. Compensate for or minimize matrix effects? Strategies for overcoming matrix effects in liquid chromatography-mass spectrometry technique: a tutorial review. Molecules. 2020;25(13):3047. CC BY 4.0.
- Bhosale V, Bagde D, Deshmukh V, et al. Method development of semaglutide and its application for bioanalysis of clinical study samples for pharmacokinetic outcome. International Journal of Pharmaceutical Sciences. 2025;3(1):1442-1448.
Disclaimer: All services and resources mentioned on this site are for research use only (RUO) and are not intended for diagnostic, therapeutic, or clinical applications.
Related Services


