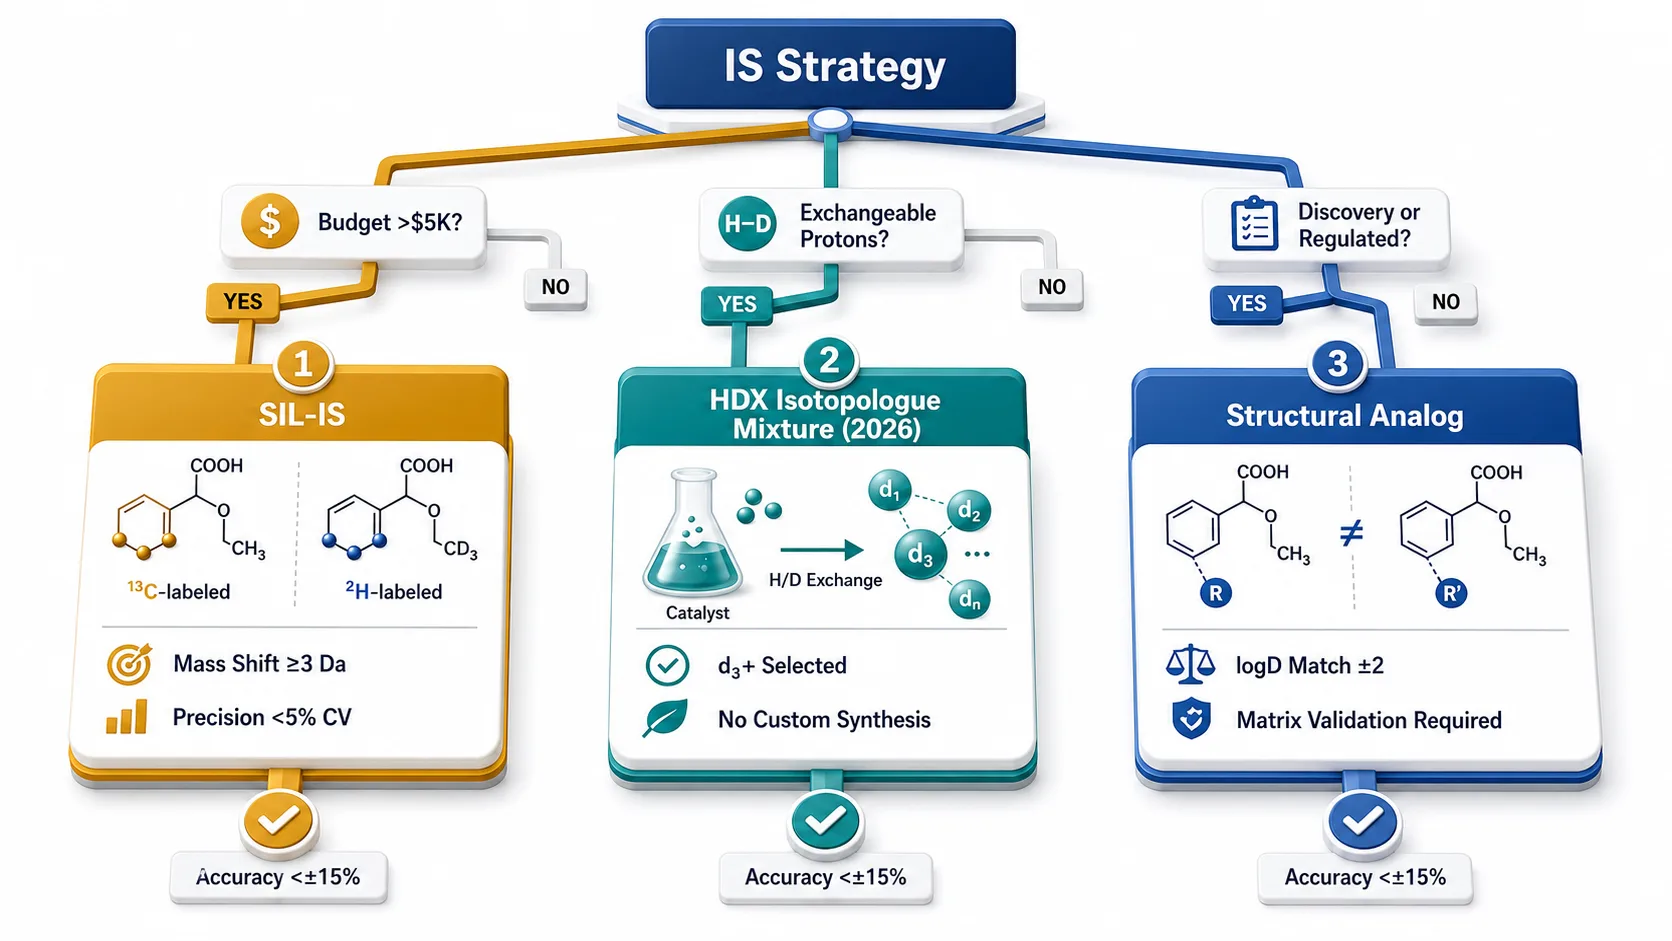
 Figure 1: IS Selection Decision Flow — SIL-IS → HDX Isotopologue → Structural Analog
Before You Touch the Instrument: The Pre-Development Checklist
Most failed method development projects share the same root cause: someone injected a compound before understanding it. The instrument is the last place a method should start.
Five molecular properties, obtainable before the first injection, shape every downstream decision. Molecular weight defines the scan range. pKa dictates ionization polarity — basic drugs (pKa > 7) for positive ESI, acidic drugs (pKa < 4) for negative. logD at physiological pH predicts retention: >1.5 sticks to C18; <0 elutes near the void and may need HILIC. Aqueous solubility and known degradation pathways (ester hydrolysis, oxidation, photodegradation) flag recovery and stability risks upfront.
These properties feed the Analytical Target Profile (ATP): required LLOQ, expected concentration range, matrix type, throughput target, and regulatory end-use. A method for 1 ng/mL LLOQ from 25 uL mouse plasma with a 3-minute runtime for discovery PK is a fundamentally different project from one targeting 0.1 ng/mL from 500 uL human plasma under full ICH M10. The former tolerates protein precipitation and partial validation; the latter demands SPE and documented stability across every condition the clinical sample will experience. The ATP answers "what does good look like?" — and makes explicit the gap between where you are and where you need to be. Filling it out takes 30 minutes. Skipping it costs weeks.
Mass Spectrometry Optimization: Building the Detection Foundation
Method development begins at the mass spectrometer because the MS defines what can be detected. Without adequate sensitivity and selectivity at the detector, no amount of chromatographic optimization will rescue the method.
Infusion Tuning. Dissolve the analyte at 100-500 ng/mL in 50:50 water:acetonitrile with 0.1% formic acid, infuse at 5-10 uL/min. In positive mode, [M+H]+ is the default. Avoid Na+ or K+ adducts even if they appear more abundant — their formation is unpredictable. If [M+H]+ is weak, try [M+NH4]+. In negative mode, [M-H]− is standard. Fragmentor voltage (declustering potential) is ramped in 20 V increments from 60 to 200 V; the optimum maximizes precursor transmission without in-source fragmentation.
Collision energy (CE) is optimized by ramping 10-50 eV in 5 eV steps. Select the most abundant product ion as the quantifier; if two have similar intensity, the higher m/z produces less chemical noise. A second product ion serves as the qualifier — the quantifier-to-qualifier ratio confirms analyte identity against isobaric interferences. Source parameters (capillary 2.5-3.5 kV, desolvation 350-500degC, gas flows vendor-dependent) are set via autotune. Optimize for signal-to-noise, not absolute signal — a parameter that boosts signal by 20% but noise by 50% is a net loss.
QQQ vs. HRMS. A growing number of labs map fragmentation pathways on a Q-TOF or Orbitrap (mass error <3 ppm, unambiguous elemental composition) before transferring optimized MRM transitions to QQQ for routine quantification. The two-platform workflow adds a day but eliminates the risk of monitoring the wrong transition. For the complete LC-MS/MS quantification workflow from method setup through data processing, see our comprehensive guide on single-drug quantification by LC-MS/MS.
Internal Standard Strategy: The Make-or-Break Decision
The internal standard corrects for three independent variability sources: extraction recovery, injection precision, and ionization efficiency drift. A properly chosen IS tracks all three. A poorly chosen IS converts these directly into concentration error.
SIL-IS: The Gold Standard. A 13C3-6 or 2H3-8 labeled analog, mass-shifted by ≥3 Da, sits outside the analyte's natural isotopic envelope, preventing cross-talk. Because SIL-IS co-elutes with the analyte (Δt <0.03 min for 13C, ~0.03 min earlier for 2H), it experiences the identical matrix environment. Precision below 5% CV is routine. Limitations: custom 13C6 synthesis costs $5,000-$25,000 with 4-12 week lead times — prohibitive for discovery programs screening dozens of compounds. Deuterated IS carries a subtle liability: the deuterium isotope effect shifts retention 0.02-0.05 minutes, and if a sharp suppression gradient exists at that retention time, the IS and analyte experience different matrix effects. 13C/15N labels avoid this entirely.
Structural Analog IS: When It Is the Right Call. A structural analog should match the analyte's ionizable group, have logD within 1-2 units, and elute within 0.5-1.0 min. Suitable when (a) discovery-phase ±15-20% accuracy is acceptable, or (b) the analog's matrix tracking has been validated across ≥6 lots. Without validation, analog IS can produce 25-40% matrix effect compensation errors versus <15% for SIL-IS.
The 2026 Alternative: HDX-Derived Isotopologue Mixtures. Guo et al. (J Chromatogr A, 2026) turned hydrogen-deuterium exchange's traditional weakness — d1-dn mixtures rather than a single pure-labeled compound — into an advantage. Catalytic HDX with Pd/C or Pt/C in CD3OD generates isotopologue distributions from exchangeable protons on the analyte scaffold. By selecting only d3+ species (Δm ≥3 Da), the IS pool co-elutes with the analyte (<0.01 min shift) with no appreciable chromatographic isotope effect. Across eight structurally diverse compounds — colchicine, monocrotaline, vincamine, berberine, lycorine, gelsemine, hyoscyamine, and clenbuterol — the method delivered linearity R2 ≥0.995, LOQ 0.01-0.25 ng/mL, and trueness 85-115%. Using clenbuterol as a benchmark, the HDX mixture matched commercial clenbuterol-d9 performance, reducing quantitative deviation from 15-25% to below 8%. For labs without SIL-IS budget, this is a practical 2026 alternative that requires no custom synthesis. For programs with novel chemical entities requiring full IS strategy development, our custom LC-MS/MS method development for novel chemical entities includes IS screening and optimization as an integral part of method build.
IS Timing and Failure Modes. Add IS before any sample handling step so it corrects the entire process. The most insidious failure is collision energy (CE) mismatch between analyte and IS: a 2026 Talanta study documented 15-92% instrument-specific bias from CE inconsistency, causing >90% deviation in external quality assessments despite ostensibly "validated" methods. Verify CE consistency during development and after every major instrument maintenance. Other failures: IS degradation releasing unlabeled analyte (inflating LLOQ concentrations), IS concentration set too low, and IS lot-to-lot isotopic purity variation >5%.
Sample Preparation Strategy: PPT, LLE, or SPE?
Sample preparation removes proteins, phospholipids, salts, and endogenous interferences from the biological matrix. It is the single highest-impact method development decision — a poor choice cannot be rescued downstream.
Start with Protein Precipitation. PPT — 3-4 volumes of acetonitrile or methanol, vortex, centrifuge at 14,000g for 10 minutes — processes a 96-well plate in under 30 minutes. If recovery ≥85% and LLOQ >5 ng/mL in plasma with SIL-IS, stop here. PPT is the correct answer for most discovery methods.
When PPT Is Not Enough. PPT leaves behind phospholipids that suppress early-eluting analytes by 30-50%. Two paths: evaporate and reconcentrate (2-5x LLOQ improvement in 30 minutes), or escalate the sample preparation.
Liquid-Liquid Extraction. LLE partitions the analyte between aqueous sample and water-immiscible organic solvent. MTBE suits moderate polarity; hexane:EtOAc suits non-polar; dichloromethane handles intermediate polarity. LLE is preferred when logD >1.5, a structural analog IS is used, or emulsion-prone samples need processing. Supported liquid extraction (SLE) — diatomaceous earth bed in 96-well format — eliminates emulsions and enables automation.
Solid-Phase Extraction. SPE passes sample through a selective sorbent. Mixed-mode polymeric SPE (RP + ion-exchange) achieves >95% phospholipid removal — the Chambers et al. (2007) benchmark. Loading 200 uL plasma and eluting in 50 uL provides 4x concentration. SPE is mandatory when LLOQ <0.5 ng/mL, the matrix is dirty (tissue/bile/feces), logD <0 (LLE fails), or ICH M10 matrix effect CV ≤15% is required.
The Decision Tree. Branch on logD: >1.5 → LLE or SLE. <0 → SPE (ion-exchange) or PPT + SIL-IS. Branch on LLOQ: >5 ng/mL → PPT. 0.5-5 ng/mL → LLE or SPE. <0.5 ng/mL → SPE with concentration. Branch on matrix: plasma/serum → PPT + SIL-IS or LLE. Tissue/bile/feces → SPE mandatory. Branch on stage: discovery → PPT for speed. IND-enabling → SPE or LLE for robustness. For analytes requiring custom extraction protocol development, our sample preparation method development services systematically evaluate PPT, LLE, SPE, and SLE workflows to identify the optimal protocol for each analyte-matrix combination.
For a deeper treatment of matrix effect mechanisms — including post-column infusion protocols, phospholipid profiling, and lot-to-lot variability strategies — see our dedicated guide on bioanalytical matrix effect evaluation and mitigation.
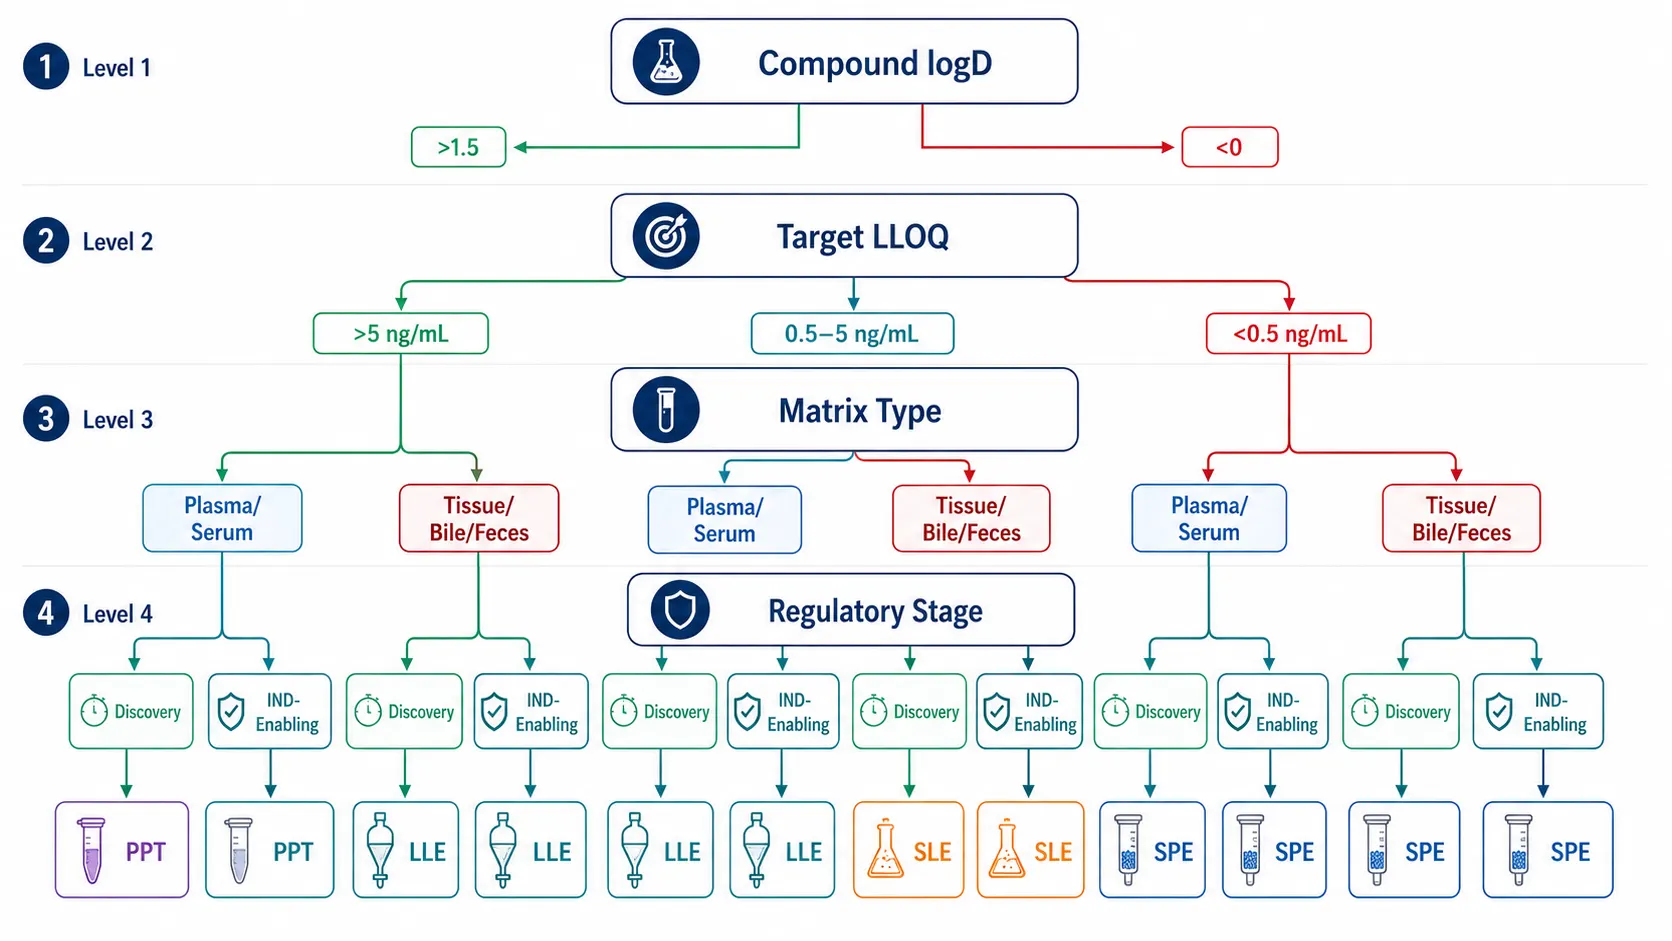 Figure 2: Sample Preparation Decision Tree — Four-Path Branching
Chromatographic Method Development: From First Injection to Optimized Separation
Start with the Default. For >80% of small molecules: C18 column (50 x 2.1 mm, 1.7-3.0 um), water/acetonitrile + 0.1% formic acid, 5-95% B gradient over 3-5 min, 0.3-0.5 mL/min, 30-40degC. This works for most basic and neutral drugs and provides a calibrated baseline for systematic optimization — every deviation from the default should have a documented reason.
A practical reference point: a typical kinase inhibitor (MW ~500, logD ~2.5, pKa ~8) on a 2.1 x 50 mm C18 column at 0.4 mL/min with a 5-95% ACN gradient over 4 minutes will elute at approximately 2.5-3.0 minutes. If your compound elutes substantially earlier or later, one of the five pre-development numbers is telling you something about its physicochemical character — and that insight should guide column and gradient selection.
No Retention? If the analyte elutes before 1.0 min (k' <2), it lands in the solvent-front suppression zone. Reduce initial organic percentage first. If 5% B still doesn't retain, switch to phenyl-hexyl (pi-pi for aromatics) or embedded-polar C18. If logD <−1, switch to HILIC — but re-evaluate sensitivity and matrix effects after the column chemistry change.
Poor Peak Shape? Tailing (asymmetry >1.5) = silanol interactions. Increase FA to 0.2-0.5%, add 2-10 mM ammonium formate, check pH compatibility. If persistent, switch to high-purity end-capped C18 or hybrid particles.
Co-Eluting Interferences? Adjust gradient slope first (cheapest fix). If unsuccessful, switch column selectivity: phenyl-hexyl for aromatics, C8 for weaker retention, PFP for halogenated and polar compounds.
Injection Solvent Matters. Match the injection solvent's organic percentage to the starting gradient. Injecting 100% ACN into 5% ACN broadens early peaks. Dilute high-organic extracts with aqueous mobile phase before injection.
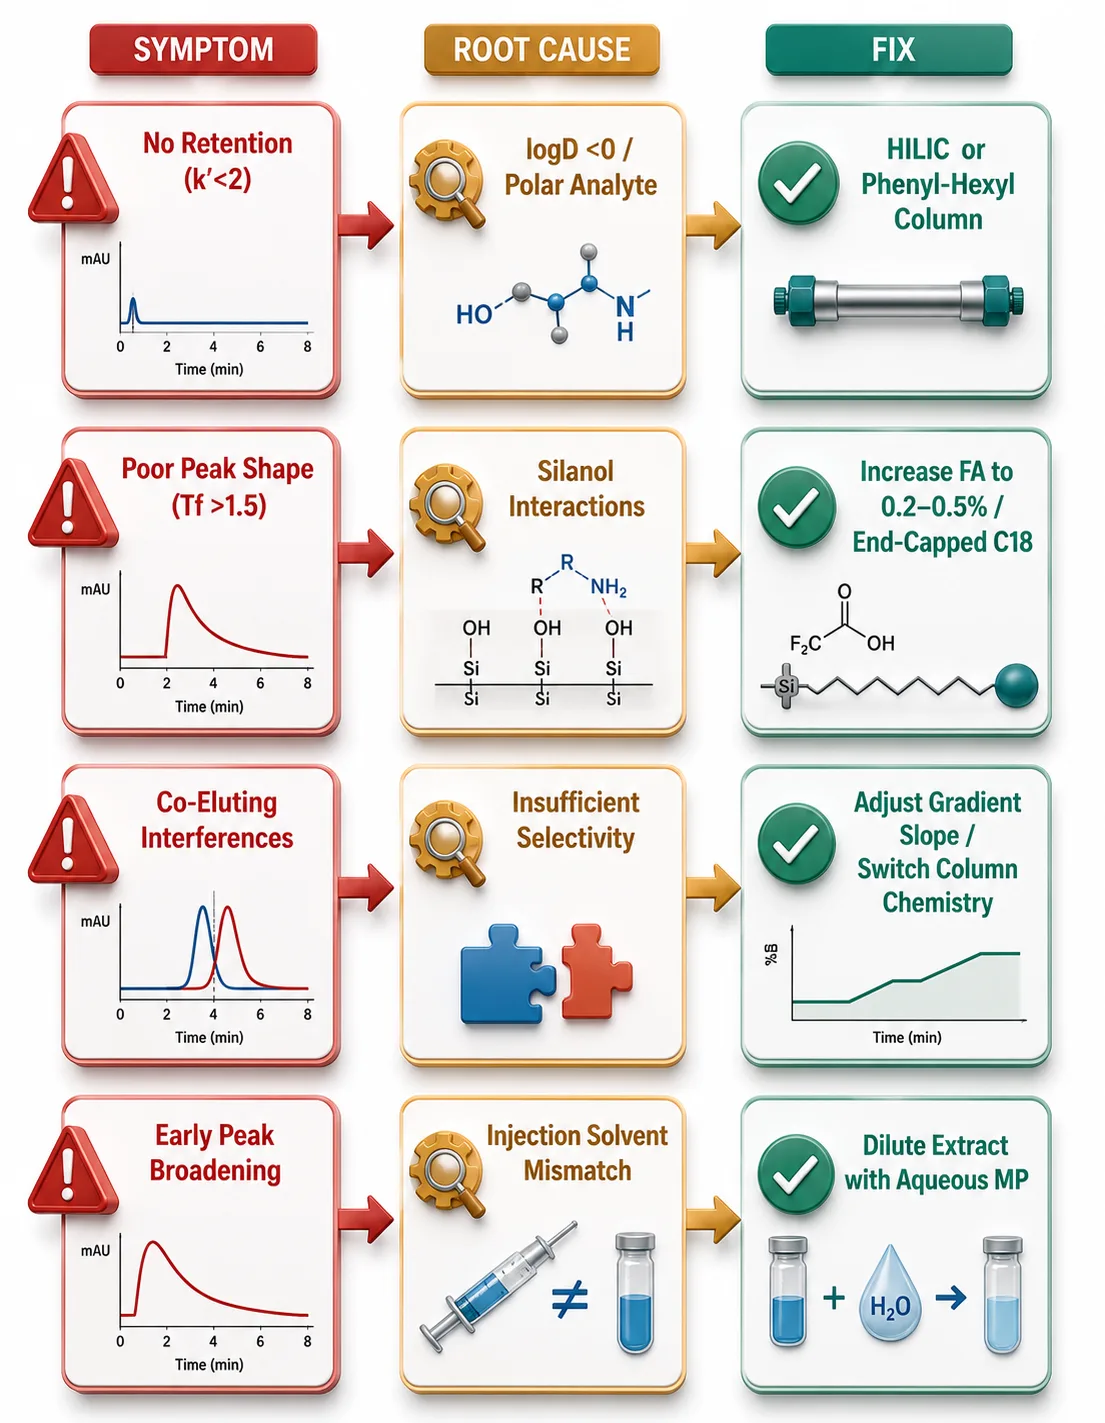 Figure 3: Chromatographic Troubleshooting Flowchart — Symptom → Root Cause → Fix
Method Qualification: The Pre-Validation Gate
Full ICH M10 validation consumes 2-4 weeks. Method qualification — a focused one-day pre-validation screen — catches fatal flaws before that investment is wasted.
Accuracy and Precision Pre-Check. Three QC levels, n=5, one batch. If any level exceeds ±15% or 15% CV, the method is not ready. This single experiment reveals whether the calibration model, sample preparation, and detection are fundamentally sound.
Selectivity Screen. Six individual blank matrix lots. Response at analyte RT must be <20% of LLOQ. A single outlying lot may be acceptable if identified and excluded; interference across multiple lots demands chromatographic or MS fixes — adjusting gradient or switching column chemistry.
Matrix Effect Screen. Six lots, low and high QC. IS-normalized MF CV must be ≤15%. For structural analog IS methods, this is the most likely failure point. If the CV exceeds the threshold, the escalation path is clear: PPT → LLE or SLE for moderate improvement, PPT → SPE for maximum matrix removal, or structural analog IS → SIL-IS for compensation rather than removal.
Short-Term Stability and Carryover. Verify bench-top (4-24 h) and autosampler (≥batch duration) stability. Stability failures signal a labile compound — adjust the protocol with shorter bench time, chilled autosampler, or stabilizing agents before proceeding. Carryover: blank after ULOQ must be <20% of LLOQ response. If carryover exceeds the limit, escalate needle wash (higher organic, acidified), add post-ULOQ blanks, or switch to PEEK components.
Go/No-Go. If all pre-checks pass, proceed to full validation. Any failure means return to development. Full validation with known issues wastes weeks.
Full Method Validation: ICH M10 Parameters with Practical Execution Notes
ICH M10 (2022, now fully in effect globally) harmonizes bioanalytical method validation. Below are the core parameters with practical execution notes — not a reprint of the guideline, but what actually matters at the bench.
Calibration Curve. Six to eight non-zero standards in study matrix. ≥75% must back-calculate within ±15% (±20% at LLOQ). 1/x2 weighting corrects for heteroscedasticity without overcorrecting the low end. Quadratic regression is acceptable when nonlinearity is inherent but needs justification.
Accuracy and Precision. Four QC levels, three runs over ≥2 days, five replicates per QC per run. Acceptance: ±15% (±20% at LLOQ), CV ≤15% (≤20% at LLOQ). Mid QC is most diagnostic — if it passes while low QC fails, the problem is sensitivity. If it passes while high QC fails, suspect detector saturation.
Selectivity vs. Specificity. ICH M10 distinguishes selectivity (measuring analyte in the presence of expected interferences — metabolites, co-medications) from specificity (unequivocal measurement of analyte alone). Six individual lots for selectivity; blank response <20% LLOQ and <5% IS for specificity.
Matrix Effect. Six lots, two levels. IS-normalized MF CV ≤15%. A 2025 shift: ICH M10 moves toward QC accuracy-based assessment — if accuracy/precision pass in multiple lots, matrix effect is considered acceptable regardless of individual MF values.
Stability Suite. Bench-top (expected handling duration), freeze-thaw (≥3 cycles, ≥12 h freezing — shorter intervals don't fully freeze the matrix), autosampler (≥batch duration), long-term frozen (−20degC or −70degC), stock solution. All ±15% of nominal. Freeze-thaw with inadequate freezing duration is a common false-pass.
Dilution Integrity and ISR. Validate the maximum dilution factor (QC above ULOQ, diluted, analyzed — ±15%). ISR: Re-analyze 5-10% of study samples; ≥2/3 must agree within ±20%. ISR failures typically trace to sample inhomogeneity, metabolite back-conversion, or inconsistent processing.
For a focused walkthrough of ICH M10 requirements with full acceptance criteria checklists and common compliance pitfalls, see our ICH M10 bioanalytical method validation guide. Our full and partial method validation services cover all ICH M10 parameters with documented SOPs and independent QA review.
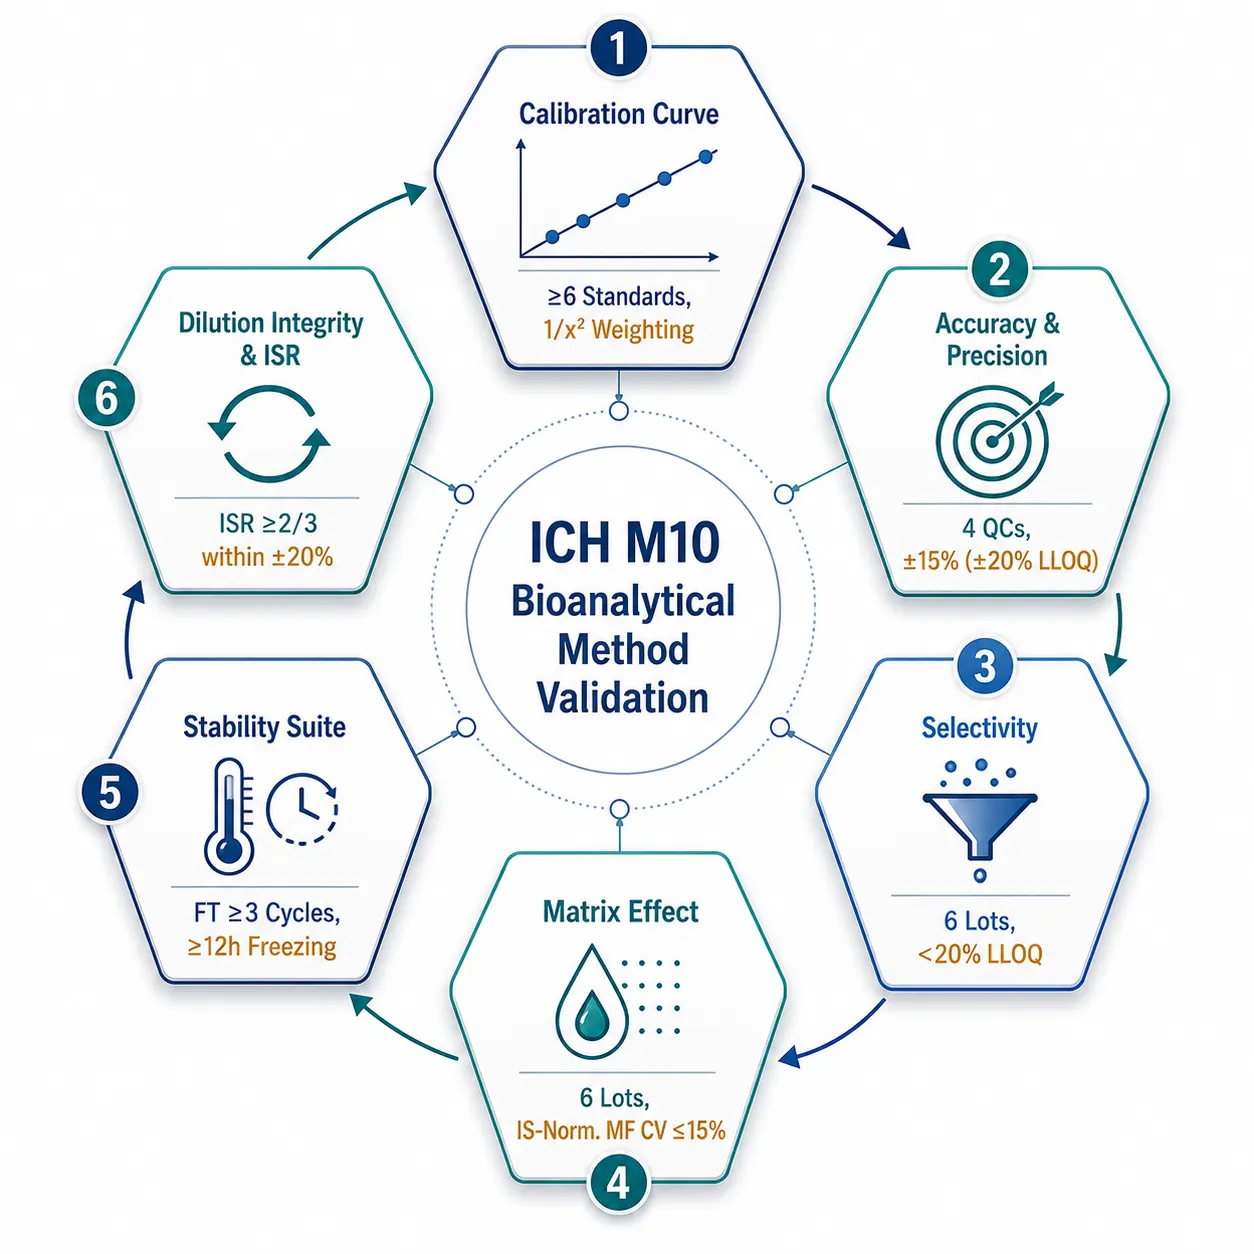 Figure 4: ICH M10 Validation Parameter Overview — Execution Sequence Layout
Common Method Development Failures and How to Prevent Them
The difference between an experienced bioanalytical scientist and a novice is not that the experienced one makes fewer mistakes — it is that they recognize failure patterns before they happen.
CE Mismatch Between Analyte and IS. When collision energy settings differ between the analyte and IS MRM transitions, the internal standard cannot fully track the analyte's behavior — a problem that instrument aging and collision cell degradation dramatically amplify. The Talanta 2026 study (Vol. 308) documented 15-92% instrument-specific quantitative bias from CE mismatch. In external quality assessments, progesterone measurements in "fully validated" methods deviated by >90% between laboratories — traced directly to CE inconsistency. The mechanism: as collision cells age, their actual CE drifts from the setpoint, and the drift differs between low-mass and high-mass transitions typically used for analyte and IS. The fix: verify CE consistency during method development by acquiring both transitions at identical CE and comparing the response ratio to the optimized-CE ratio. Re-verify after every collision cell maintenance or replacement.
IS Batch Variation. Different lots of SIL-IS can have different isotopic purity (98% vs. 99.5% 13C enrichment), changing the effective IS concentration. A 1.5% purity difference produces a corresponding shift in calibration curve slope. Screen each new IS lot against the previous lot by analyzing QC samples with both IS solutions in parallel. If the QC bias shifts by more than 5%, the IS lot must be independently quantified or the calibration must be re-established.
Inadequate Freeze-Thaw Interval. A stability protocol that specifies "≥3 freeze-thaw cycles" without enforcing the freezing duration produces false negatives. A sample that spends 2 hours in a −20degC freezer does not reach core freezing temperature — enzymatic degradation continues. The fix: enforce a minimum 12-hour freezing interval per cycle and log the freezer temperature. The difference between "frozen" and "equilibrated at −20degC" is a stability failure waiting to surface.
Undocumented Manual Integration. Every analyst has, at some point, manually adjusted a peak baseline that the auto-integrator got wrong. The audit problem: undocumented manual integrations look like data manipulation. The fix: define integration parameters (peak width, threshold, baseline type, smoothing) in the method SOP. Document every manual integration — which sample, which peak, why the auto-integrator failed, and what was changed. An audit trail that shows consistent, justified manual interventions is acceptable; one that shows undocumented changes is a finding.
Carryover from Inadequate Wash. The standard 50:50 methanol:water needle wash leaves behind hydrophobic compounds that appear in subsequent blank injections. If carryover exceeds 20% of LLOQ, escalate the wash: 80:20 acetonitrile:water with 0.1% formic acid, followed by a stronger organic flush. If carryover persists, the compound is adsorbing to metal or plastic surfaces — switch to PEEK sample loops, silanized glass inserts, or add a surfactant to the wash solvent.
Nonspecific Binding. Hydrophobic and lipophilic compounds — particularly those with logD >3 — adsorb to polypropylene tubes, pipette tips, and autosampler vial surfaces. At concentrations below 1 ng/mL, this adsorption can deplete the analyte by 30-50% before it reaches the column, producing apparent low recovery that is actually loss to plastic, not poor extraction. Detection is straightforward: spike analyte at low and high concentrations, process normally, then re-extract the empty tube with a strong solvent and measure residual analyte. If significant residual is detected, switch to low-binding consumables (siliconized or protein-coated), add 0.05-0.1% BSA or Tween-20 as a carrier to the diluent, or use silanized glass containers. The key insight: nonspecific binding is concentration-dependent — it disproportionately affects low-concentration samples, creating a nonlinear bias that calibration curves prepared in the same consumables may mask.
The Method Lifecycle: Development Is Not the End
A validated method is a living document. Between the validation report and the last study sample, it passes through transfer, monitoring, and re-validation.
Method Transfer. Cross-validation between labs uses identical acceptance criteria (±15%, ≤15% CV). Different instrument models with different ESI source geometries can produce different matrix effect profiles — if cross-validation fails, compare matrix factors and adjust the gradient accordingly.
In-Use Monitoring. System suitability tests at each batch start track retention time, peak shape, and signal intensity. Column degradation is gradual — broadening peaks and rising backpressure signal replacement is needed. Reagent lot changes (formic acid, ammonium formate, solvents) can shift retention or introduce background ions.
Re-Validation Triggers. Matrix species change, anticoagulant change (EDTA → heparin), instrument platform change, calibration range change, and column dimension or stationary phase change all require re-validation.
Continuity Across Stages. A discovery rat PK method can carry its core MRM transitions forward to dog toxicokinetics and human clinical PK, but each matrix and regulatory stage needs incremental validation. A method that begins as a 3-minute rat plasma PPT assay with partial validation may, over three years, evolve into a fully validated 5-minute human plasma SPE method supporting a Phase III trial — different extraction, different matrix, different regulatory standard, but the same MRM transitions and chromatographic backbone. Document the method's complete history — every modification, matrix, and validation supplement — in a single development report that tells the full story from first injection to regulatory submission. For programs transitioning methods between discovery and development stages, our bioanalytical method development and validation services provide end-to-end support from first injection through regulatory submission.
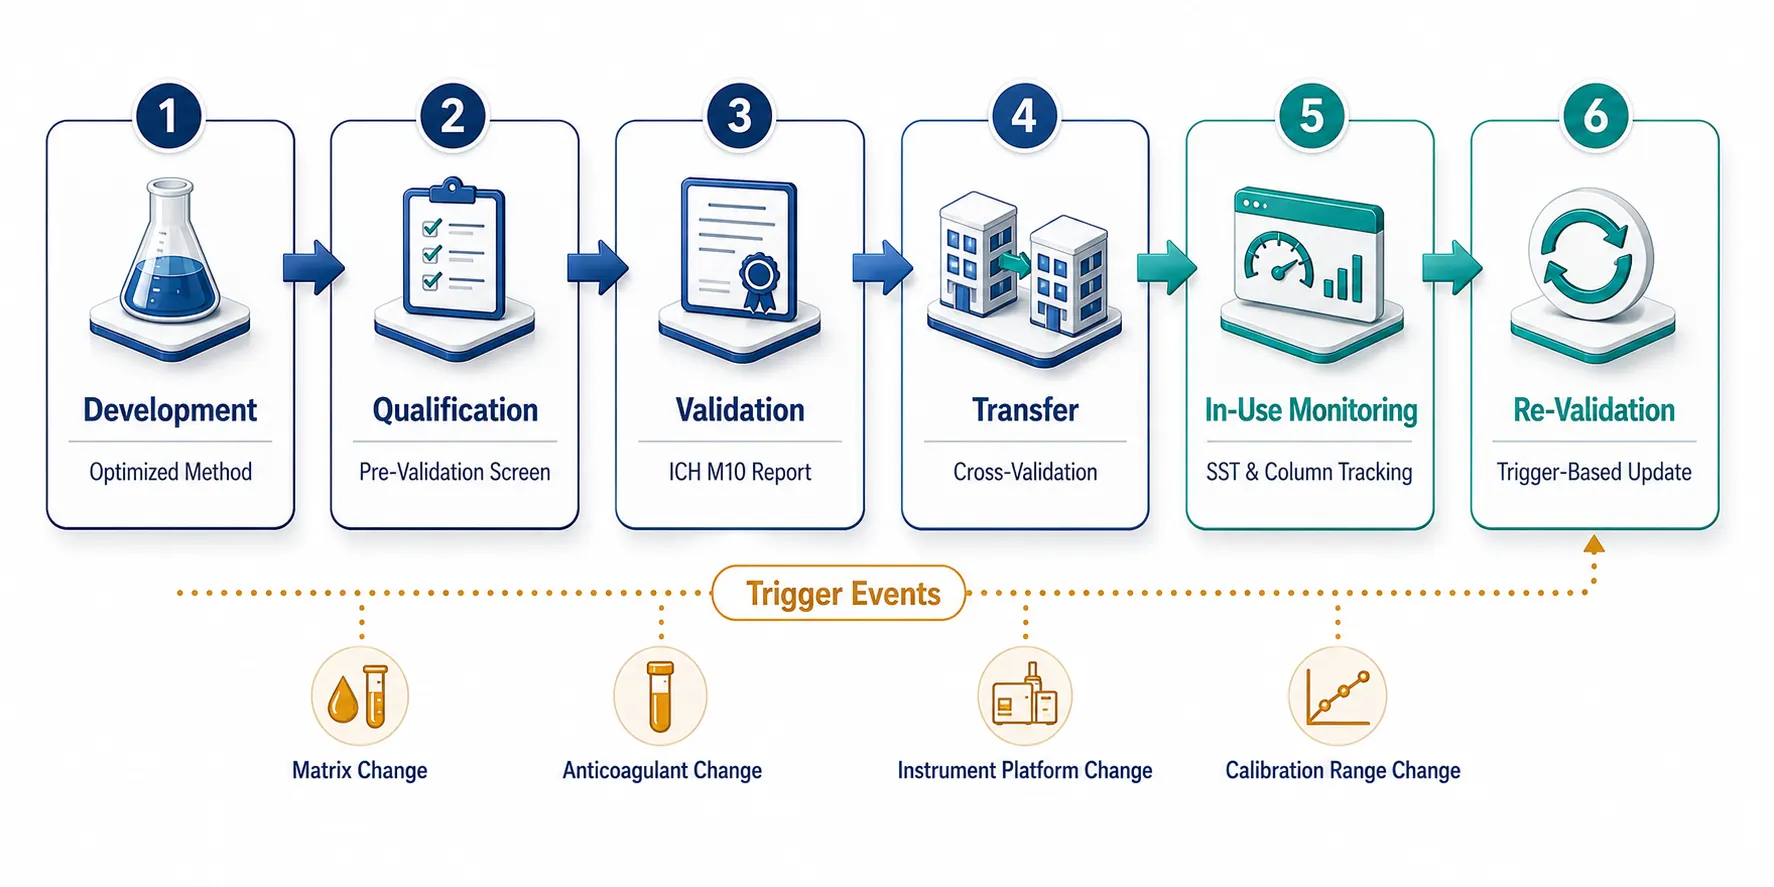 Figure 5: Method Lifecycle Timeline — Development → Re-Validation
What Is Changing: 2026 Technology Trends in Method Development
Five developments are reshaping how bioanalytical methods are built — all deployed today.
AI-Assisted Data Processing. Shimadzu Peakintelligence and SCIEX OS 5.0 automate peak integration and anomaly detection, reducing manual chromatogram review by up to 67%. SCIEX's 2026 natural-language querying lets analysts ask "show me all samples where IS response dropped >30%." The regulatory question — validating AI-driven integration under ICH M10 — is still being answered.
LC-Free Screening. The Echo MS+ system uses acoustic ejection to transfer nanoliter samples directly into the MS — no LC, 1 sample/second. For discovery screening, it eliminates the chromatography bottleneck. Trade-off: no separation means matrix effects are unresolvable. It complements, not replaces, LC-MS/MS.
Microflow LC. 1.0 mm ID columns concentrate analyte into a smaller ESI spray, improving sensitivity 2-5x while cutting solvent 75%. Combined with MaxPeak surfaces that minimize metal-analyte interactions, microflow bridges the gap between analytical-scale robustness and nanoflow sensitivity.
Automated Sample Preparation. Positive-pressure 96-well SPE processors with automated liquid handlers enable 24/7 unattended operation. The quality gain matches the throughput gain: automation eliminates between-analyst variability.
New Modalities. PROTACs, oligonucleotides, and ADCs each demand fundamentally different method development approaches — ion-pairing chromatography for charged backbones, LBA-LC-MS/MS hybrid workflows for ADCs. Labs investing in these capabilities now will be the default partners at clinical entry.
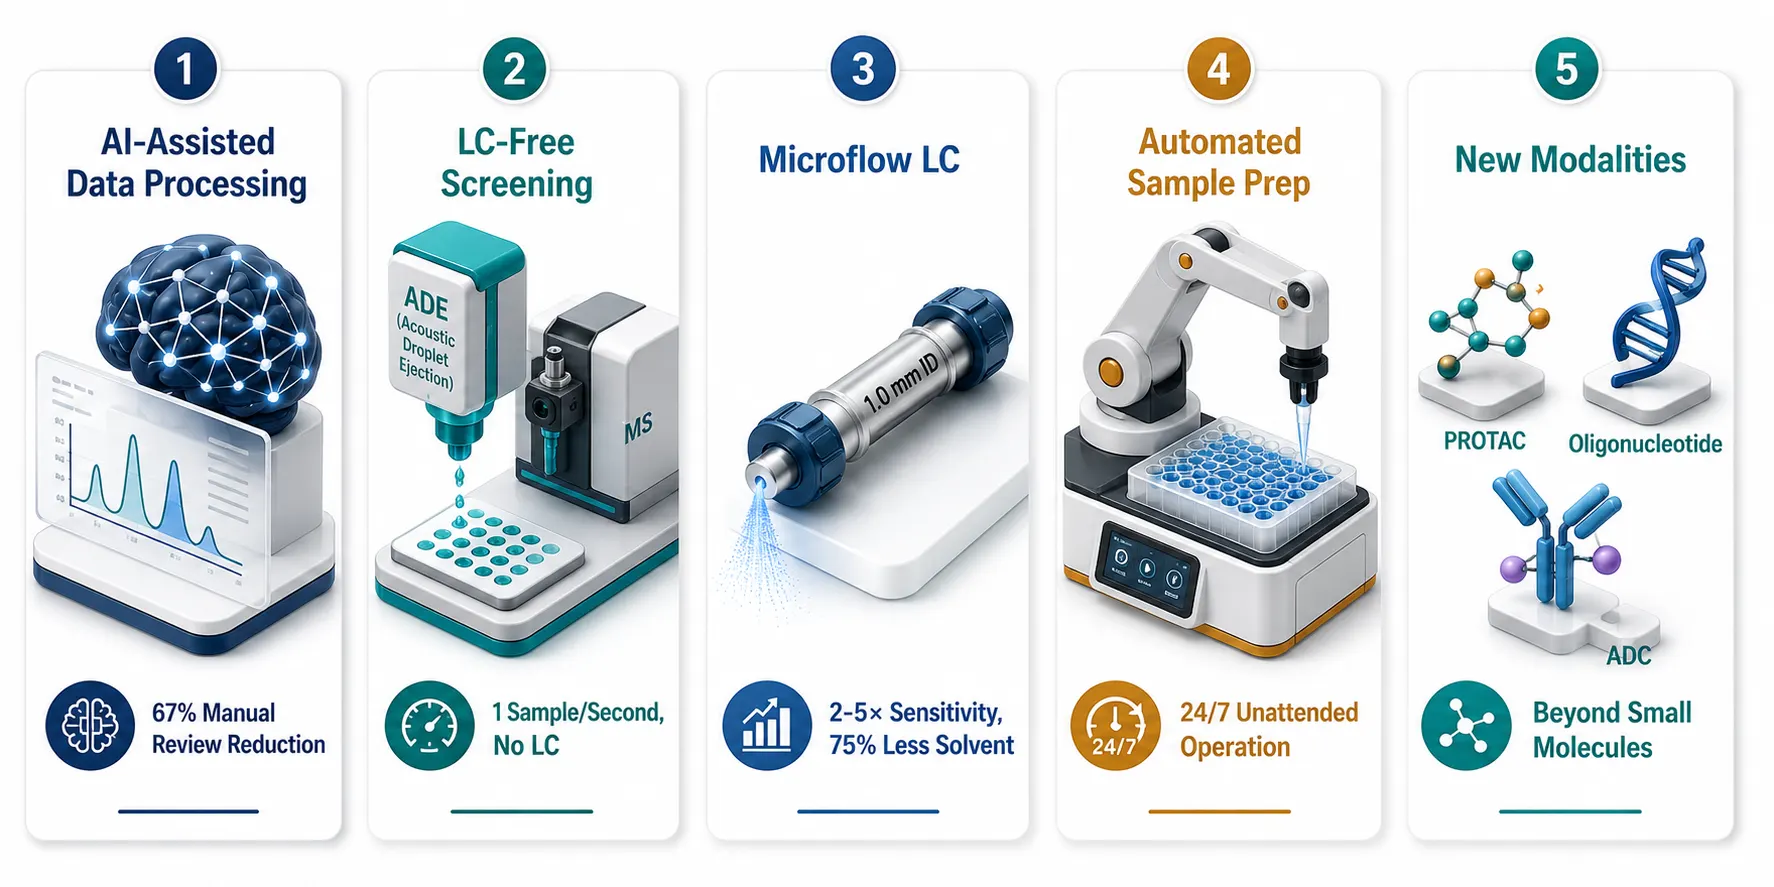 Figure 6: 2026 Method Development Technology Landscape — Five-Pillar Innovation Map
Frequently Asked Questions
How long does it take to develop a bioanalytical method from scratch?
A fit-for-purpose discovery method: 1-2 weeks. A fully validated ICH M10-compliant method with real-time stability: 4-8 weeks. Long-term frozen storage stability is usually the limiting step.
What is the minimum sample volume for a robust LC-MS/MS method?
50-100 uL for standard PPT on a 2.1 mm column. Microsampling (DBS, VAMS) works with 10-30 uL. SPE can process 200-500 uL and concentrate to improve LLOQ. Microflow LC reduces volume requirements further.
When can I skip full validation and use a fit-for-purpose approach?
When data supports internal decisions only — discovery screening, lead ranking, early ADME. If the data appears in an IND, NDA, or ANDA, full ICH M10 validation is mandatory.
What is the most common reason methods fail validation?
Matrix effects — IS-normalized MF CV >15% across lots. Root cause is usually PPT where SPE was needed, or structural analog IS where SIL-IS was required. Second: inadequate stability from freeze-thaw cycles that were too short.
Can I use the same method for plasma and tissue samples?
Same MRM transitions and chromatography, but cross-validate in each matrix. Tissue has higher phospholipid content and different protein composition — matrix effects differ. At minimum, validate matrix effect and accuracy/precision per tissue type.
When should I choose HRMS over triple quadrupole for quantification?
QQQ for routine quantification of known analytes — superior dynamic range and reproducibility. HRMS (Q-TOF, Orbitrap) for retrospective metabolite ID alongside quantification, when authentic standards are unavailable, or during method development to confirm MRM transitions before QQQ transfer.
References
- ICH Harmonised Guideline. Bioanalytical Method Validation and Study Sample Analysis M10. International Council for Harmonisation; 2022.
- Guo P, Liu Y, Liu G, Ma M, Chen B. An isotopologue-mixture-based internal standard strategy for LC-MS/MS quantification in plasma. Journal of Chromatography A. 2026.
- Chambers E, Wagrowski-Diehl DM, Lu Z, Mazzeo JR. Systematic and comprehensive strategy for reducing matrix effects in LC/MS/MS analyses. Journal of Chromatography B. 2007;852(1-2):22-34.
- Matuszewski BK, Constanzer ML, Chavez-Eng CM. Strategies for the assessment of matrix effect in quantitative bioanalytical methods based on HPLC-MS/MS. Analytical Chemistry. 2003;75(13):3019-3030.
- Viswanathan CT, Bansal S, Booth B, et al. Quantitative bioanalytical methods validation and implementation: best practices for chromatographic and ligand binding assays. Pharmaceutical Research. 2007;24(10):1962-1973.
- Van Eeckhaut A, Lanckmans K, Sarre S, Smolders I, Michotte Y. Validation of bioanalytical LC-MS/MS assays: evaluation of matrix effects. Journal of Chromatography B. 2009;877(23):2198-2207.
- European Medicines Agency. Guideline on Bioanalytical Method Validation. EMEA/CHMP/EWP/192217/2009 Rev. 1 Corr. 2. European Medicines Agency; 2011.
- Timmerman P, Lowes S, Fast DM, et al. Request for global harmonization of the guidance for bioanalytical method validation and sample analysis. Bioanalysis. 2010;2(4):683-686.
- Li W, Zhang J, Tse FLS. Strategies in quantitative LC-MS/MS analysis of unstable small molecules in biological matrices. Biomedical Chromatography. 2011;25(1-2):258-277.
- Korfmacher WA. Foundation review: principles and applications of LC-MS in new drug discovery. Drug Discovery Today. 2005;10(20):1357-1367.
Disclaimer: All services and resources mentioned on this site are for research use only (RUO) and are not intended for diagnostic, therapeutic, or clinical applications.
Related Services


