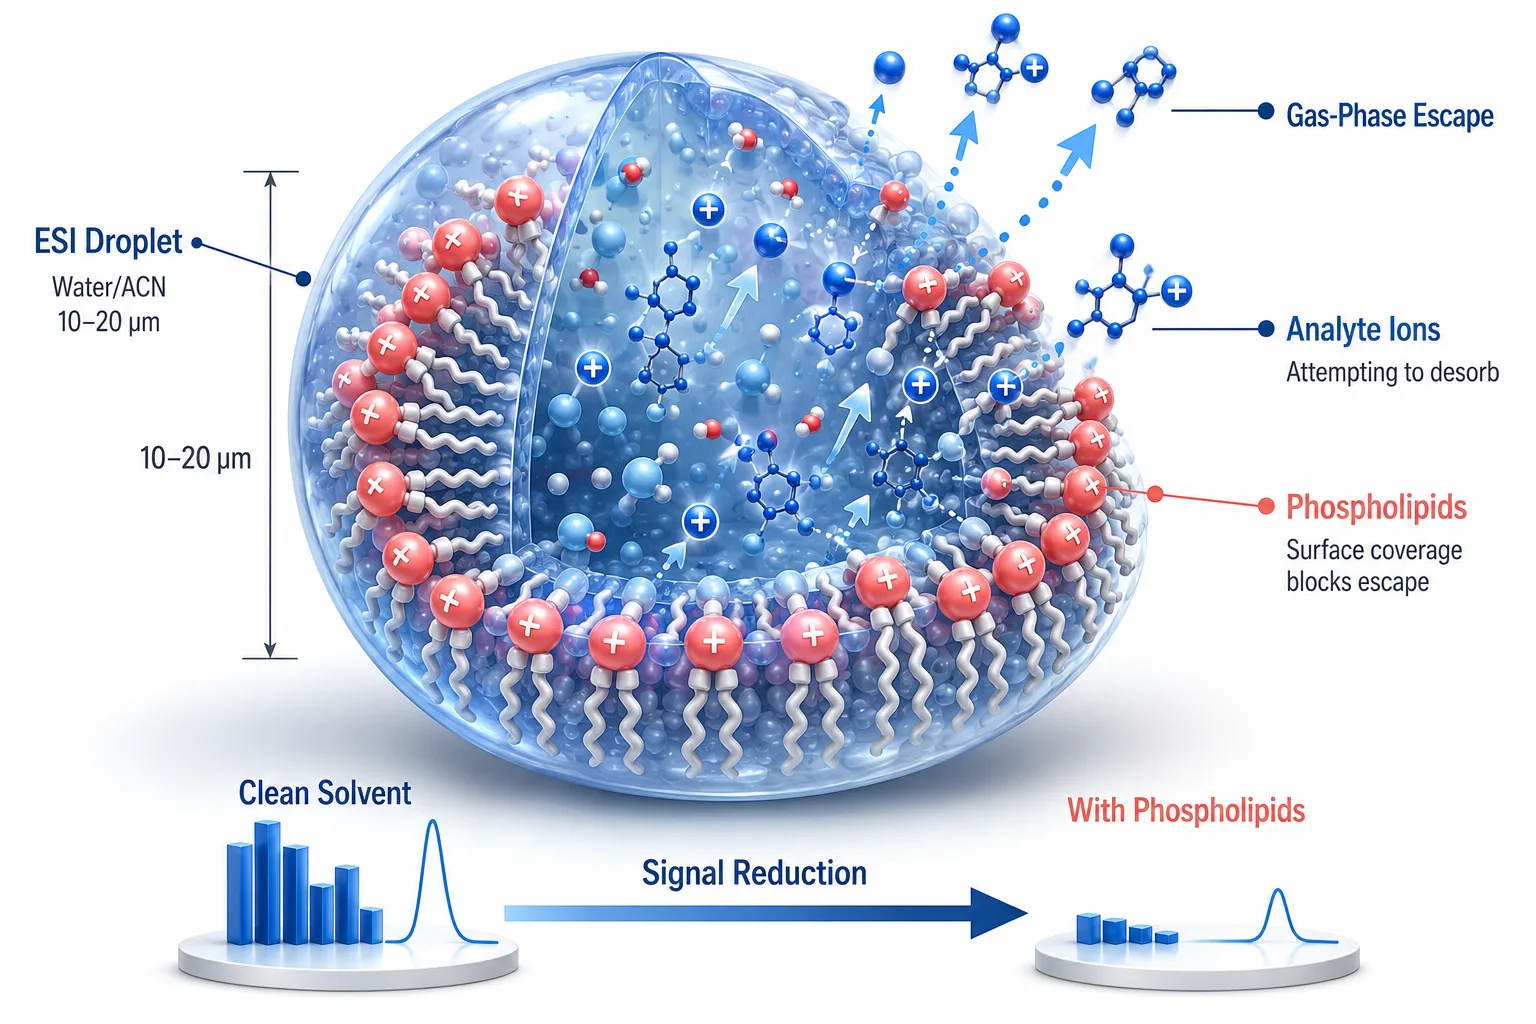
 Figure 1: ESI Ion Suppression Mechanism — Charged Droplet to Phospholipid Surface Competition to Signal Reduction
What Are Matrix Effects, Really? The Physics Behind the Problem
Matrix effects in LC-MS/MS bioanalysis are the single most common cause of quantification failure in drug development. Every bioanalytical scientist has encountered them. Few can explain the physics. The distinction matters because mitigation strategy follows directly from mechanism — guessing wastes weeks.
Ion suppression and enhancement are the same phenomenon in opposite directions: co-eluting matrix components change the analyte's ionization efficiency. Both degrade accuracy. Both have the same root cause: competition at the charged droplet surface in electrospray ionization.
ESI produces a fine aerosol of charged droplets. As solvent evaporates, the droplet shrinks. At the Rayleigh limit — where electrostatic repulsion overcomes surface tension — the droplet undergoes Coulomb fission, shedding smaller offspring droplets. This evaporation-fission cycle repeats until analyte ions escape into the gas phase, primarily by desorbing from the droplet surface (ion evaporation model for small molecules). The critical point: the analyte must reach the droplet surface to escape. Nonvolatile matrix components accumulating at that same surface block it.
Phospholipids are the dominant suppressants because their amphiphilic structure — charged phosphocholine head group, two hydrophobic fatty acid tails — positions them perfectly at the air-liquid interface. The charged head group competes for excess protons; the hydrophobic tails physically block analyte molecules. Net effect: fewer analyte ions reach the detector.
This mechanism explains why APCI is near-immune to phospholipid suppression. APCI vaporizes the entire eluent and ionizes in the gas phase — no droplet, no surface competition. The trade-off is 2–5x lower sensitivity and a thermal stability requirement (Section 6).
The m/z 184 Diagnostic. Glycerophosphocholines share a common phosphocholine head group that fragments to produce m/z 184 in positive ESI. Adding an MRM channel monitoring m/z 184 maps phospholipid elution in real time. If the analyte retention time overlaps a phospholipid peak on this trace, suppression is almost certain. This experiment takes one injection and is the highest-information-density diagnostic in method development.
Where Matrix Effects Come From: Sources of Interference
Knowing what causes suppression lets you target it at the source rather than compensating downstream.
Endogenous Sources. Glycerophosphocholines (GPChos, ~70% of plasma phospholipid interference) and lysophosphatidylcholines (~10%) are the primary offenders — abundant at 1–3 mg/mL in plasma, efficiently co-extracted in organic solvents, and eluting across a broad reversed-phase window (60–95% organic on C18). Salts increase droplet surface tension and conductivity, altering fission dynamics. Bile acids produce strong interference in negative-ion mode. Hemoglobin from hemolyzed samples contributes massive protein load and iron-porphyrin interference (Section 7).
Exogenous Sources. Polypropylene consumables leach phthalate plasticizers, PEG, and slip agents. Li-heparin tubes introduce lithium adducts that split the analyte signal. EDTA tubes contribute Na+ and K+ salts. SPE sorbent leachates from silica-based materials introduce siloxane background. The practical step: run a method blank — water processed through the entire workflow in the same consumables — early in development. If unexpected peaks appear, trace them to the consumable, not the matrix.
Species Differences. Mouse, rat, dog, and human plasma differ in phospholipid subspecies distribution — chain length, unsaturation, and head-group ratios vary by species. A phospholipid elution window mapped in rat plasma may shift by 0.3–0.5 minutes in human plasma because the dominant phosphatidylcholine subspecies differ. Matrix effect assessment in the preclinical species does not transfer to the clinical matrix. ICH M10 requires evaluation in each matrix species used for study samples. This also means that cross-species method transfer requires re-evaluation of matrix effects, not just accuracy and precision — a requirement frequently missed in transfer protocols until the receiving lab's QCs fail.
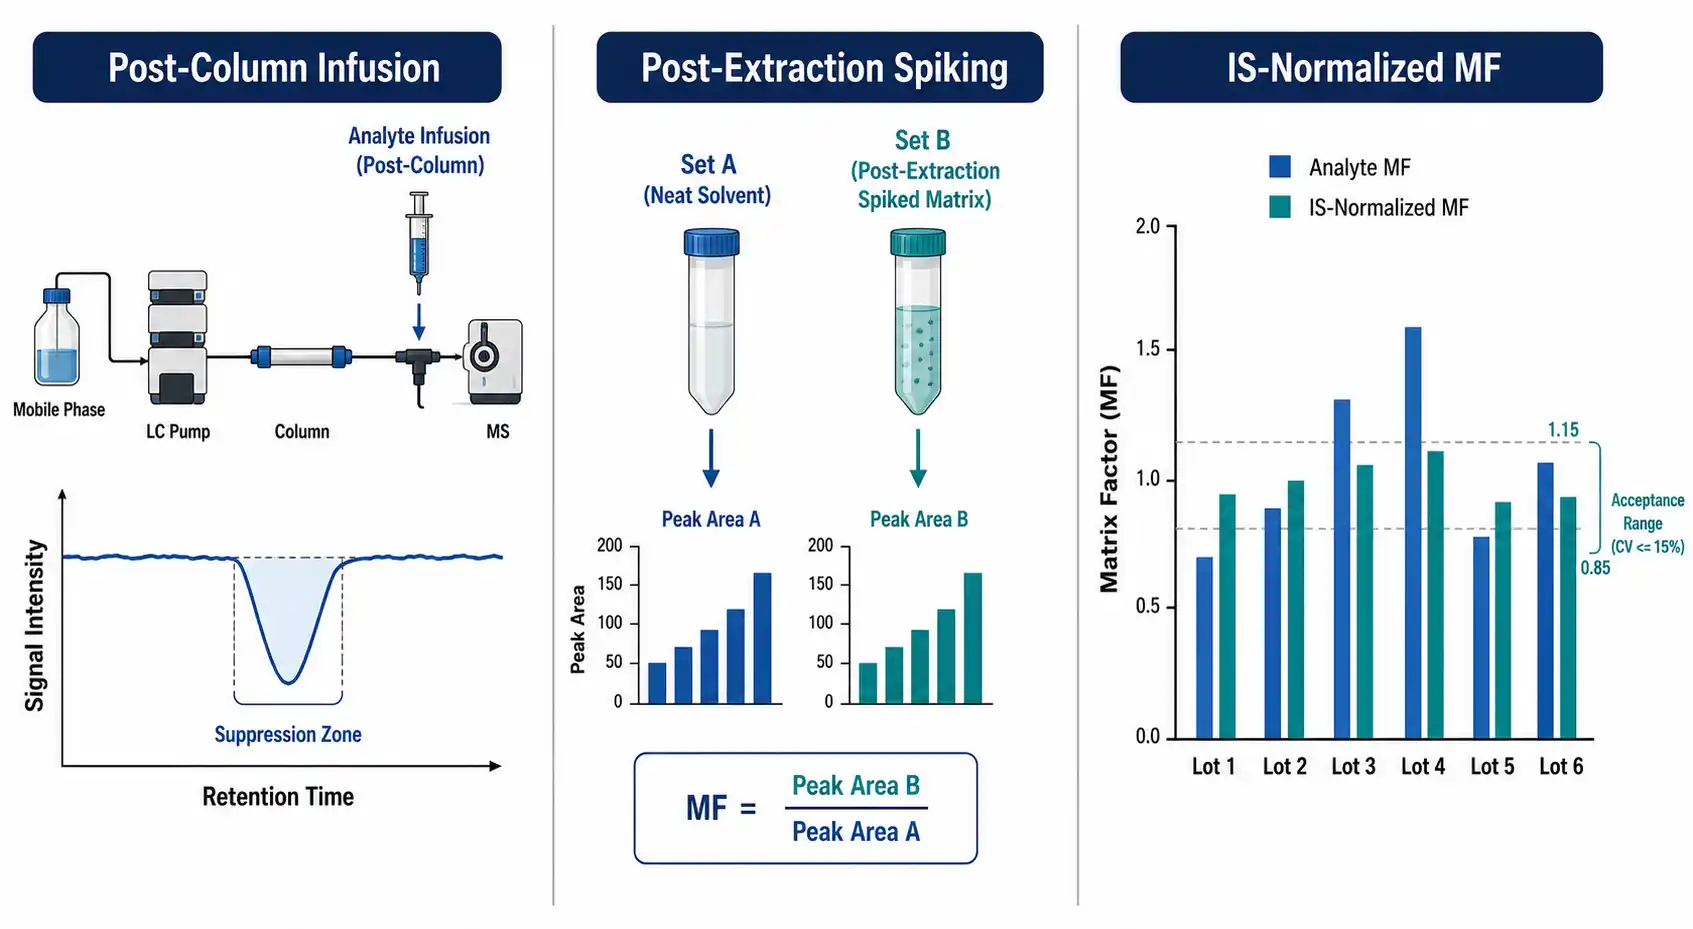 Figure 2: Three Matrix Effect Assessment Methods — Post-Column Infusion, Post-Extraction Spiking, IS-Normalized Matrix Factor
Assessing Matrix Effects: How to Measure What You Cannot See
Matrix effects are invisible on a standard chromatogram — you see the peak, not what suppressed it. Three complementary methods reveal them.
Post-Column Infusion (Qualitative). Infuse analyte at constant concentration post-column while injecting blank matrix extract. Suppression zones appear as dips in the otherwise constant signal. One injection answers: "where in my gradient do matrix effects occur?" Run once per method.
Post-Extraction Spiking (Quantitative). Compare analyte response in neat solvent (Set A) vs. post-extraction spiked matrix from ≥6 individual lots (Set B). Matrix Factor = peak area Set B / peak area Set A. MF <1.0 = suppression; >1.0 = enhancement.
IS-Normalized Matrix Factor (ICH M10 Method). Calculate MF for both analyte and IS in each lot. IS-normalized MF = MF_analyte / MF_IS. The CV across all lots must be ≤15%. When the CV exceeds this threshold, the IS is not adequately tracking the analyte's matrix behavior. For structural analog IS methods, this is the most likely validation failure point. When matrix effect assessment reveals persistent variability across lots, our bioanalytical method development and validation services include systematic matrix effect troubleshooting across all ICH M10-required matrix types.
Phospholipid Monitoring via m/z 184. Add one MRM channel — no extra preparation or injection. The trace shows phospholipid elution profile. Comparing it against analyte retention time is the fastest go/no-go check in method development: overlap means a matrix effect problem exists before any validation sample is run. In one typical case, a method for a kinase inhibitor passed all validation criteria in normal plasma but produced IS-normalized MF CV of 42% when hemolyzed lots were introduced — the m/z 184 trace revealed the analyte peak sat directly atop a late-eluting phospholipid cluster, invisible on the standard MRM chromatogram.
The Mitigation Pyramid: A Layered Strategy from Simple to Advanced
Matrix effect mitigation is hierarchical. Start at the bottom — the cheapest, fastest option. Escalate only when necessary.
Level 1 — Chromatographic Separation (Free). Move the analyte retention time away from the phospholipid elution window. Phospholipids elute at 60–95% organic on C18. Adjust gradient slope (shallower = more resolution). Swap acetonitrile for methanol — methanol-based gradients compress phospholipids into a tighter late-eluting band, freeing more of the chromatogram from interference. Add a 100% isopropanol column flush at each run's end to strip retained phospholipids. Column selectivity changes (phenyl-hexyl for pi-pi interactions unavailable to phospholipids) can shift the analyte relative to suppression zones.
Level 2 — Sample Preparation Upgrade. PPT (acetonitrile crash) leaves 60–80% of phospholipids in the supernatant. Switching from methanol to acetonitrile for PPT improves phospholipid removal by ~40%. LLE (MTBE, n-butyl chloride) excludes phospholipids via their zwitterionic state — they partition poorly into non-polar organic solvents. Polymeric SPE removes 80–90% of phospholipids. Mixed-mode SPE (RP + ion-exchange) exceeds 95% removal by adding orthogonal selectivity — the charged phosphocholine head group binds to the ion-exchange site while the neutral analyte is retained primarily by RP. Most methods resolve at Level 2.
Level 3 — Ion Source Switching. When Levels 1–2 fail, change the ionization mechanism. APCI vaporizes the entire eluent — no droplet, near-immunity to phospholipid suppression. Sensitivity penalty: 2–5x higher LLOQ. Test APCI as a single injection before committing development resources. APPI excels for steroids and highly conjugated compounds but is compound-class-specific.
Level 4 — Advanced Instrumental. Online SPE with column switching automates cleanup via two pumps and a switching valve. Turbulent flow chromatography uses high flow rates through large particles — proteins swept to waste, small molecules retained. Multidimensional SPE combines restricted-access media (size-excludes proteins) with mixed-mode sorbent. Reserve Level 4 for regulated clinical methods where matrix effect criteria are absolute and sample volume justifies the infrastructure investment.
The decision logic: start at Level 1 (free, hours). If IS-normalized MF CV exceeds 15%, escalate to Level 2 (1–3 days). If still failing, test APCI as a Level 3 experiment (1 hour). Level 4 only when the compound is advancing to regulated clinical studies with thousands of samples.
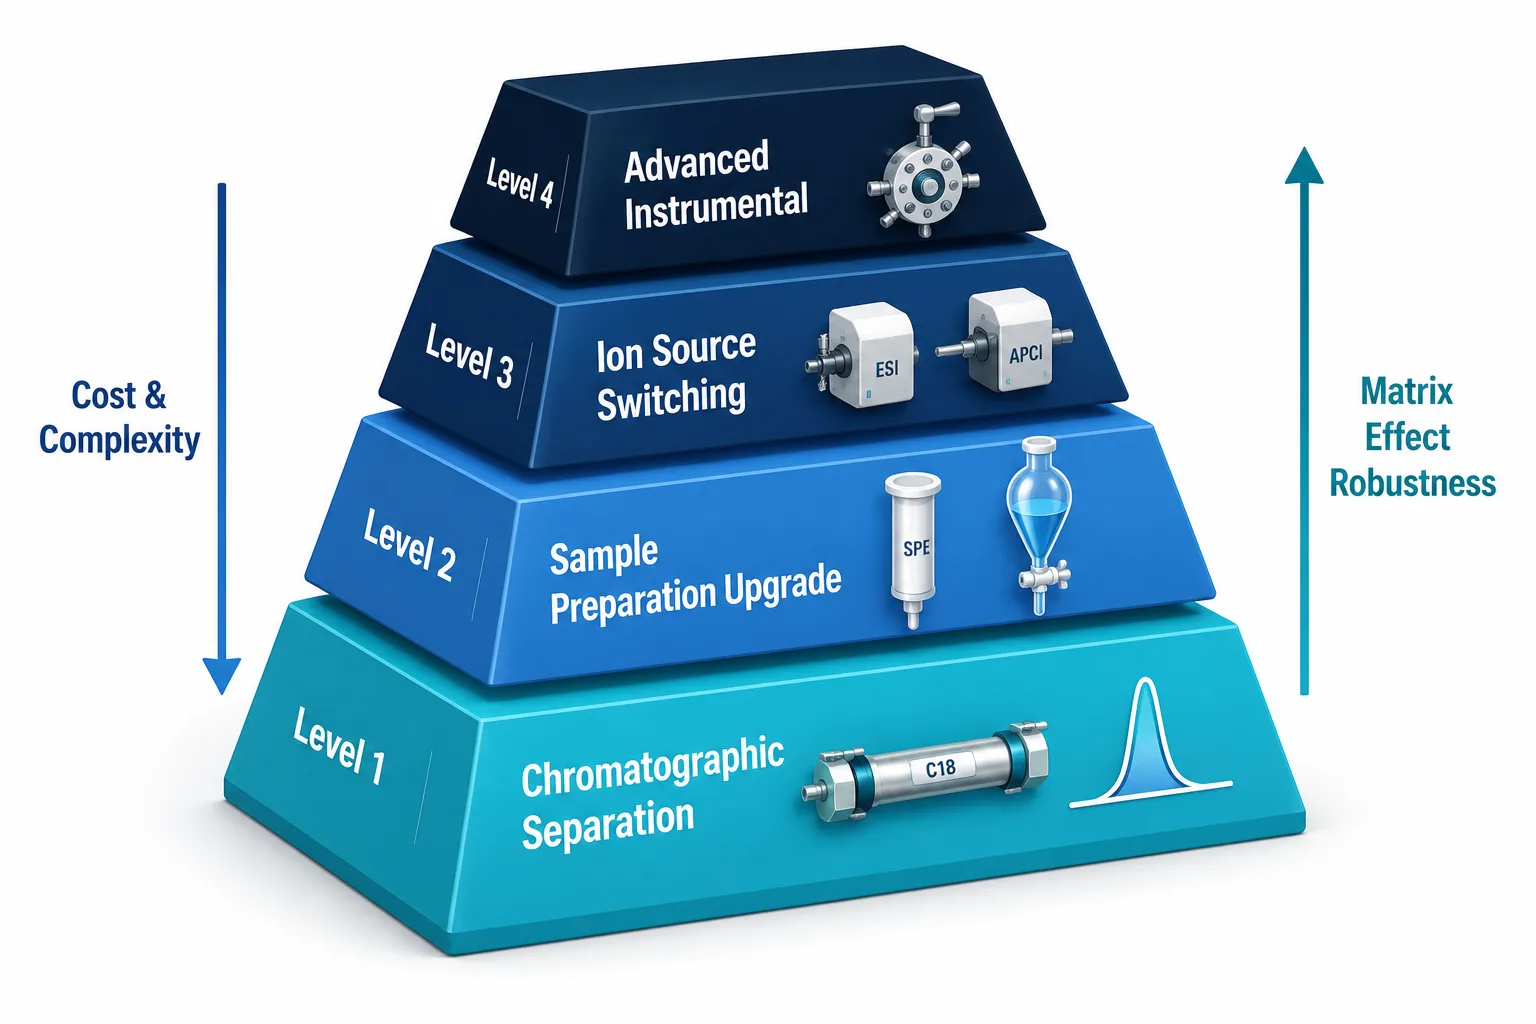 Figure 3: Four-Level Mitigation Pyramid — Chromatography to Sample Preparation to Source Switching to Advanced Instrumental
Sample Preparation Strategies for Phospholipid Removal
Sample preparation is the primary battleground. Every technique removes some phospholipids. The question is how much is enough. For methods where in-house optimization of extraction protocols is not feasible, our sample preparation method development services provide optimized PPT, LLE, and SPE workflows tailored to the analyte and matrix combination.
ACN vs. MeOH for PPT. Acetonitrile removes approximately 40% more phospholipids than methanol because it is a weaker phospholipid solvent — more phospholipids co-precipitate with proteins. Unless recovery data specifically favors methanol, use ACN for PPT.
LLE Optimization. MTBE and n-butyl chloride leave only trace phospholipids in the organic layer. Shorter extraction (5 min vs. 20 min) produces cleaner extracts — phospholipids partition more slowly than small-molecule drugs. Salt-assisted LLE further suppresses phospholipid partitioning by increasing aqueous phase ionic strength.
Mixed-Mode SPE. Standard RP-SPE retains analyte and phospholipids by the same hydrophobic mechanism — they cannot be separated. Mixed-mode sorbents add ion-exchange: the charged phosphocholine head group is trapped by the IEX site while the analyte is eluted under conditions that don't disrupt the IEX interaction.
A typical protocol loads at neutral pH, washes with 5% MeOH (salts, polar interferences) then 100% MeOH (neutral interferences, but phospholipids stay IEX-bound), and elutes the analyte with acidified or basified organic that disrupts the analyte-IEX interaction while phospholipids remain trapped. Waters Oasis MAX/MCX and equivalent polymeric mixed-mode chemistries from other vendors achieve >95% phospholipid removal.
The method development investment — selecting the right ion-exchange mode (WCX for strong bases, WAX for strong acids, MCX/MAX for broad-spectrum) and optimizing wash/elution pH — pays back across every subsequent batch.
Zirconia-Based HybridSPE and Phree. Zirconia selectively binds phosphate groups through Lewis acid-base interaction — the zirconium coordinates directly to the phosphate oxygen. Result: >99% phospholipid removal with 72–108% recovery for most small-molecule drugs. Phree 96-well plates combine protein precipitation and phospholipid removal in one step — sample mixed with acidified ACN, passed through zirconia-coated bed, under 10 minutes per plate. This is the current practical optimum for regulated methods requiring maximum phospholipid removal with minimum throughput penalty.
HILIC-SPE. Phospholipids elute in a single sharp band early in the HILIC gradient; polar analytes are retained. Complete removal in every run, no carryover. Best suited for polar analytes already compatible with HILIC retention.
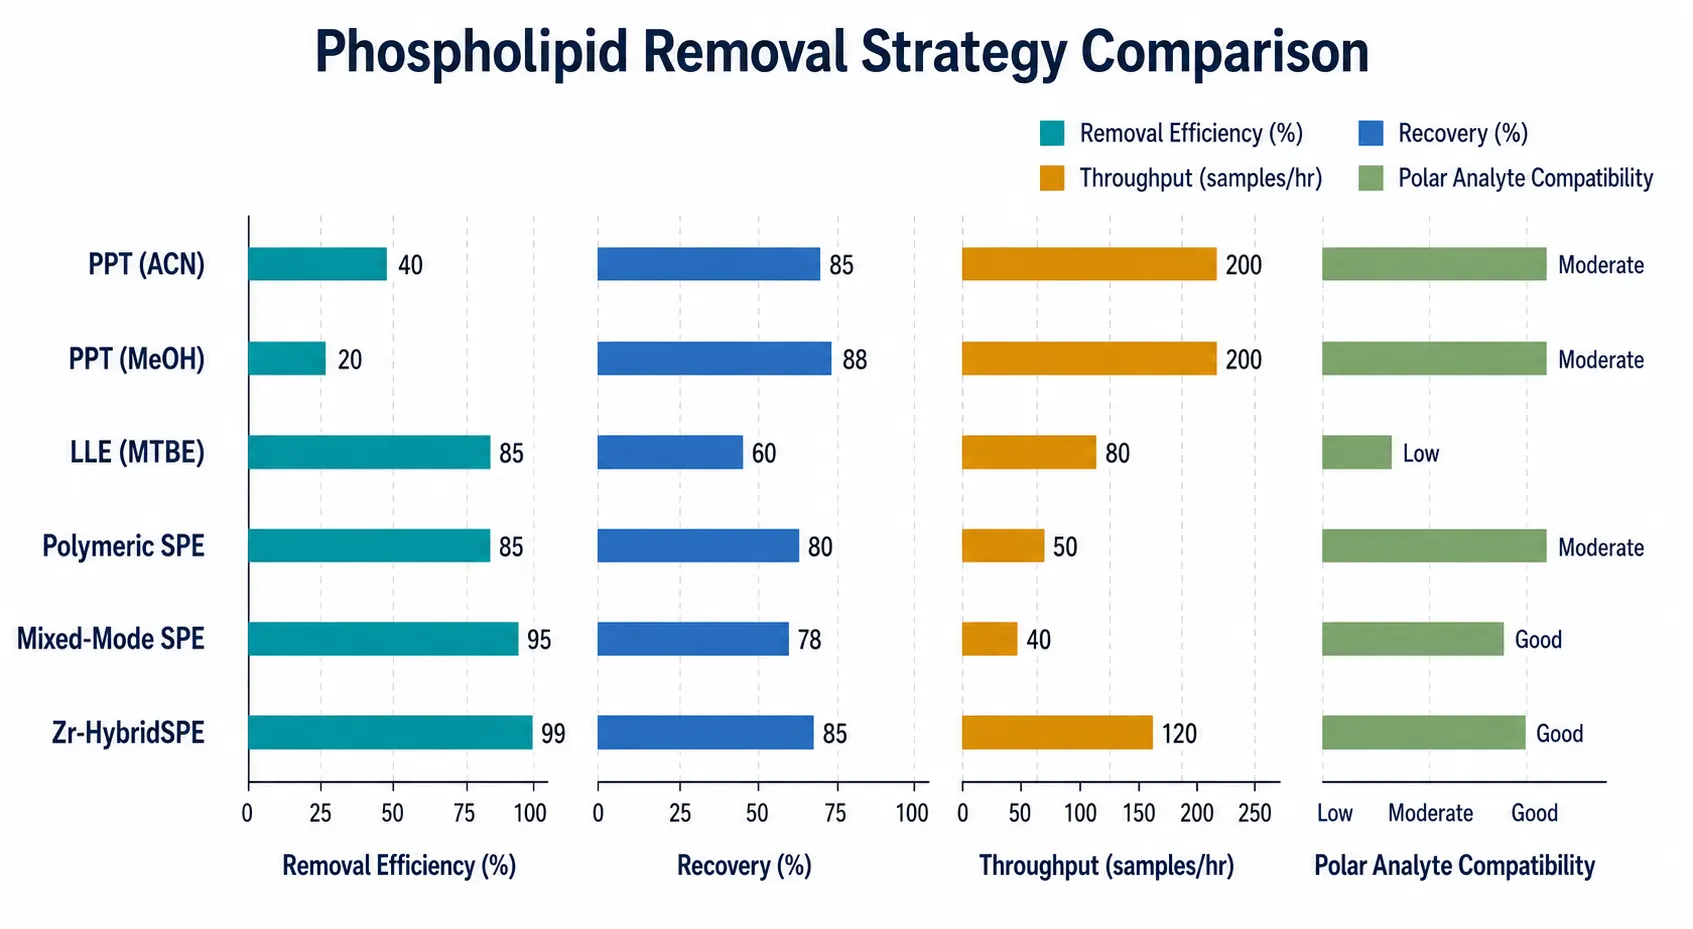 Figure 4: Six Phospholipid Removal Strategies Compared — Removal Efficiency (PPT 20-40% to Polymeric SPE 80-90% to Mixed-Mode SPE >95% to Zr-HybridSPE >99%), Typical Recovery Range (72-108%), Throughput (samples/hour), and Analyte Compatibility (non-polar to polar)
Ion Source Selection: ESI, APCI, or APPI?
The ion source decision balances sensitivity, matrix robustness, and analyte compatibility. Most methods default to ESI and never revisit the choice — but for matrix-effect-challenged methods, source selection is the most consequential parameter no one adjusts.
ESI delivers the lowest LLOQs for >90% of small-molecule drugs but is maximally matrix-effect-sensitive. When sensitivity is adequate and matrix effects are acceptable, ESI is correct.
APCI is near-immune to phospholipid suppression because ionization occurs in the gas phase. The 2–5x sensitivity penalty may be irrelevant for well-absorbed, moderate-to-high-dose drugs — clinical concentrations are far above the LLOQ. For potent, low-dose drugs, it may be prohibitive. Literature example: levonorgestrel LLOQ of 0.25 ng/mL by ESI vs. 1 ng/mL by APCI. APCI also requires thermal stability — the 300–500degC vaporization step degrades glucuronide conjugates and N-oxides. Test with one injection of mid-QC: if the analyte survives and S/N is adequate, the matrix effect problem is solved.
APPI uses a UV lamp for photoionization and excels for compounds with extended pi-conjugation — steroids, polycyclic aromatics, vitamin D metabolites — providing an order-of-magnitude sensitivity advantage where ESI and APCI both underperform. Matrix effect susceptibility is intermediate between ESI and APCI.
Source Design Matters by Vendor. Sciex Turbo V, Waters Z-spray, and Thermo HESI-II differ in sprayer geometry, desolvation gas direction, and heated capillary design — producing different matrix effect profiles for the same analyte-matrix combination. Method transfer between vendor platforms requires matrix effect re-evaluation; cross-validation should not be assumed.
The switching decision: if matrix effects fail ICH M10 criteria after Levels 1–2, test APCI before investing in Level 4 infrastructure. One hour of instrument time vs. weeks of development for online SPE or turbulent flow chromatography.
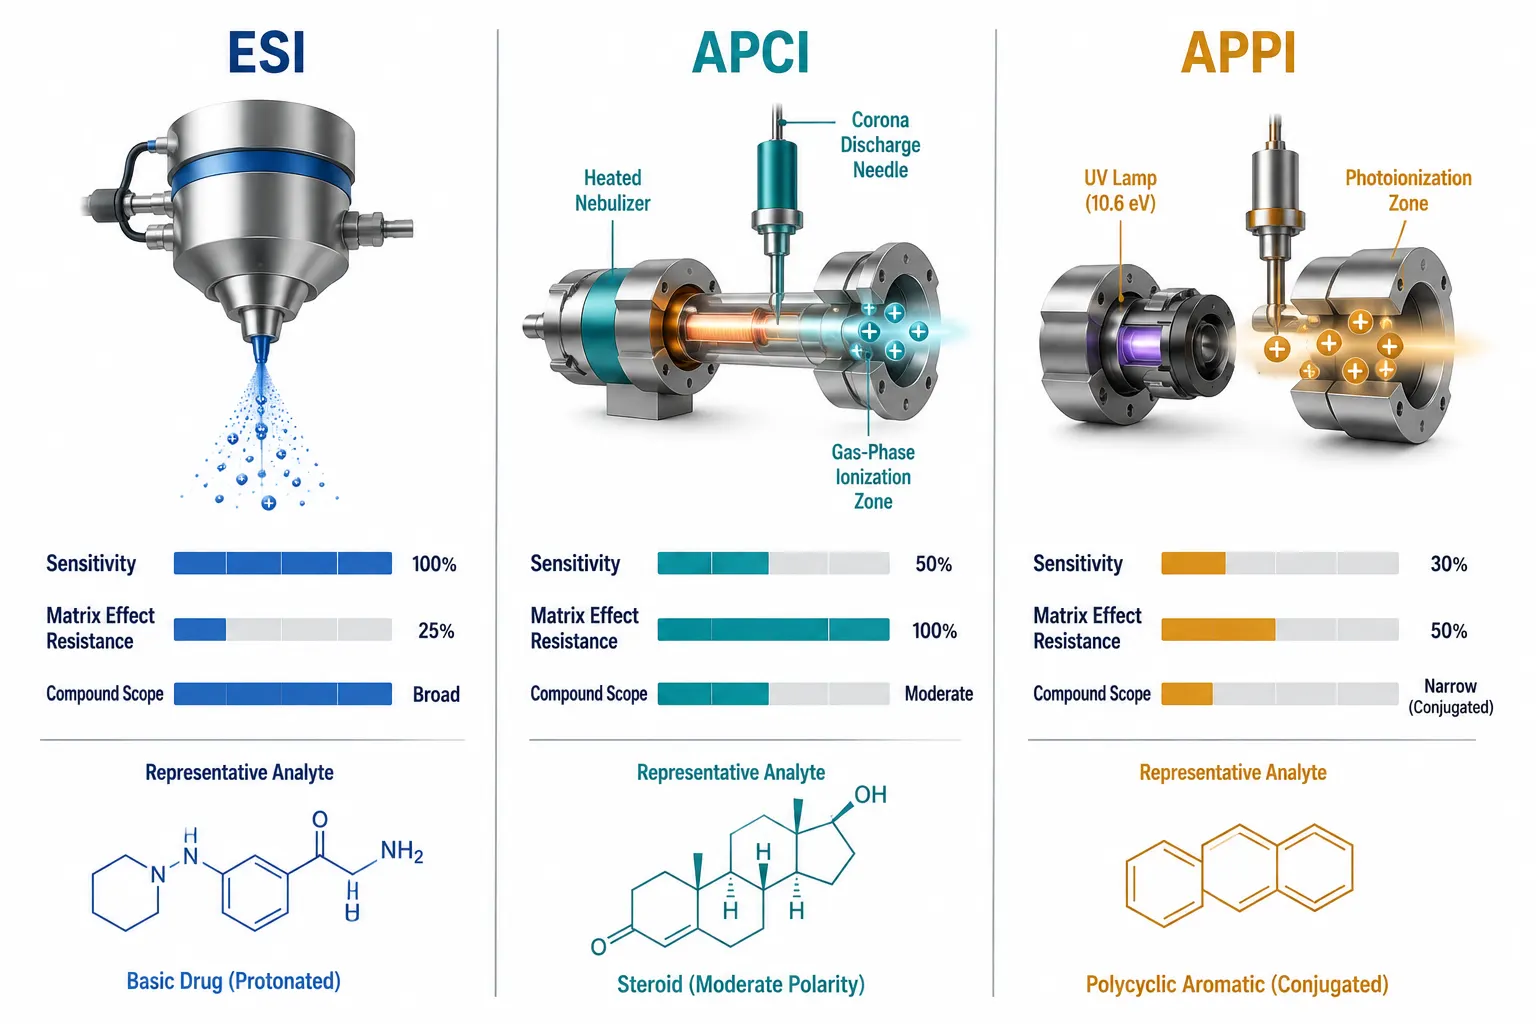 Figure 5: ESI / APCI / APPI Three-Way Comparison — Sensitivity / Matrix Effect Susceptibility / Analyte Suitability
Managing Challenging Matrices: Hemolyzed and Hyperlipidemic Plasma
Real-world samples are rarely pristine. Hemolyzed and hyperlipidemic plasma are the two most common problematic matrices — both produce matrix effects far more severe than normal plasma. Our bioanalysis of challenging compounds and complex matrices service provides dedicated protocols for these sample types, including hemolyzed plasma evaluation per ICH M10 and hyperlipidemic matrix handling with optimized SPE and SLE workflows.
Hemolyzed Plasma. At 2% v/v hemolysis (barely visible pink), plasma hemoglobin reaches ~300 mg/dL. This protein load overwhelms PPT capacity and suppresses analyte ionization through proton competition from basic amino acid residues (histidine, lysine, arginine). Released intracellular enzymes accelerate analyte degradation. ICH M10 requires hemolyzed matrix evaluation at ≥2% v/v, ≥1 lot. Mitigation: freeze hemolyzed samples immediately, minimize freeze-thaw, and use SPE rather than PPT. HybridSPE is particularly effective — zirconia binds both phospholipids and the heme iron-porphyrin via Lewis acid-base interaction.
Hyperlipidemic Plasma. Elevated triglycerides and chylomicrons cause three distinct problems. First, emulsions form during LLE, preventing clean phase separation — additional centrifugation or freezing steps are required to break them. Second, lipids progressively foul the ESI source, depositing on the sprayer and curtain plate so sensitivity degrades through a batch. Third, sample-dependent suppression becomes unpredictable — the suppression can be severe enough that even IS-normalized peak area ratios drift. ICH M10 requires hyperlipidemic evaluation in at least one lot. Mitigation: SPE is strongly preferred. If LLE is the only option, add a hexane wash step to strip triglycerides before extraction, or use SLE where the lipid layer is physically trapped on the diatomaceous earth bed and never reaches the collection vessel.
Cold-Chain Management. Both hemolyzed and hyperlipidemic samples degrade faster than normal plasma. Freeze immediately after centrifugation. Document time from collection to freezer for every sample.
When to Reject a Sample. Replace visual inspection ("looks hemolyzed") with quantified indices: hemoglobin absorbance at 414/540 nm for hemolysis, turbidity for lipemia. Establish a priori criteria in the analytical plan. The worst outcome: analyzing a sample of unknown quality, getting an anomalous result, and having no basis to accept or reject it.
Species-Specific Challenges. Rodent plasma is inherently more lipemic than human or dog. Large-volume mouse blood draws inevitably cause some hemolysis — validate with hemolyzed and lipemic matrix from the actual study species during method development.
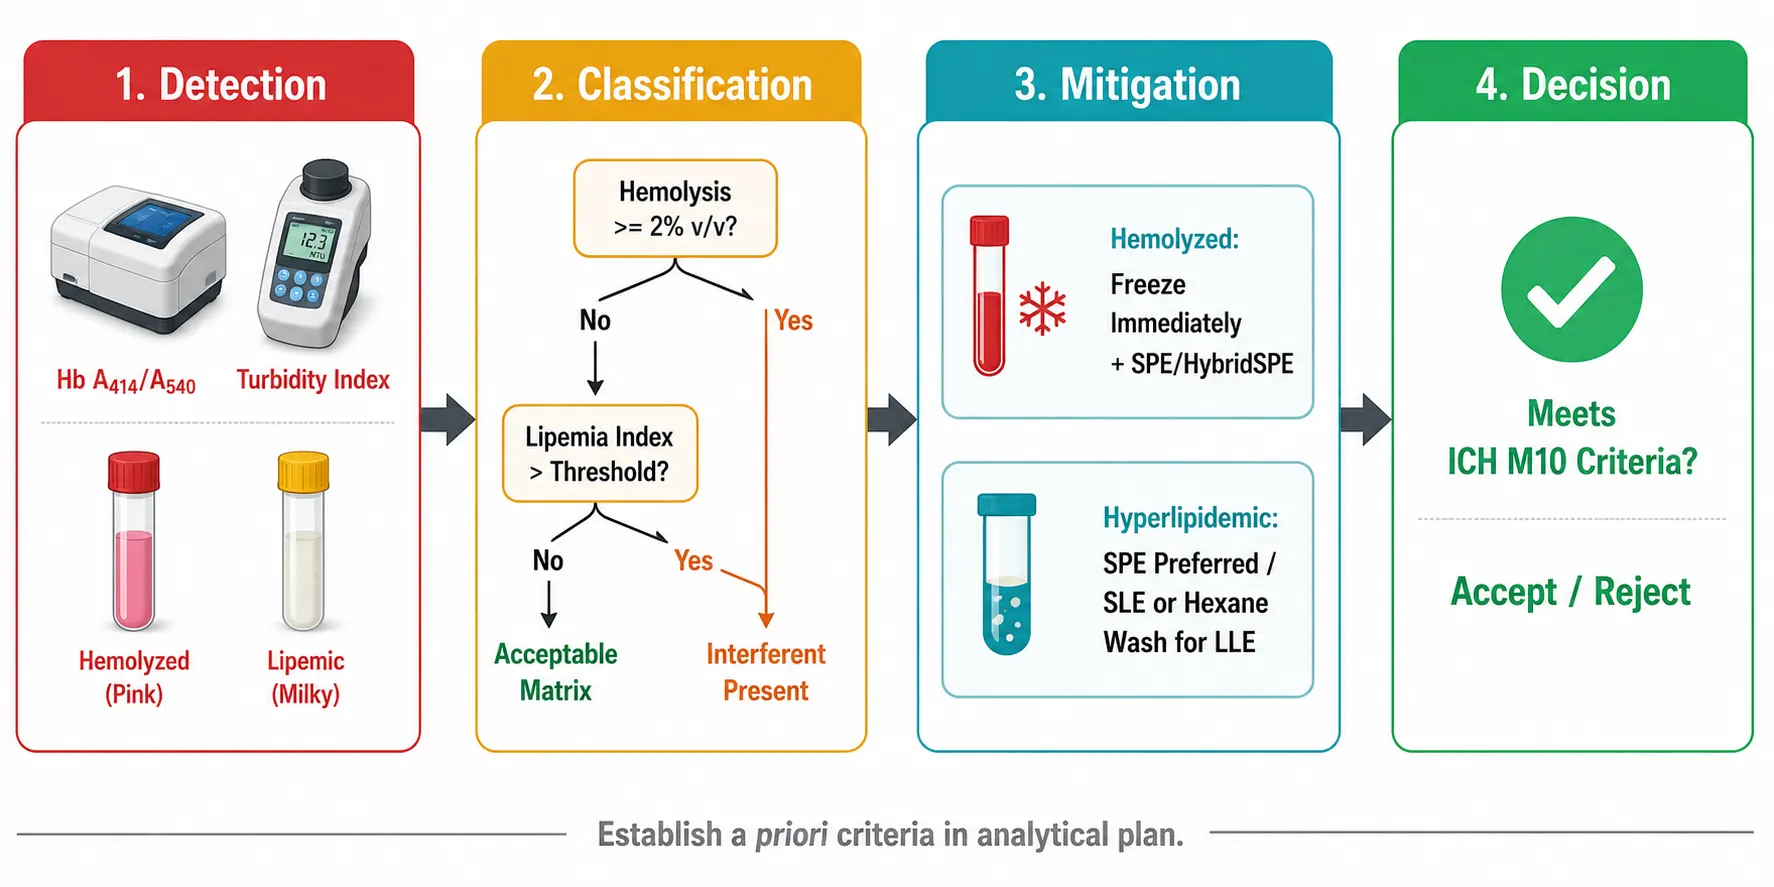 Figure 6: Hemolyzed/Lipemic Sample Processing Workflow — Detection to Mitigation to Decision
The Internal Standard Shield: The Last Line of Defense
The IS corrects for matrix effects that survive chromatography, sample preparation, and source optimization — but it has limits.
SIL-IS co-elutes with the analyte, experiences identical ionization conditions, and preserves the analyte/IS peak area ratio regardless of absolute suppression. This is compensation, not mitigation — S/N still degrades — but quantification is preserved. It only works when IS is added pre-extraction.
Three SIL-IS failure modes: (1) Deuterium isotope effect — ²H-labeled IS elutes 0.02–0.05 min earlier on C18, potentially encountering different suppression; ¹³C-labeled IS avoids this. (2) CE mismatch — if the collision energies for analyte and IS diverge, instrument aging amplifies the bias; a 2026 Talanta study documented 15–92% instrument-specific bias from CE inconsistency. (3) IS degradation to unlabeled analyte, inflating apparent concentrations at the low end.
Structural analog IS that elutes at a different retention time can produce IS-normalized MF CV of 25–40% vs. <8% for SIL-IS. If a method using analog IS fails matrix effect criteria, the first fix is switching to SIL-IS — the IS strategy determines the ceiling of achievable precision.
Defense-in-Depth Principle. Fix extraction and chromatography first — remove suppressants. Use IS for residual, unavoidable variability. A method where SIL-IS compensates for 80% suppression is fragile; one compensating for <20% is robust. Each layer — chromatography, sample preparation, source optimization, IS — protects the method when other layers drift.
Frequently Asked Questions
Why do my calibration standards look perfect but QCs in real matrix fail?
This is the classic signature of matrix effects. Calibrators are prepared in blank matrix from a single lot — if that lot has unusually low phospholipid content, the curve looks excellent. QCs in independent matrix lots reveal real-world inter-lot variability. If QCs fail while calibrators pass, the problem is almost certainly matrix effect variability. Test QCs in >=6 individual lots to diagnose. For a complete discussion of IS strategy and how IS selection affects matrix effect compensation, see our guide on bioanalytical method development and validation.
How many matrix lots do I really need to test?
ICH M10 requires >=6. For discovery, 3-4 lots from the target species provide adequate screening. Lot diversity matters more than lot count: six healthy young males from one vendor are less informative than three lots including females, aged animals, or different strains. A single hemolyzed and a single lipemic lot add more diagnostic value than four additional normal lots.
Can I use the same method for plasma, serum, and tissue without re-validation?
Same MRM transitions and chromatography can carry forward, but matrix effects must be evaluated in each matrix independently. Tissue homogenates have dramatically higher phospholipid content. A method clean in plasma may fail badly in liver or brain. At minimum, validate matrix effect, accuracy, and precision in each matrix type. For the full LC-MS/MS quantification workflow from method setup through data processing, see our comprehensive guide on single-drug quantification by LC-MS/MS.
What is the fastest way to troubleshoot unexplained ion suppression?
Run the m/z 184 phospholipid survey scan. One injection. If the analyte retention time overlaps a phospholipid peak, adjust the gradient (Level 1 of the mitigation pyramid). If no overlap but suppression persists, run post-column infusion to map non-phospholipid suppression sources. If both are clean, the problem is not matrix effects — check instrument sensitivity, column performance, or calibrator preparation.
When is it worth switching from ESI to APCI?
When Levels 1-2 cannot bring IS-normalized MF CV below 15%, and the analyte is thermally stable with MW <800. Test with one injection of mid-QC: if the peak is sharp, S/N is adequate for your LLOQ, and accuracy is within +/-15%, APCI is viable. If the analyte degrades, APCI is not an option — escalate to Level 4. Test APCI the moment matrix effect failures appear in qualification, not after validation fails.
Does dilution help with matrix effects?
Dilution reduces absolute amounts of both analyte and matrix components. If the method has sensitivity headroom (study concentrations 20-50x LLOQ), 2-5x dilution can be a quick fix. If concentrations are near LLOQ, dilution makes the method non-viable. Dilution does not change the relative matrix composition, so suppression per unit analyte may be unchanged — it works only when the absolute amount of matrix component, not its concentration, drives suppression.
References
- Cortese M, Gigliobianco MR, Magnoni F, Censi R, Di Martino P. Compensate for or minimize matrix effects? Strategies for overcoming matrix effects in liquid chromatography-mass spectrometry technique: a tutorial review. Molecules. 2020;25(13):3047. CC BY 4.0.
- ICH Harmonised Guideline. Bioanalytical Method Validation and Study Sample Analysis M10. International Council for Harmonisation; 2022.
- Almalki AH, Alshehri MA, Althobaiti YS, Alrobaian M, Alshehri SA, Alotaibi AM. Advancing bioanalytical method validation: a comprehensive ICH M10 approach for validating LC-MS/MS to quantify fluoxetine in human plasma and its application in pharmacokinetic studies. Molecules. 2024;29(19):4588. CC BY 4.0.
- Ahmad S, Kalra H, Gupta A, Raut B, Hussain A, Rahman MA. HybridSPE: a novel technique to reduce phospholipid-based matrix effect in LC-ESI-MS bioanalysis. Journal of Pharmacy and Bioallied Sciences. 2012;4(4):267-275. CC BY-NC-SA 3.0.
- Yang X, Li Y, Zhang H, et al. Development and validation of two bioanalysis methods for etimicin in human serum and urine by LC-MS/MS. Frontiers in Pharmacology. 2023;14:1076046. CC BY 4.0.
- Tamama K. Dilute-and-shoot method in urine drug screening by LC-MS: a comprehensive review of matrix effects and sample preparation strategies. Frontiers in Chemistry. 2023;11:1278313. CC BY 4.0.
- Panuwet P, Hunter RE Jr, D'Souza PE, Chen X, Radford SA, Cohen JR, Marder ME, Kartavenka K, Ryan PB, Barr DB. Biological matrix effects in quantitative tandem mass spectrometry-based analytical methods: advancing biomonitoring. Critical Reviews in Analytical Chemistry. 2016;46(2):93-105.
- 16th GCC Closed Forum: ICH M10 implementation; NGS, qPCR/dPCR, flow cytometry validation; tissue biomarkers; IS response; immunogenicity harmonization; bioanalytical industry status. Bioanalysis. 2024;16(11):505-517.
- Castillo-Ribelles L, Arranz-Amo JA, Hernandez-Vara J, Ferrer-Costa R, Martinez-Vicente M, Carnicer-Caceres C. Systematic assessment of matrix effect, recovery, and process efficiency using three complementary approaches. ACS Omega. 2025;10(44):52449-52458. CC BY 4.0.
- Bylda C, Thiele R, Kobold U, Volmer DA. Recent advances in sample preparation techniques to overcome difficulties encountered during quantitative analysis of small molecules by LC-MS/MS. The Analyst. 2014;139(8):2265-2276.
Disclaimer: All services and resources mentioned on this site are for research use only (RUO) and are not intended for diagnostic, therapeutic, or clinical applications.
Related Services


