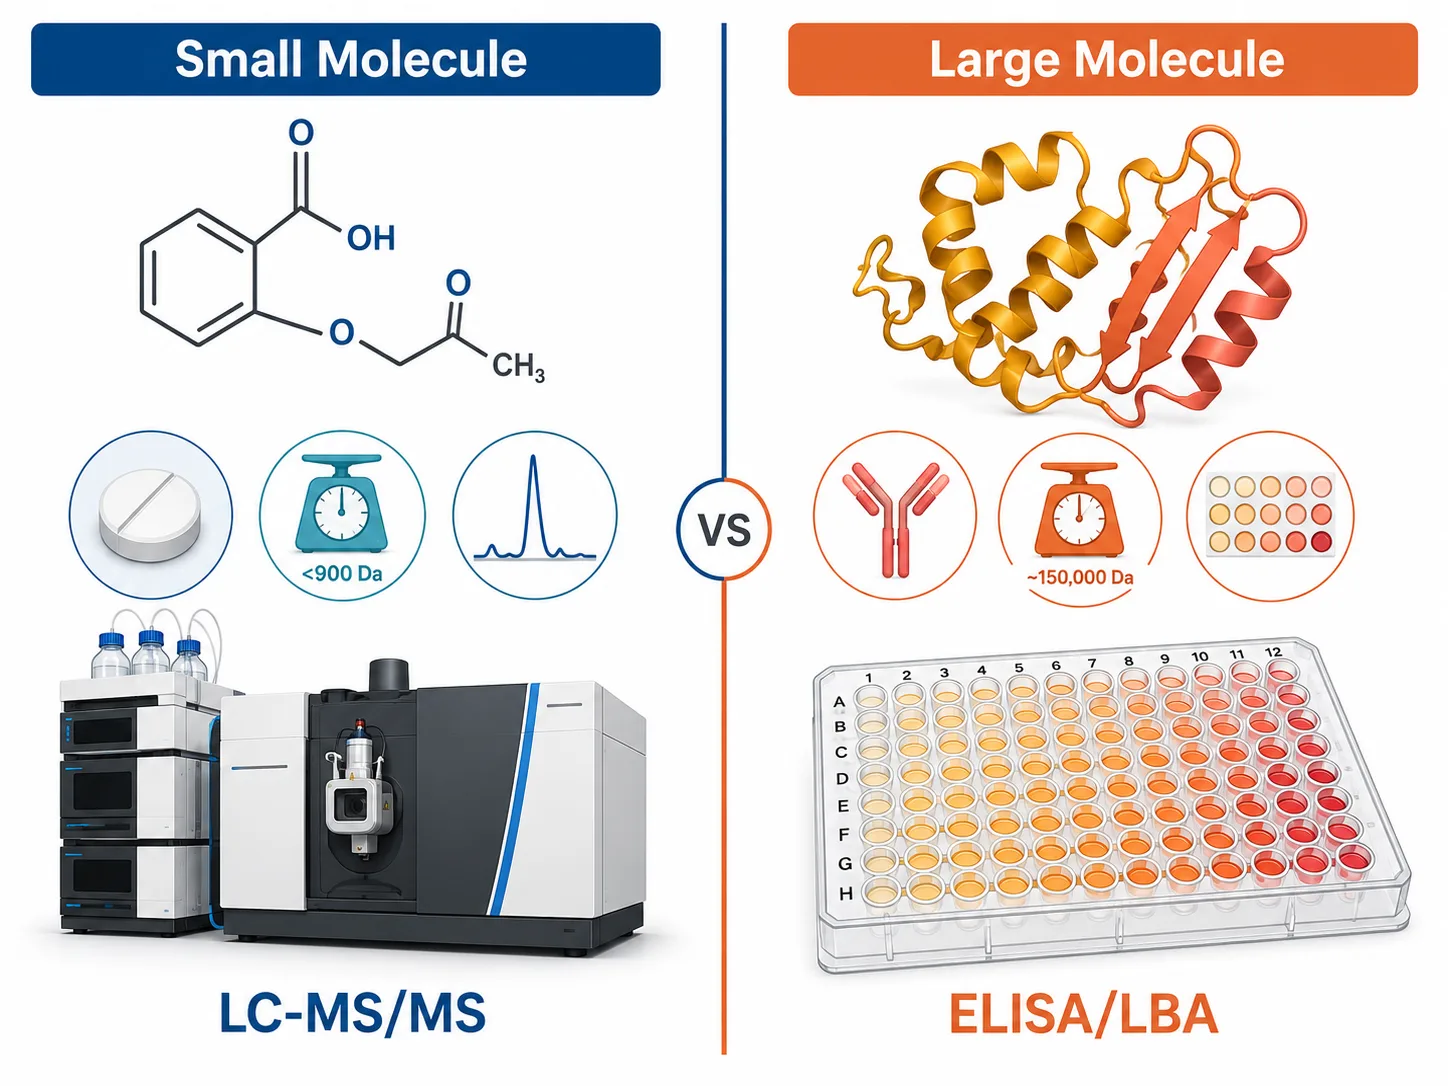
 Figure 1: Small Molecule vs Large Molecule Bioanalysis Comparison
What Is Bioanalysis — and Why Should Drug Developers Care?
Bioanalysis is the quantitative measurement of drugs, their metabolites, and relevant biomarkers in biological samples. Every concentration number in a pharmacokinetic report — every Cmax, every AUC, every half-life — originates in a bioanalytical lab.
The core question bioanalysis answers is: how much drug is in this sample? The answer drives every go/no-go decision in drug development. If plasma concentrations are too low to reach the target, the candidate is dropped. If a metabolite accumulates unexpectedly, the safety team needs to know. If a generic formulation fails to match the reference drug's concentration-time profile, the ANDA is rejected.
Small molecule and large molecule bioanalysis are two fundamentally different disciplines. Small molecules — synthetic chemicals under roughly 900 Daltons — are measured with LC-MS/MS. Large molecules — monoclonal antibodies, fusion proteins, gene therapy vectors — are measured with ligand-binding assays (LBA) such as ELISA. The analytical logic, instrumentation, and validation framework differ completely. This article focuses on small molecule bioanalysis: the LC-MS/MS-centered discipline that quantifies most oral drugs, antivirals, antibiotics, kinase inhibitors, and CNS agents in development today.
Small Molecules vs Large Molecules: Two Worlds of Bioanalysis
What Separates Small from Large
Small molecules are synthetic organic compounds typically under 900 Daltons: statins, antivirals, kinase inhibitors, SSRIs, beta-blockers. They are chemically defined, structurally unambiguous, and compatible with chromatographic separation. Large molecules are biologics: monoclonal antibodies (~150,000 Da), fusion proteins, ADCs, and gene therapy vectors. Their size, structural heterogeneity, and biological complexity demand entirely different analytical strategies.
Why Small Molecules Go to LC-MS/MS and Large Molecules Go to ELISA
Small molecules suit LC-MS/MS for three reasons: structural certainty (a triple quadrupole identifies a molecule by precursor ion, fragments it, and confirms it by product ions — two layers of specificity no plate-based assay can match), sensitivity (pg/mL limits routinely achievable), and multiplexing (10-20 analytes in a single run).
Large molecules require ELISA because mass spectrometers cannot handle 150,000-Dalton proteins intact. ELISA captures the target via antibody binding and generates a colorimetric or fluorescent signal proportional to concentration. The measurement reflects functional activity — the protein actually binds the antibody — which is biologically meaningful in ways mass-based detection alone cannot capture. A practical rule: if the analyte has a CAS number and a defined molecular weight, it goes to LC-MS/MS. If it needs an antibody capture step, it goes to LBA.
The Blurring Middle
Therapeutic peptides (1,000-5,000 Da) can be quantified by LC-MS/MS, though larger peptides may need immunoaffinity enrichment first. ADCs present a unique case: the intact ADC is measured by ELISA, while the released small-molecule payload is measured by LC-MS/MS. Oligonucleotides and siRNAs are increasingly analyzed by LC-MS/MS with specialized ion-pairing chromatography. Hybrid immunoaffinity-LC-MS/MS approaches — combining LBA selectivity with MS specificity — are becoming the default for these in-between targets.
The Bioanalytical Toolbox: LC-MS/MS, HPLC-UV, and ELISA at a Glance
LC-MS/MS: The Gold Standard for Small Molecules
An LC-MS/MS system combines liquid chromatography (LC) with tandem mass spectrometry (MS/MS). The LC separates molecules by reversed-phase chromatography — analytes partition between a hydrophobic C18 stationary phase and a water/acetonitrile gradient, eluting at characteristic retention times. The mass spectrometer ionizes each eluting compound via electrospray (ESI), then performs multiple reaction monitoring (MRM): Q1 selects the precursor ion, Q2 fragments it by collision with nitrogen, and Q3 selects a characteristic product ion for detection. The output is a chromatogram whose peak area is proportional to concentration. Comparing peak areas against a calibration curve of known standards yields the final concentration.
HPLC-UV: Simpler but Limited
HPLC-UV uses the same separation principle but detects by UV absorbance rather than mass. It is simpler and cheaper, adequate when concentrations are high (ug/mL range) and matrix complexity is low — dissolution testing, formulation analysis, quality control. However, sensitivity is 100-1,000 times lower than LC-MS/MS, and co-eluting compounds that absorb at the same wavelength cannot be distinguished. For low-concentration PK samples from preclinical or clinical studies, LC-MS/MS is the required platform.
ELISA: When the Target Is Too Large
ELISA is the primary tool for large molecule bioanalysis. A sandwich of capture antibody, analyte, and detection antibody produces a signal proportional to concentration. Advantages: biological relevance (measures what actually binds), established regulatory acceptance. Limitations: narrow dynamic range (2-3 vs 4-5 orders of magnitude for LC-MS/MS), months-long antibody generation, and matrix interference susceptibility.
How to Choose
There is no universally best platform. A discovery-stage small molecule program needs LC-MS/MS speed and multiplexing. A clinical-stage biologic needs a validated ELISA. A therapeutic peptide might benefit from hybrid immunoaffinity-LC-MS/MS. The question is not "which platform is best?" but "which platform answers the question at this stage?"
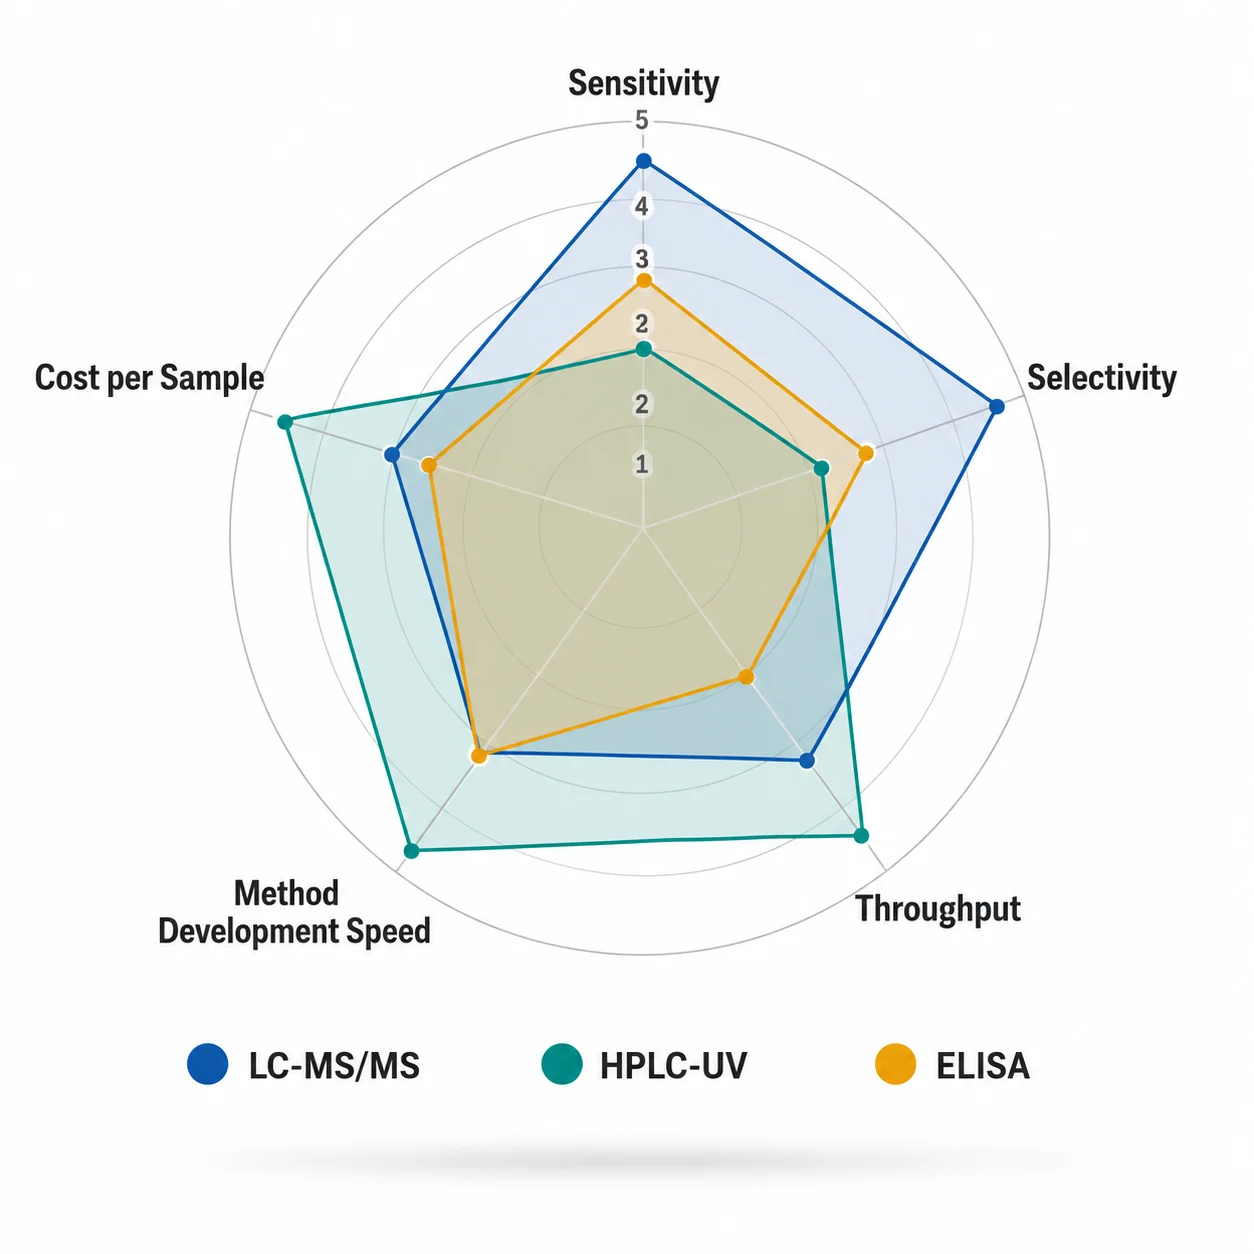 Figure 2: Platform Radar Comparison — LC-MS/MS, HPLC-UV, and ELISA
The Bioanalytical Workflow: From Biological Sample to Concentration Number
Every bioanalytical result follows a five-stage path. Each decision propagates downstream — a poor sample preparation choice cannot be rescued by a good chromatographic method.
Step 1 — Sample Collection
The most common matrices are plasma (collected with anticoagulant, e.g. K2EDTA), serum (collected without anticoagulant), whole blood, urine, and tissue homogenate. Plasma and serum are the workhorses of systemic exposure measurement. The choice between them is not arbitrary: some drugs bind differentially to clotting factors, meaning serum and plasma concentrations can diverge. Whole blood is used when the drug partitions into red blood cells. Urine measures renal excretion. Tissue homogenate answers whether the drug reaches the target organ.
Sample collection also dictates stability requirements. Blood must be centrifuged promptly to separate plasma. Tissue must be snap-frozen or homogenized immediately to halt metabolism. Freeze-thaw cycles must be tracked — each cycle can degrade labile compounds.
Step 2 — Sample Preparation
Biological samples contain proteins, phospholipids, salts, and endogenous compounds that interfere with measurement. Three approaches exist. Protein precipitation (PPT) is simplest: add acetonitrile or methanol, vortex, centrifuge — proteins crash out, analyte stays in the supernatant. It is fast but provides minimal cleanup; residual phospholipids can cause matrix effects. Liquid-liquid extraction (LLE) partitions the analyte between immiscible solvents, yielding cleaner extracts. Solid-phase extraction (SPE) passes sample through a selective sorbent bed, producing the cleanest extracts and enabling concentration of dilute samples, but requires more development time. Discovery samples may use PPT alone; regulatory clinical samples almost always need SPE or LLE.
Step 3 — Chromatographic Separation
The prepared extract enters an HPLC or UPLC column. Most small molecule work uses reversed-phase C18 columns with a water/acetonitrile gradient. Hydrophobic analytes retain longer; hydrophilic ones elute earlier. This temporal separation resolves the analyte from residual matrix components and metabolites. Modern UPLC uses sub-2-micron particles at up to 15,000 psi for faster separations with sharper peaks — typical gradients run 2-5 minutes.
Step 4 — Mass Spectrometric Detection
Eluting compounds enter the ESI source, where high voltage creates a fine spray of charged droplets. As solvent evaporates, analyte ions enter the gas phase and pass into the triple quadrupole. Q1 selects the precursor ion [M+H]+. Q2 fragments it via collision with nitrogen. Q3 selects a characteristic product ion. The detector counts these ions, producing a peak. The selection-fragmentation-selection sequence occurs in milliseconds, enabling multiple analytes per run. The result is extraordinary specificity: only a molecule with the right precursor mass AND product mass AND retention time produces a signal.
Step 5 — Data Processing
The data system integrates each peak and compares its area against a calibration curve built from 6-8 standards at known concentrations, analyzed in the same batch. QC samples at known concentrations, interspersed throughout the run, verify the calibration remains valid. The final output: a concentration in ng/mL, with precision and accuracy the method's validation supports. For a step-by-step walkthrough of the complete LC-MS/MS quantification workflow — from method setup through chromatographic optimization to final concentration reporting — see our comprehensive guide on single-drug quantification by LC-MS/MS.
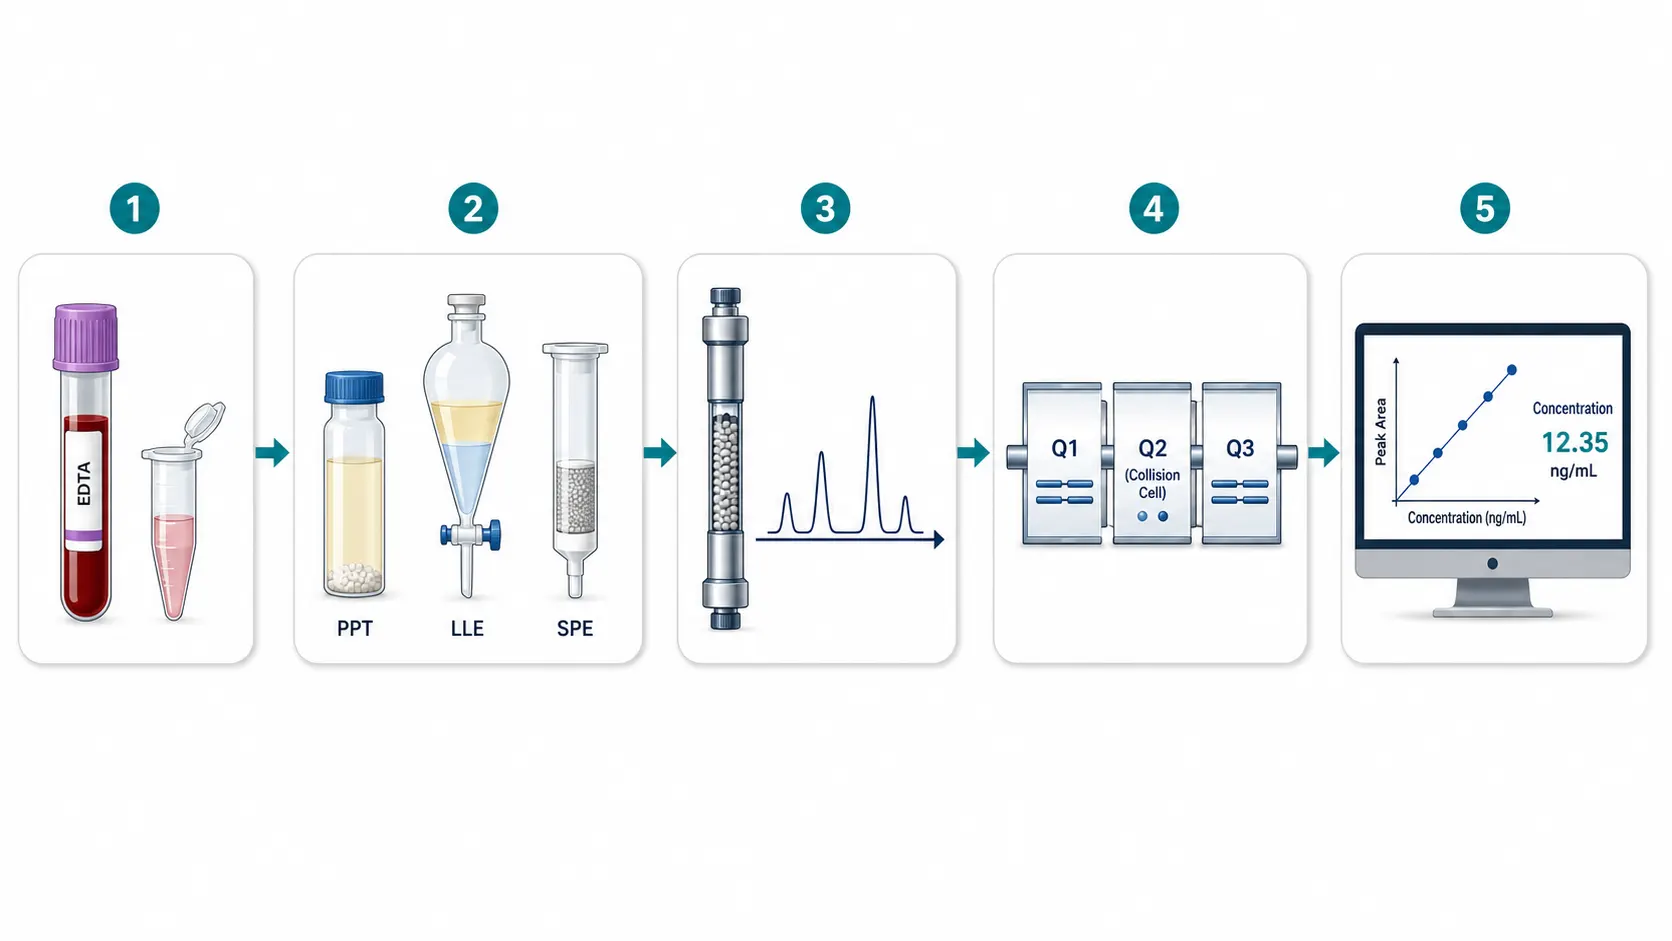 Figure 3: Five-Stage Bioanalytical Workflow
Bioanalysis Across the Drug Development Pipeline: Same Tool, Different Questions
The same LC-MS/MS instrument serves every stage, but the questions and the rigor required change dramatically.
Discovery Phase: Speed Over Precision
The goal in early discovery is ranking: which of 50 analogs has the best exposure? Which structural change improves metabolic stability? Methods are generic — a 3-minute C18 gradient, partial validation only, cassette dosing where multiple compounds are quantified simultaneously. Acceptable error is wider (+-25-30%) because the decision is "advance or drop," not "submit to a regulator."
Preclinical Phase: Building the Dosing Case
Once a lead is selected, bioanalysis shifts to full PK profiling across species — mouse, rat, dog, sometimes non-human primate. The method must work across matrices: same extraction, same column, same MRM transitions, but validated in each species' matrix. Metabolite identification enters the picture: what does the body do to this drug? Are metabolites active or toxic? Toxicokinetics — measuring exposure in safety-study animals — becomes a regulatory requirement. Methods are more thoroughly characterized but may not yet meet full GLP criteria.
Clinical Phase (I-III): Regulatory-Grade Data
By clinical entry, the method must be fully validated: accuracy within +-15% (+-20% at LLOQ), precision within 15% CV, stability demonstrated for every condition samples will experience. Every concentration in a clinical study report must be traceable to a validated method and a documented analytical run. Regulatory inspectors review bioanalytical data in every drug approval.
The Method Evolution Pathway
Discovery methods cannot simply be upgraded to clinical methods. A discovery method prioritizes speed and generic applicability — one gradient for 50 compounds. A clinical method requires validated specificity for one compound and its metabolites, with documented stability in the actual clinical matrix. Most programs transition through three versions: discovery (generic, partial validation), preclinical (compound-specific, cross-species), clinical (fully locked, GLP-validated). The practical lesson: plan bioanalytical strategy at candidate nomination, not at IND filing. Late-stage method redevelopment is expensive and delays submission. For a detailed walkthrough of the validation parameters and acceptance criteria that govern each stage, see our guide to bioanalytical method development and validation strategies.
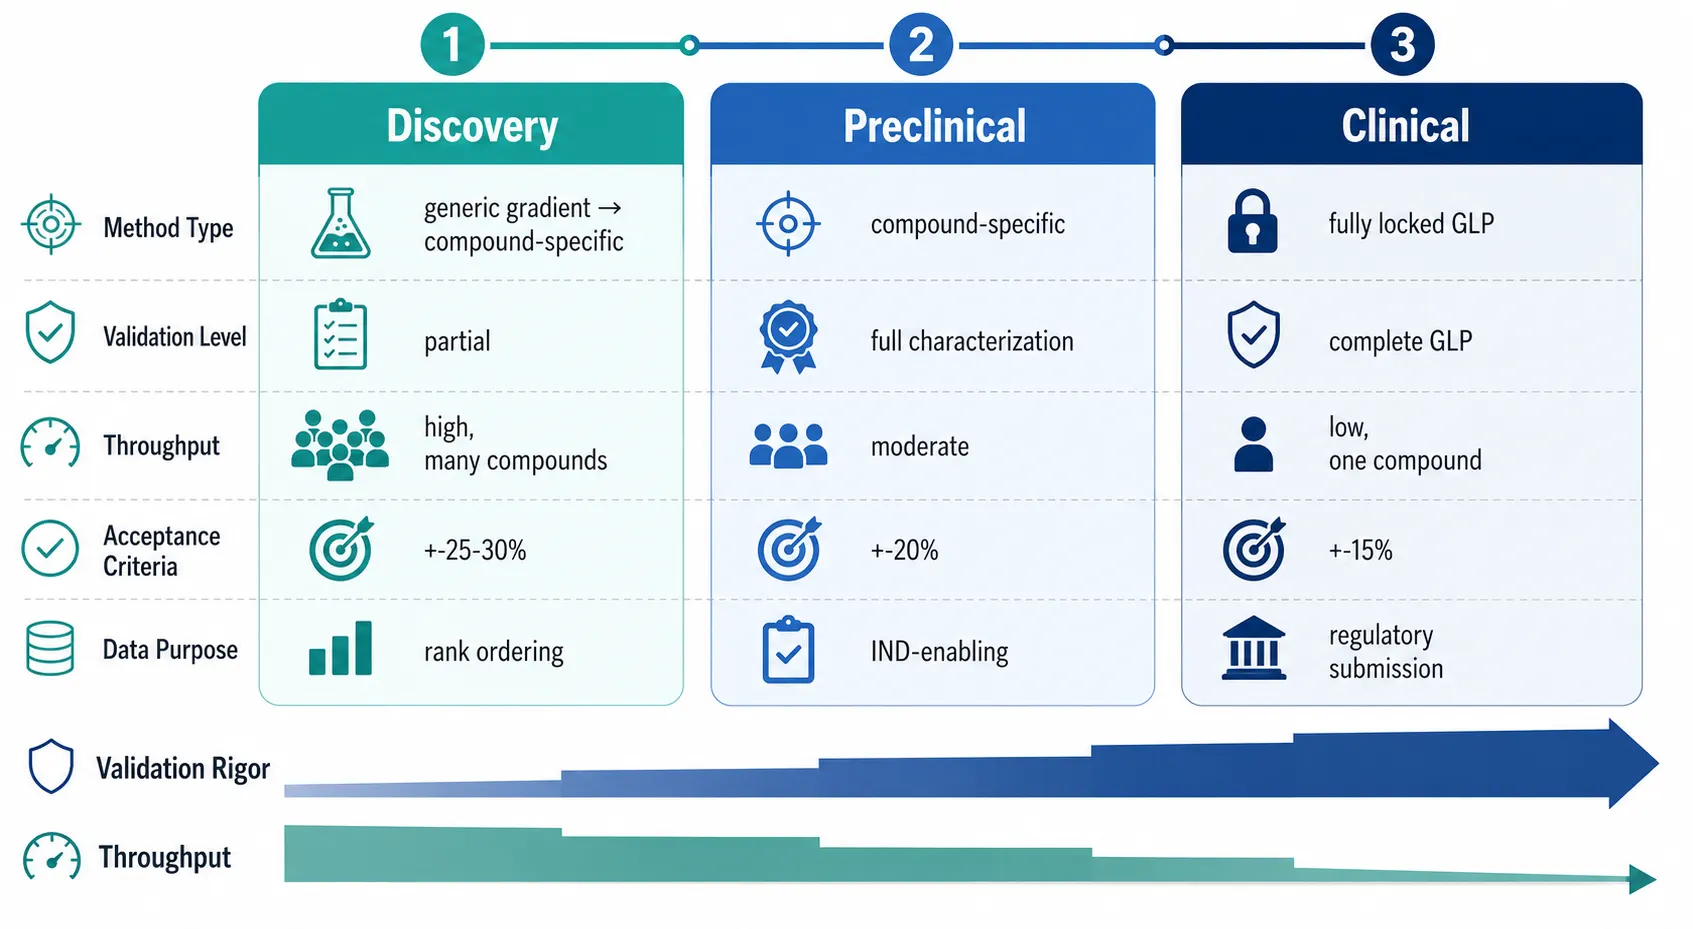 Figure 4: Bioanalysis Demands Across Development Stages
What This Means for the Project Team
Bioanalytical input should be present from lead optimization onward. Matrix choice, stability profile, and metabolite liability all affect method feasibility. A compound degrading in plasma at room temperature needs cold-chain handling from the first preclinical PK study. An active metabolite requires simultaneous parent-metabolite quantification — doubling development effort. For programs without internal capability, specialized CRO labs offer validated LC-MS/MS single drug quantification services spanning discovery through clinical stages; the key is engaging them early enough to align method development with the project timeline.
Key Bioanalytical Parameters: What Gets Measured and Why
The Four Pillars
Accuracy is how close the measured concentration is to the true value (% bias). Precision is how reproducible the measurement is (% CV). Selectivity is the ability to measure the analyte in the presence of metabolites, endogenous compounds, and co-administered drugs — LC-MS/MS provides inherent selectivity through MRM, but matrix effects must still be systematically evaluated. Sensitivity is defined by the lower limit of quantification (LLOQ), the lowest concentration measurable with acceptable accuracy (+-20%) and precision (20% CV). The LLOQ determines whether the method can track the drug through terminal elimination, which is essential for accurate half-life estimation.
To make these parameters concrete, consider a typical LC-MS/MS method for a kinase inhibitor in human plasma: LLOQ of 1 ng/mL, linear range 1-1,000 ng/mL, using a 2.1 x 50 mm C18 column with a 4-minute acetonitrile gradient on a triple quadrupole MS in positive ESI mode. Accuracy at the LLOQ must be within +-20% (i.e., 0.8-1.2 ng/mL); at mid and high QC levels, within +-15%. This is a representative specification for a method supporting preclinical PK — clinical methods may tighten the LLOQ to 0.1 ng/mL depending on the dose and half-life.
Calibration Curve and Quality Controls
Every analytical batch includes 6-8 calibration standards spanning the expected concentration range, prepared in the same matrix as study samples. Peak area is plotted against concentration using linear regression with 1/x^2 weighting. QC samples at three to four levels (LLOQ, low, mid, high), prepared independently from calibrators, are interspersed through each run. At least two-thirds of all QCs, and at least 50% at each level, must fall within +-15% of nominal for the batch to be accepted.
Why Parameters Scale Across Stages
A discovery method may accept +-25% accuracy because it ranks candidates whose differences are large. A clinical method must deliver +-15% accuracy because bioequivalence can hinge on a 10% difference. The same parameters apply, but acceptance thresholds tighten as regulatory stakes rise.
GLP vs Non-GLP Bioanalysis: Matching Rigor to the Question
What GLP Means in Bioanalysis
Good Laboratory Practice (GLP), defined by 21 CFR Part 58 (US) and OECD Principles, governs the organizational framework — study protocols, study director responsibilities, raw data archiving, SOP governance, independent QA unit — not the analytical methods themselves. GLP is legally required for safety studies submitted to regulators (including toxicokinetics). It is not required for discovery screening, early preclinical PK, or method development.
Fit-for-Purpose and ISO 17025
The fit-for-purpose principle — formalized through the Crystal City conferences — holds that validation level should match the data's intended use. Over-validating a discovery method wastes resources; under-validating a clinical method risks regulatory rejection. ISO 17025 provides a middle ground: it certifies a lab's overall quality management system — staff competence, equipment calibration, proficiency testing — without full GLP overhead. For non-regulatory work, ISO 17025 accreditation signals technical competence while preserving operational flexibility.
Practical Trade-offs
GLP bioanalysis is submission-ready but slower and more expensive. Non-GLP work under ISO 17025 is faster and more flexible — methods can adapt mid-study — but data may need bridging validation for regulatory use. The decision should follow the actual regulatory question: does this data go to a regulator, or does it drive an internal decision?
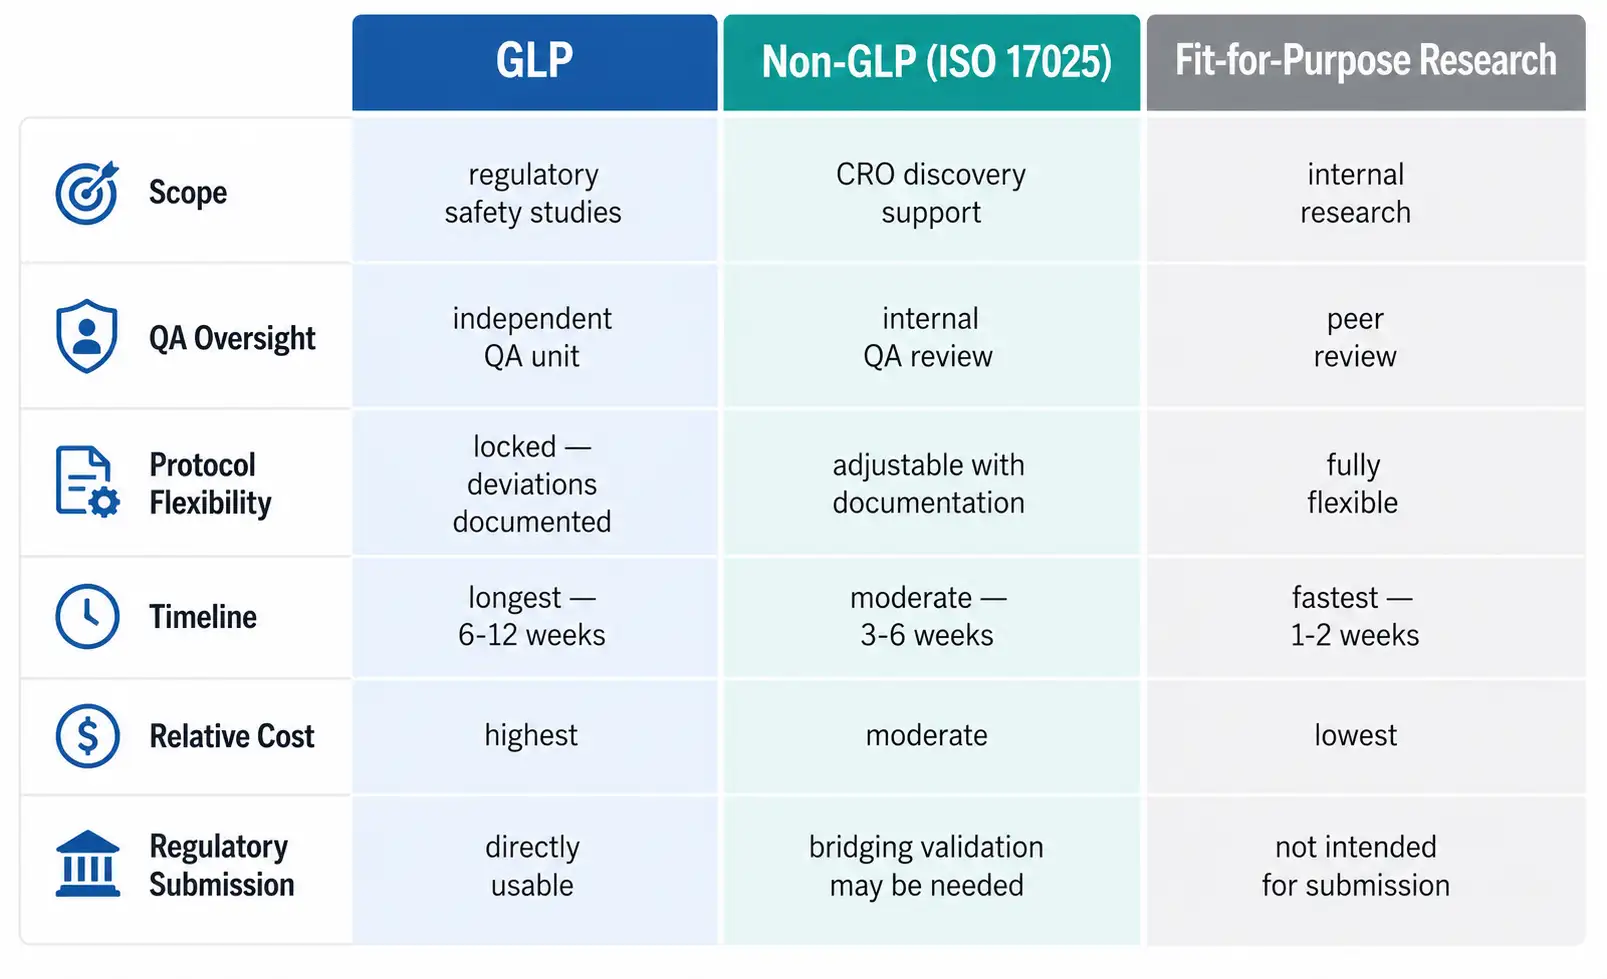 Figure 5: GLP vs Non-GLP vs ISO 17025 Comparison Matrix
Common Challenges in Small Molecule Bioanalysis
Matrix Effects
The most pervasive challenge in LC-MS/MS bioanalysis is ionization suppression or enhancement by co-eluting matrix components, especially phospholipids. Even with a clean chromatogram, invisible phospholipid co-elution can suppress ionization by 30-50%, causing under-reporting. Detection uses post-column infusion or post-extraction addition experiments. Countermeasures include better cleanup (LLE/SPE over PPT), chromatographic resolution from phospholipid zones, and stable isotope-labeled internal standards that track the analyte's ionization behavior exactly. For a deeper treatment — including post-column infusion protocols, phospholipid profiling, and lot-to-lot variability strategies — see our dedicated guide on bioanalytical matrix effect evaluation and mitigation.
Low-Concentration Detection and Unstable Compounds
Potent drugs at low doses push LLOQ requirements to 50 pg/mL or below, demanding larger sample volumes with concentrating SPE, UPLC for sharper peaks, and the most sensitive MS platforms. At these levels, nonspecific binding to plastic surfaces becomes significant. Unstable compounds — prodrugs that hydrolyze ex vivo, reactive metabolites that form adducts — require immediate chilling, acidification, or enzyme inhibitors at collection. Stability must be demonstrated experimentally: bench-top, freeze-thaw (minimum three cycles), and long-term frozen storage at both -20degC and -70degC.
Carryover and Nonspecific Binding
Carryover occurs when analyte from a high-concentration sample adsorbs to LC or autosampler surfaces and appears in subsequent blanks. Nonspecific binding depletes low-concentration analyte through adsorption to plastic. Carryover is managed by needle wash protocols and blank injections after high samples. Nonspecific binding is addressed with low-binding plates, surfactant or carrier protein in the diluent, or silanized glass.
How the 2026 Toolkit Is Evolving
Several emerging technologies are directly addressing these longstanding challenges — microflow LC boosting sensitivity while reducing solvent consumption, microsampling enabling serial PK from single animals, and AI-assisted data processing automating chromatogram review. Each is explored in the next section.
What Is Changing: 2026 Trends in Small Molecule Bioanalysis
Five developments are actively reshaping the field — all in deployment today, not distant promises.
Microsampling via DBS and VAMS has moved to mainstream. Serial PK from a single mouse reduces animal use by 80-90%. At-home finger-prick sampling for clinical trials eliminates clinic visits for PK draws. The analytical challenge — quantifying drug from 10 uL dried blood with adequate sensitivity — has been largely solved through optimized extraction and microflow LC-MS/MS.
Microflow LC with 1-mm columns at 50-150 uL/min produces smaller ESI droplets, improving ionization efficiency 2-5x over standard 2.1-mm columns. The reduced flow matches microsampling volumes and cuts solvent consumption by 75%.
AI-assisted data processing automates peak integration and anomaly detection — flagging integration failures, retention time shifts, and QC deviations for human review — reducing routine chromatogram inspection time by 50-70%.
High-resolution mass spectrometry (HRMS) is entering routine quantitation. Modern HRMS platforms approach triple quadrupole quantitative performance while collecting full-scan data that captures every ionized species. This enables parent drug quantitation and retrospective metabolite identification from a single injection.
Hybrid LBA-LC-MS/MS — immunoaffinity capture followed by tryptic digestion and LC-MS/MS of a surrogate peptide — combines LBA selectivity with MS specificity. It is becoming the standard for ADC payload quantification and is increasingly used for difficult small-molecule targets where matrix interference is severe.
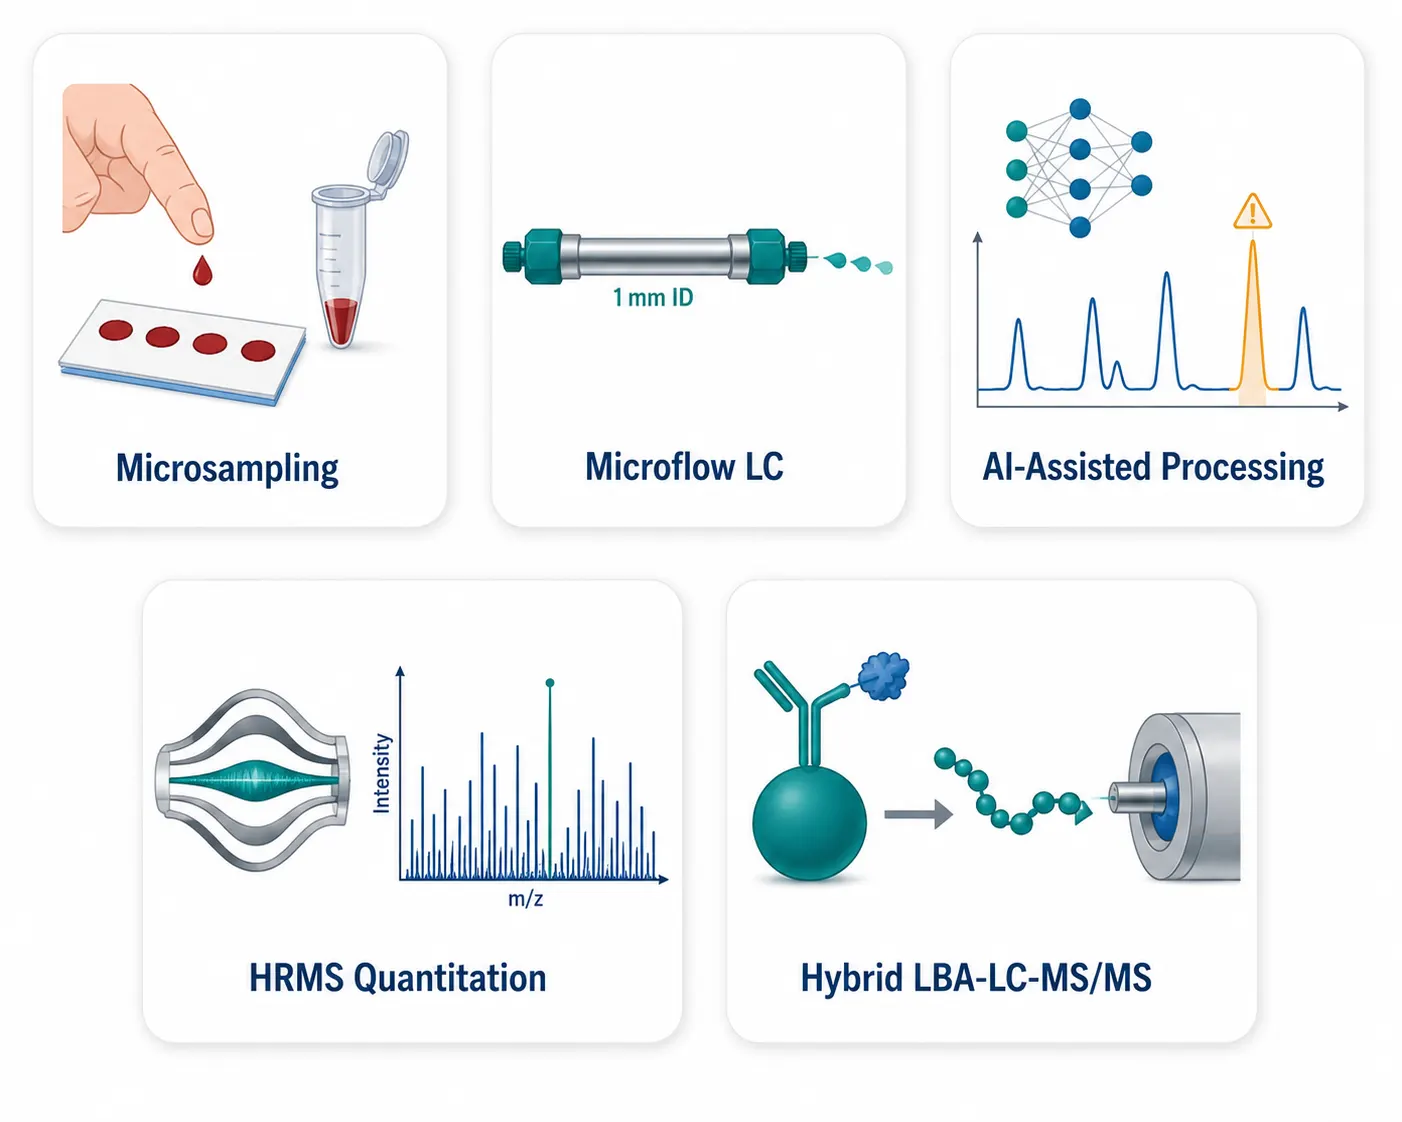 Figure 6: 2026 Bioanalysis Innovation Landscape
Frequently Asked Questions
What is the difference between bioanalysis and analytical chemistry?
Bioanalysis is analytical chemistry applied to biological matrices — plasma, blood, urine, tissue — where the matrix itself is the primary challenge. Standard analytical chemistry deals with simpler matrices and does not face the same extraction, matrix effect, and stability demands.
How much sample volume is needed for a typical LC-MS/MS analysis?
Typically 50-100 uL of plasma. Microsampling methods work with 10-30 uL. Volume depends on the required LLOQ and the sample preparation approach — SPE can concentrate larger volumes; PPT is limited by dilution.
How long does it take to develop a bioanalytical method?
A fit-for-purpose discovery method: 1-2 weeks. A fully validated clinical method: 4-8 weeks, including real-time stability studies and cross-validation. The limiting step is often stability testing.
Do I need GLP validation for my preclinical study?
Not unless the data supports a regulatory safety study. Most preclinical PK uses non-GLP methods with partial validation. Confirm with your regulatory group whether GLP toxicokinetics will be required.
What is the most common mistake in bioanalytical study design?
Underestimating stability. A compound degrading at room temperature in whole blood produces falsely low concentrations from the moment of collection. Run preliminary stability tests before committing to a large PK study.
Can LC-MS/MS measure biologics?
LC-MS/MS can measure biologics indirectly via surrogate peptide analysis after tryptic digestion, but not intact proteins directly. For intact biologics, ELISA and LBA remain the primary tools. Hybrid immunoaffinity-LC-MS/MS is expanding the scope.
What does ISO 17025 accreditation mean for a bioanalytical lab?
It certifies that the lab's quality management system — staff competence, equipment calibration, SOP governance, proficiency testing — has been independently audited. It signals technical competence without full GLP regulatory overhead.
How are matrix effects detected and corrected?
Detection uses post-column infusion (continuous analyte infusion while injecting blank matrix extract — a signal dip at the analyte retention time indicates suppression) or post-extraction addition (comparing response in neat solvent vs spiked into extracted blank matrix). Correction uses stable isotope-labeled internal standards that co-elute with the analyte and experience identical ionization suppression.
References
- Matuszewski BK, Constanzer ML, Chavez-Eng CM. Strategies for the assessment of matrix effect in quantitative bioanalytical methods based on HPLC-MS/MS. Analytical Chemistry. 2003;75(13):3019-3030.
- ICH Harmonised Guideline. Bioanalytical Method Validation and Study Sample Analysis M10. International Council for Harmonisation of Technical Requirements for Pharmaceuticals for Human Use; 2022.
- Viswanathan CT, Bansal S, Booth B, et al. Quantitative bioanalytical methods validation and implementation: best practices for chromatographic and ligand binding assays. Pharmaceutical Research. 2007;24(10):1962-1973.
- Van Eeckhaut A, Lanckmans K, Sarre S, Smolders I, Michotte Y. Validation of bioanalytical LC-MS/MS assays: evaluation of matrix effects. Journal of Chromatography B. 2009;877(23):2198-2207.
- Timmerman P, Lowes S, Fast DM, et al. Request for global harmonization of the guidance for bioanalytical method validation and sample analysis. Bioanalysis. 2010;2(4):683-686.
- European Medicines Agency. Guideline on Bioanalytical Method Validation. EMEA/CHMP/EWP/192217/2009 Rev. 1 Corr. 2. European Medicines Agency; 2011.
- Chambers E, Wagrowski-Diehl DM, Lu Z, Mazzeo JR. Systematic and comprehensive strategy for reducing matrix effects in LC/MS/MS analyses. Journal of Chromatography B. 2007;852(1-2):22-34.
- Korfmacher WA. Foundation review: principles and applications of LC-MS in new drug discovery. Drug Discovery Today. 2005;10(20):1357-1367.
- OECD. OECD Principles of Good Laboratory Practice. OECD Series on Principles of Good Laboratory Practice and Compliance Monitoring, No. 1. OECD Publishing; 1998.
- Li W, Zhang J, Tse FLS. Strategies in quantitative LC-MS/MS analysis of unstable small molecules in biological matrices. Biomedical Chromatography. 2011;25(1-2):258-277.
Disclaimer: All services and resources mentioned on this site are for research use only (RUO) and are not intended for diagnostic, therapeutic, or clinical applications.
Related Services


