Why Identify Degradants? ICH Thresholds and the Regulatory Mandate
A degradation product observed in a stability chromatogram is not merely a peak — it is a chemical entity with a molecular structure, a formation mechanism, a potential toxicity profile, and a regulatory status that depends on how much of it is present. The threshold that triggers structural identification is defined by ICH Q3A(R2) (drug substance) and Q3B(R2) (drug product): any impurity present at or above 0.1% of the drug substance (or 1.0 mg total daily intake, whichever is lower) must be identified — meaning its chemical structure must be determined. Below 0.1% but above 0.05% (drug substance) or 0.1% (drug product), the degradant must be reported but structural identification is not mandatory. Above the qualification threshold of 0.15% (or 1.0 mg/day), the degradant must be qualified for safety — a process that requires knowing what it is and whether it poses a genotoxic, cytotoxic, or organ-specific risk.
The regulatory logic is straightforward but demanding: you cannot qualify what you cannot identify, and you cannot identify what your analytical method cannot structurally characterize. This is where forced degradation studies and degradant structural elucidation form a linked analytical chain — the stress study generates the degradants and demonstrates that the stability-indicating method resolves them; the structural elucidation step determines what they are, how they formed, and whether they warrant toxicological concern.
At Creative Proteomics DMPK, degradant structural elucidation is performed as an integrated LC-HRMS/MS workflow — high-resolution accurate mass for molecular formula determination, MS/MS fragmentation for structural assignment, and preparative isolation with NMR confirmation when the degradant exceeds ICH identification thresholds and the structure cannot be unambiguously assigned from mass spectral data alone.
A stability-indicating HPLC method tells you that the degradant is resolved from the API. Degradant structural elucidation tells you what the degradant is. Without the former, you cannot quantify. Without the latter, you cannot qualify. The two disciplines — stability-indicating method development and degradant structural elucidation — are the analytical twin pillars of a defensible stability program.
The Degradant Identification Workflow: From Stressed Sample to Structural Assignment
Degradant structural elucidation is not a single experiment — it is a multi-step analytical workflow that progresses from detection through isolation to structural confirmation. Each step builds on the previous one, and skipping steps — for example, attempting MS/MS interpretation without first confirming the molecular formula by accurate mass — is the most common source of incorrect structural assignments.
Step 1: Detection and Chromatographic Mapping. The forced degradation samples — acid, base, oxidative, thermal, and photolytic stress — are first analyzed by the stability-indicating HPLC or UHPLC method with PDA detection. Each peak in the chromatogram is catalogued: retention time, relative retention time (RRT) versus the API, peak area percentage, and UV λmax. Peaks that appear in stressed samples but are absent in the unstressed control are flagged as potential degradants. The UV spectrum provides a first clue: a degradant with a λmax identical to the parent drug likely shares the same chromophore and may be a side-chain modification product; a degradant with a blue-shifted or red-shifted λmax suggests modification of the chromophore itself — ring opening, oxidation of an aromatic system, or conjugation.
The chromatographic method that separates degradants for MS analysis is itself the product of systematic bioanalytical method development and validation — the column, mobile phase, and gradient that resolve the API from its degradation products under UV detection must be transferred to MS-compatible conditions without losing the critical separations that make the method stability-indicating in the first place.
Step 2: LC-MS Screening with High-Resolution Mass Spectrometry. The same (or a directly transferred, MS-compatible) chromatographic method is coupled to a high-resolution mass spectrometer — Q-TOF or Orbitrap — operating in full-scan data-dependent acquisition (DDA) mode. For each potential degradant peak, the instrument acquires a full-scan MS spectrum (for molecular formula determination from accurate mass) and an MS/MS product ion spectrum (for structural fragmentation analysis). The mass accuracy requirement is ≤ 5 ppm, and the isotopic pattern must match the proposed molecular formula to within 95% confidence. This step answers the question "what is the elemental composition of this degradant?" — generally C, H, N, O, and any heteroatoms (S, Cl, Br) present in the parent drug.
Step 3: MS/MS Fragmentation Analysis. With the molecular formula in hand, the MS/MS spectrum — the pattern of fragment ions produced by collisional activation of the degradant's molecular ion — is interpreted to determine the connectivity of atoms. The key question is: "where in the parent drug structure did the chemical modification occur?" By comparing the degradant's fragmentation pattern to that of the parent API (analyzed under identical MS/MS conditions), the analyst identifies which fragment ions are conserved (indicating an unmodified portion of the molecule) and which are mass-shifted (indicating the site of degradation). This comparative fragmentation approach — sometimes called "fragmentation mapping" or "differential MS/MS" — is the intellectual core of degradant structural elucidation.
Step 4: Isolation and NMR Confirmation (When Required). For degradants that exceed ICH identification thresholds and whose structures cannot be unambiguously assigned from MS data alone — for example, regioisomeric degradants where the modification site is ambiguous, or degradants involving skeletal rearrangements — preparative HPLC is used to isolate the degradant in sufficient quantity and purity for 1D and 2D NMR analysis (¹H, ¹³C, COSY, HSQC, HMBC). NMR provides the definitive proof of structure that even the highest-resolution mass spectrum cannot: bond connectivity through J-coupling, through-space proximity through NOE, and the unambiguous assignment of regioisomerism and stereochemistry.
Step 5: Degradation Pathway Reconstruction. The final step is mechanistic: using the structures of all identified degradants, the analyst reconstructs the degradation pathway — the sequence of chemical transformations that converted the parent drug into each observed degradant. This pathway map serves three purposes: it validates that the proposed degradant structures are chemically plausible (a structure that cannot be rationalized by any reasonable degradation mechanism should be questioned); it identifies the functional groups most susceptible to degradation, informing formulation and packaging strategies; and it provides the narrative that regulatory reviewers expect to see in CTD Module 3.2.S.7.1 (drug substance) and 3.2.P.5.4 (drug product).
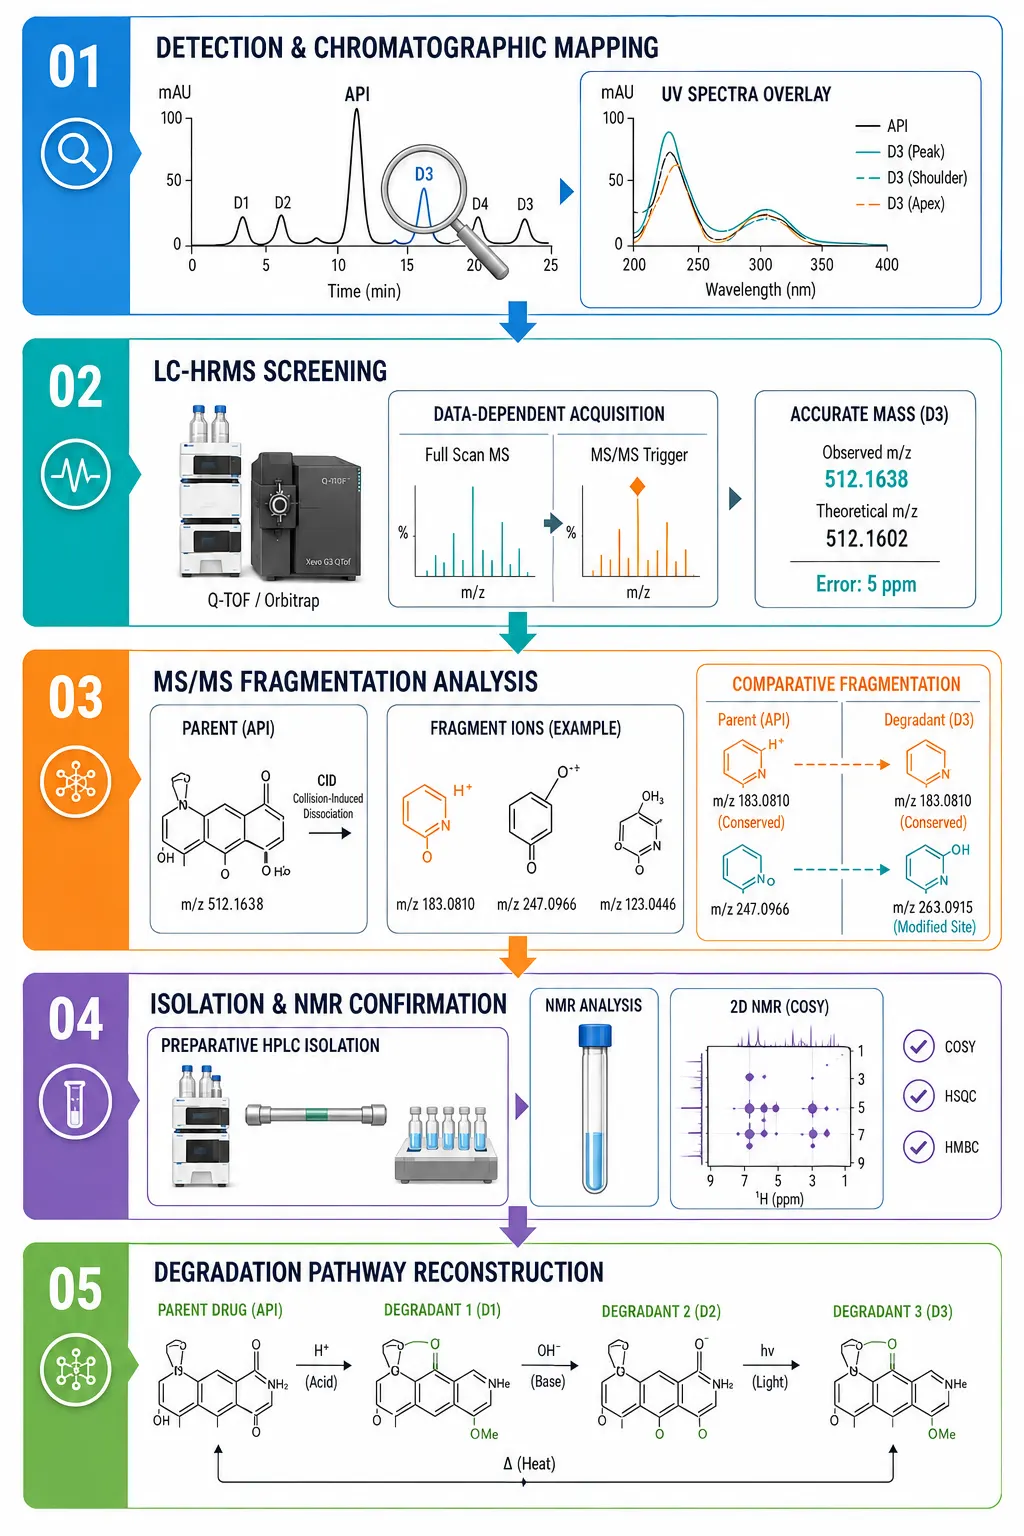 Figure 1: The Five-Step Degradant Structural Elucidation Workflow
High-Resolution Mass Spectrometry: Q-TOF and Orbitrap Platforms for Degradant Analysis
The single most important analytical decision in degradant structural elucidation is the choice of mass spectrometer. Low-resolution instruments (single quadrupole, ion trap) provide nominal mass data that is insufficient for unambiguous molecular formula determination — multiple elemental compositions can match a nominal mass within ±0.5 Da. High-resolution mass spectrometry (HRMS) narrows the uncertainty to ≤ 5 ppm, typically reducing the number of possible molecular formulas for a given accurate mass to one or two candidates. The two platforms that dominate pharmaceutical degradant analysis are quadrupole time-of-flight (Q-TOF) and Orbitrap mass spectrometers, and they offer complementary strengths.
Q-TOF: Speed and Sensitivity for Trace-Level Degradants. Q-TOF instruments combine a quadrupole mass filter for precursor ion selection, a collision cell for fragmentation, and a time-of-flight mass analyzer for high-resolution detection. Their defining advantage is scan speed — Q-TOF instruments can acquire full-scan HRMS and MS/MS spectra at rates exceeding 50 Hz, making them ideal for UHPLC separations with peak widths of 2–5 seconds. Mass accuracy is typically 3–5 ppm with routine calibration, and sensitivity is excellent for trace-level degradants present at 0.05–0.1% of the parent drug. The fast polarity-switching capability of modern Q-TOF instruments (acquiring positive- and negative-ion spectra in alternating scans) is particularly valuable for degradant mixtures containing both basic and acidic species — a common scenario in forced degradation samples.
Orbitrap: Ultra-High Resolution for Isobaric Interferences. Orbitrap instruments use electrostatic trapping and Fourier-transform detection to achieve resolving powers of 120,000–240,000 (FWHM at m/z 200), roughly 3–5× higher than typical Q-TOF operation (30,000–60,000). This resolving power matters when degradants are isobaric — sharing the same nominal mass but differing in elemental composition. For example, an oxidative degradant (+O, +15.9949 Da) and a demethylation-plus-hydroxylation product (−CH₂ + O, +2.0157 Da) may co-elute and produce overlapping mass spectra; an Orbitrap operating at 120,000 resolution can separate these species at the MS level, while a Q-TOF at 40,000 resolution may require chromatographic separation or MS/MS differentiation. Orbitrap instruments with ion-trap hybrid capability (LTQ-Orbitrap, Tribrid) additionally enable MSⁿ experiments — fragmenting a fragment ion to map fragmentation trees — which can be decisive for structural assignment when the MS/MS spectrum alone is ambiguous. The recent literature demonstrates Orbitrap sensitivity down to 0.005% relative abundance for degradant detection (semaglutide forced degradation study, UHPLC-Orbitrap Exploris 240).
Platform Selection Guideline. For most small-molecule degradant elucidation workflows, Q-TOF and Orbitrap are both fully adequate — the choice is often driven by instrument availability rather than capability. Q-TOF is preferred when chromatographic speed is paramount (UHPLC with < 10-minute gradients) and when the degradant mixture is chromatographically well-resolved. Orbitrap is preferred when isobaric interferences are suspected, when MSⁿ capability may be required, or when degradants are present at extremely low levels where ultra-high resolution provides cleaner extracted ion chromatograms. For comprehensive characterization programs — particularly for late-phase regulatory submissions — running samples on both platforms and comparing results provides the highest-confidence structural assignments.
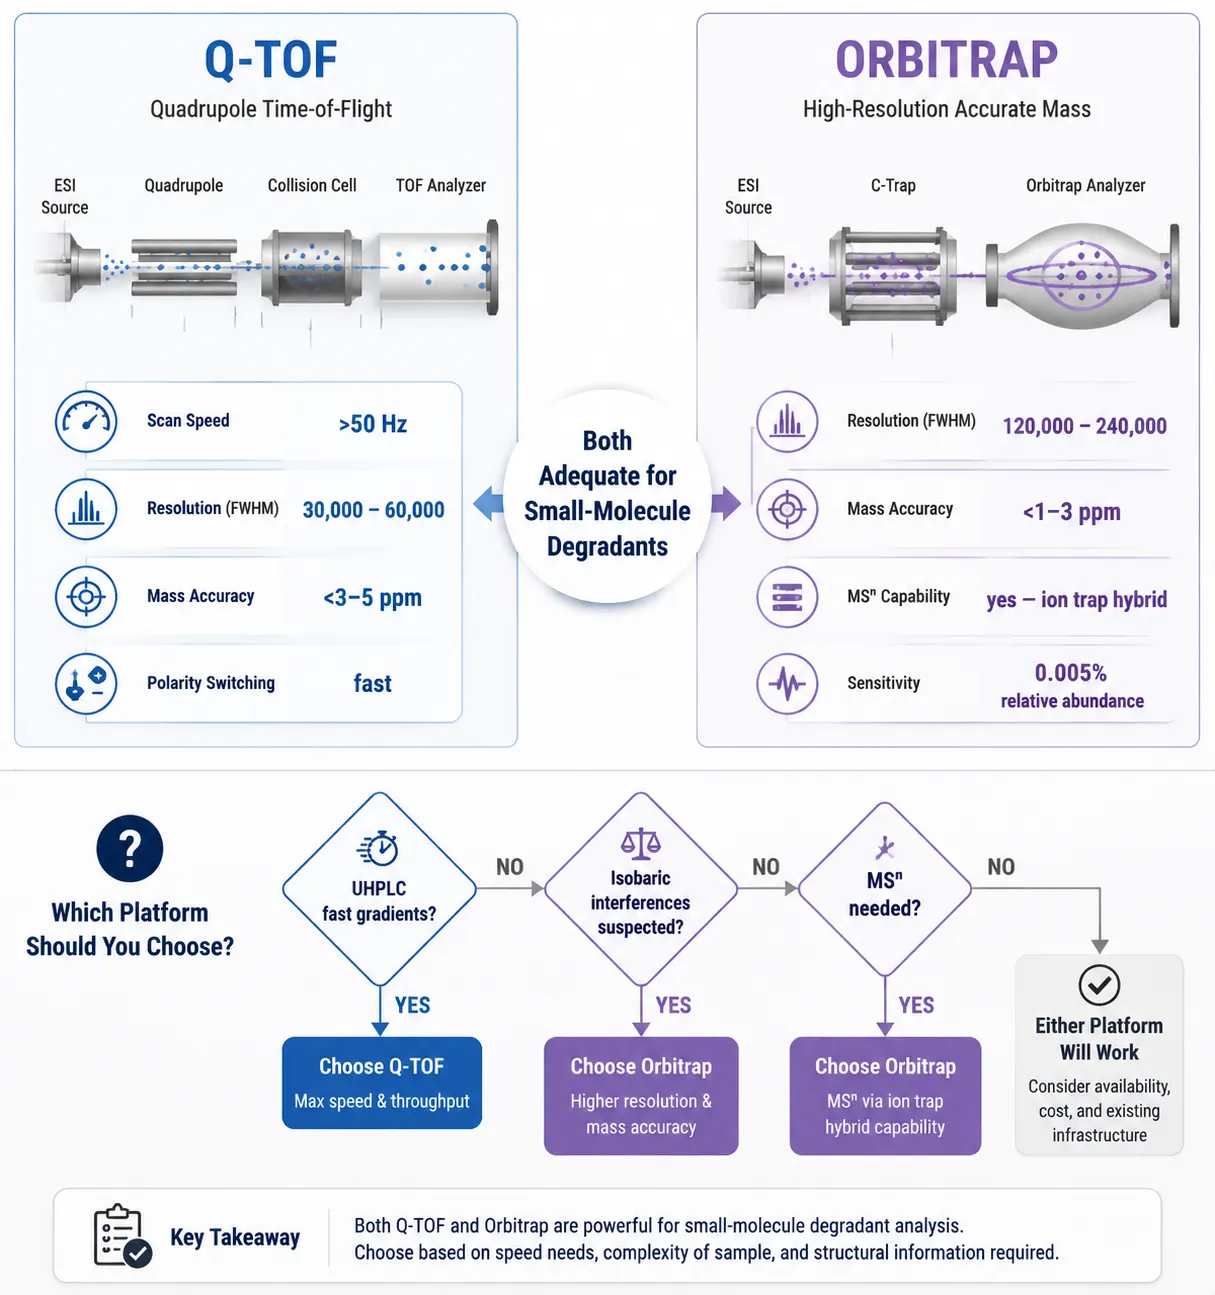 Figure 2: Q-TOF vs. Orbitrap — Platform Comparison for Degradant Structural Elucidation
MS/MS Fragmentation: Reading the Degradant's Structure from Its Fragment Ions
Accurate mass gives you the molecular formula. MS/MS fragmentation gives you the structure. The two data types are complementary and sequential: first confirm what atoms are present (HRMS), then determine how they are connected (MS/MS). The intellectual skill of degradant structural elucidation lies in interpreting the fragmentation pattern — recognizing what each product ion represents, which bonds have broken, and what the pattern of mass differences tells you about where the degradation occurred relative to the parent drug.
The Principle of Comparative Fragmentation. The most powerful approach is not to interpret the degradant's MS/MS spectrum in isolation, but to compare it directly with the MS/MS spectrum of the parent drug acquired under identical collision energy conditions. The parent drug's fragmentation pathway — which bonds cleave under collisional activation, which fragment ions dominate, which neutral losses are characteristic — serves as a reference map. When the degradant's MS/MS spectrum shows the same fragment ions as the parent at the same m/z values, those portions of the molecule are structurally unchanged. When a fragment ion is shifted by a characteristic mass difference — +16 Da for oxidation, +14 Da for methyl ester formation, −2 Da for desaturation — the modification site is localized to that fragment. When a completely new fragment ion appears with no counterpart in the parent spectrum, the degradation has opened a new fragmentation pathway, typically indicating a bond cleavage or rearrangement at the degradation site.
Common Neutral Losses and What They Mean. Certain neutral losses in MS/MS spectra are diagnostic of specific functional groups and degradation chemistries. Loss of 18 Da (H₂O) indicates an alcohol that has dehydrated — common in acid-catalyzed degradation of tertiary alcohols. Loss of 28 Da (CO) suggests a carbonyl that has undergone decarbonylation, often seen in photolytic degradation of ketones. Loss of 44 Da (CO₂) indicates a carboxylic acid that has decarboxylated — a common thermal degradation pathway. Loss of 46 Da (HCOOH or NO₂) can indicate formate ester hydrolysis or nitro group reduction. Recognizing these diagnostic losses — and their relationship to the degradation conditions that generated the degradant — is a skill built on experience and systematic spectral libraries.
Fragmentation Trees and MSⁿ. When the MS/MS spectrum alone leaves ambiguity — for example, when a key fragment ion could arise from two different cleavage pathways — MSⁿ capability (successive fragmentation of fragment ions) can resolve the question by mapping the fragmentation genealogy. An MS³ experiment on an ion-trap or Orbitrap hybrid instrument selects a specific MS/MS product ion, fragments it again, and reveals which of the two candidate pathways is operative. This approach is particularly valuable for degradants with complex rearrangement chemistry, where the initial fragmentation produces an ion whose connectivity is uncertain.
In Silico Fragmentation Prediction. Software tools — Mass Frontier, ACD/MS Fragmenter, and the fragmentation prediction modules within Compound Discoverer and BioPharma Finder — can predict the MS/MS spectrum of a candidate degradant structure and compare it against the experimental spectrum. These tools are not a substitute for analyst judgment, but they accelerate the process by ranking candidate structures by spectral match score and by flagging proposed structures whose predicted fragmentation is incompatible with the experimental data. The 2012 review by Singh et al. provides the foundational framework for systematic fragmentation-based structural characterization that remains the industry standard, while the 2023 review by Khandale et al. updates the landscape with coverage of modern HRMS and hyphenated technique integration.
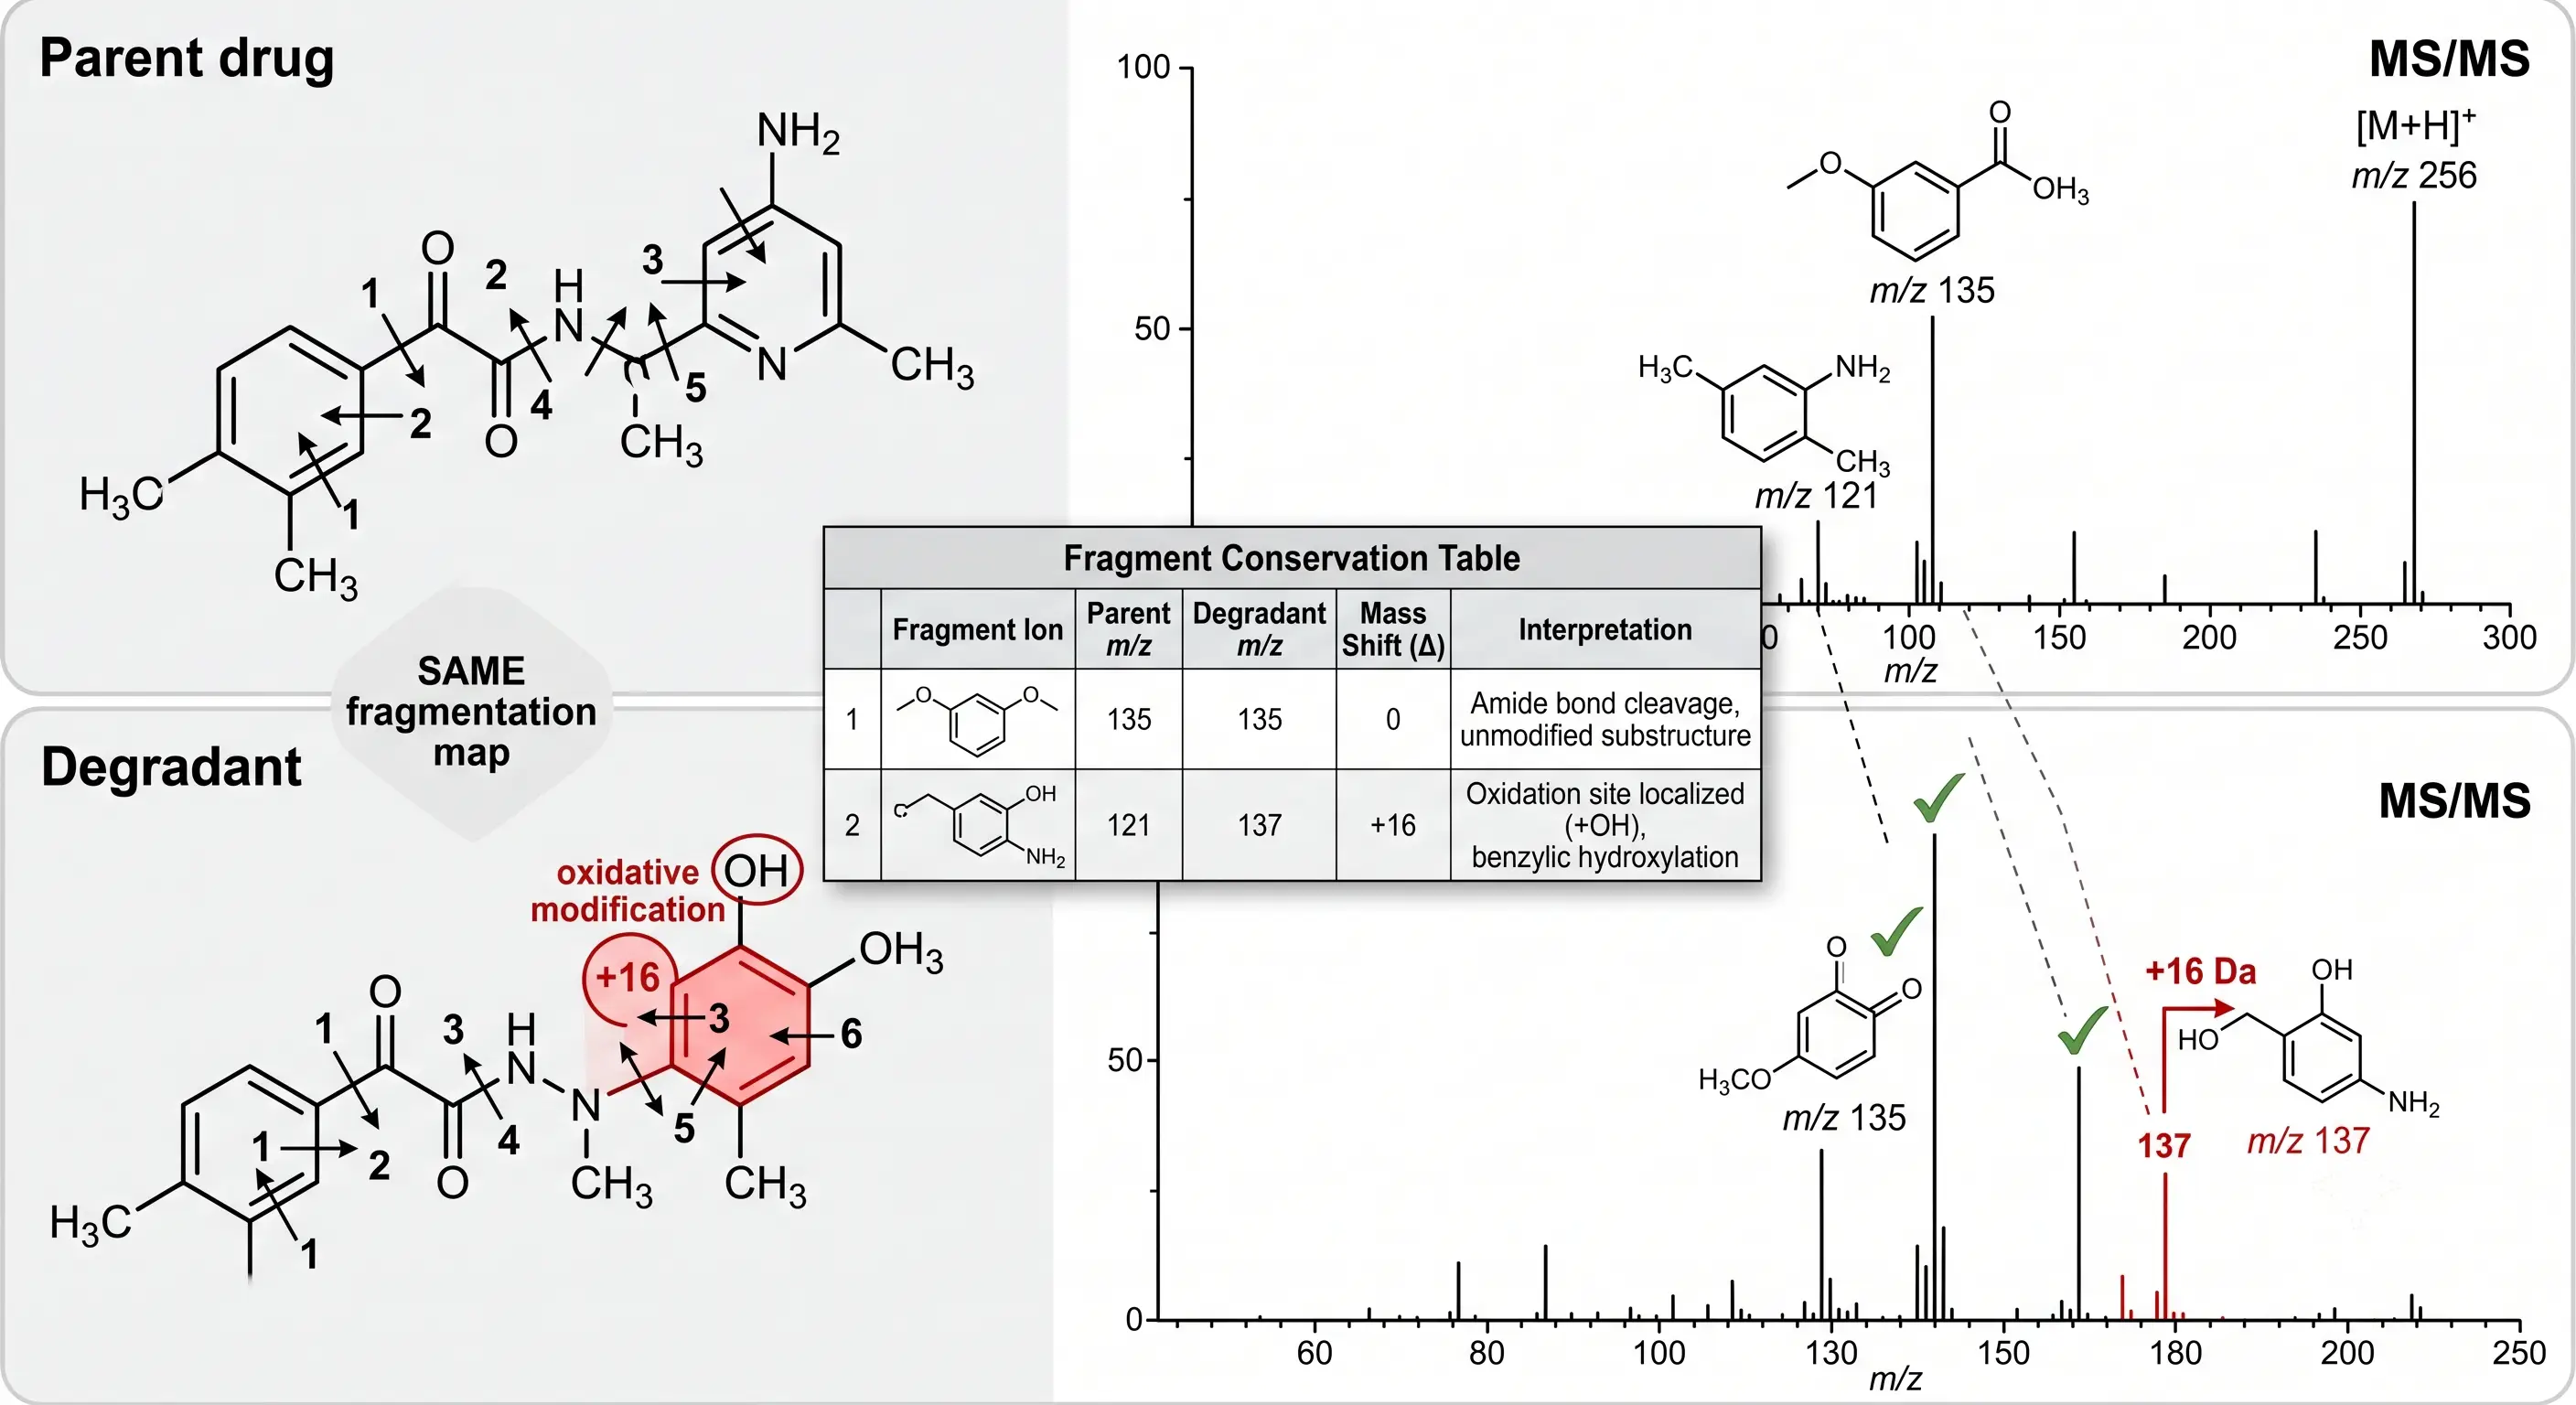 Figure 3: Comparative Fragmentation Mapping — Degradant vs. Parent Drug MS/MS
Data Processing and Interpretation: From Raw Spectra to a Proposed Structure
The raw output of an LC-HRMS/MS degradant analysis — hundreds of full-scan mass spectra and data-dependent MS/MS spectra across a 20–40 minute chromatographic run — must be systematically processed before structural interpretation can begin. This data reduction step, performed with vendor or third-party software (Compound Discoverer for Thermo, MassHunter for Agilent, UNIFI for Waters, MZmine for open-source workflows), extracts the relevant information: chromatographic peak detection, background subtraction, accurate mass determination, isotopic pattern matching, molecular formula generation, and MS/MS spectral library searching.
Molecular Formula Determination: The Nitrogen Rule and Isotopic Patterns. For small-molecule pharmaceuticals (typically C, H, N, O, S, Cl, Br), the accurate mass narrowed to ≤ 5 ppm usually yields one or two plausible molecular formulas. Two additional constraints refine the assignment. First, the nitrogen rule: an odd-mass molecular ion contains an odd number of nitrogen atoms (and vice versa). Second, the isotopic pattern: the relative abundances of the [M+1] (¹³C), [M+2] (³⁴S, ³⁷Cl), and [M+3] peaks must match the theoretical isotopic distribution of the proposed formula. A formula containing one chlorine atom must show a [M+2] peak at ~32% of the monoisotopic peak (the characteristic ³⁷Cl:³⁵Cl ratio). A formula containing one sulfur atom must show a [M+2] peak at ~4.4%. Discrepancies between observed and theoretical isotopic patterns — particularly when they exceed 5% — invalidate the proposed formula and require either a revised elemental composition or investigation of unresolved isobaric interference.
Mass Defect Filtering: Finding Drug-Related Species in Complex Spectra. Mass defect — the difference between a compound's exact mass and its nominal mass — is a powerful filtering tool for degradant detection. Most drug-related degradants share a core substructure with the parent drug and therefore occupy a characteristic mass defect range. By applying a mass defect filter centered on the parent drug's mass defect with a defined tolerance window (±50 mDa), software can selectively extract chromatographic peaks corresponding to drug-related species while suppressing matrix-related ions, plasticizers, column bleed, and other non-drug-related signals. This technique is particularly valuable for oxidative degradant mixtures, where multiple oxidation states (+O, +2O, +3O) produce a ladder of mass shifts that a mass defect filter captures cleanly.
Spectral Library Searching: Known Degradants, Known Fragmentation. When the degradant is a known compound — a hydrolytic product, a common oxidative metabolite, a compendial impurity — spectral library matching against databases such as mzCloud, MassBank, or METLIN can provide structural identification in seconds rather than hours. The match score combines accurate mass (precursor), isotopic pattern, and MS/MS spectral similarity, and a high-confidence match (> 90%) typically removes the need for further structural work — though the match should always be verified against the degradation chemistry (does this structure make chemical sense given the stress conditions that generated it?).
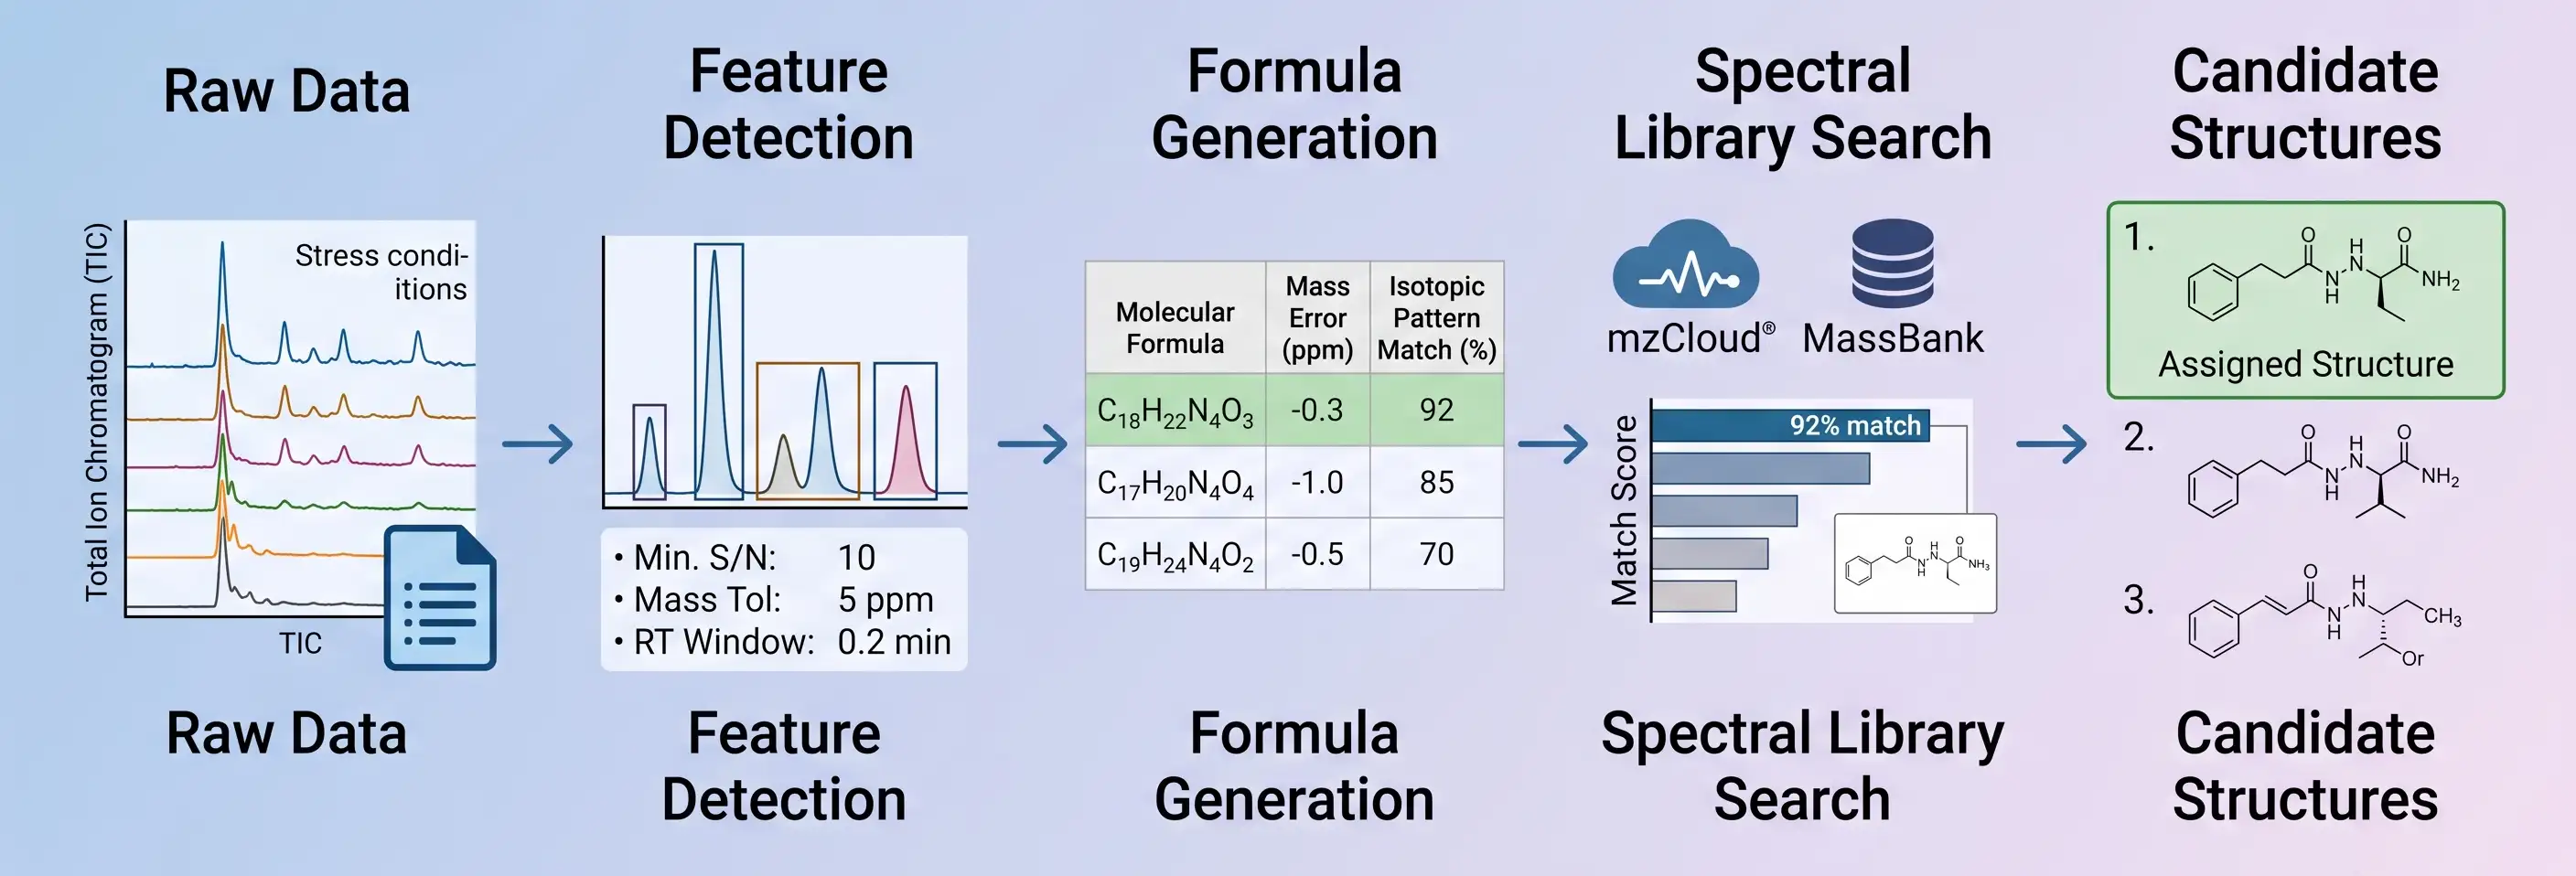 Figure 4: HRMS Data Processing Pipeline — From Raw Chromatogram to Candidate Structures
NMR Confirmation: When Mass Spectrometry Alone Cannot Close the Case
High-resolution mass spectrometry can determine a degradant's elemental composition, molecular weight, and — through MS/MS — the connectivity of its atoms. But there are structural questions that even the best HRMS data cannot answer definitively: the position of a hydroxyl group on an aromatic ring (regioisomerism), the configuration of a double bond (cis/trans or E/Z isomerism), or whether a degradation product is a single stereoisomer or a mixture of diastereomers. For degradants that exceed ICH identification thresholds and whose structures present these ambiguities, NMR spectroscopy provides the definitive structural proof.
Isolation by Preparative HPLC. Before NMR analysis, the degradant must be isolated from the stress matrix in sufficient quantity (typically 0.5–5 mg) and purity (≥ 95%). Preparative HPLC — using a scaled-up version of the analytical separation with a larger-diameter column — is the standard isolation technique. The isolation step is often the rate-limiting step in the entire degradant identification workflow: it requires method transfer from analytical to preparative scale, collection of the target peak across multiple injections (potentially dozens), concentration of the collected fractions (rotary evaporation followed by lyophilization), and purity verification by re-injection on the analytical method. For degradants present at ≤ 0.1% of the parent drug, isolating sufficient material for NMR can require processing hundreds of milligrams of stressed sample — a non-trivial preparative undertaking.
The NMR Toolbox for Degradant Structure Confirmation. The minimum dataset for degradant structural confirmation includes: ¹H NMR (proton chemical shifts, integration, and coupling patterns — confirming the number and environment of hydrogen atoms); ¹³C NMR (carbon count and hybridization — confirming the carbon skeleton); and 2D experiments: COSY (¹H-¹H correlation — tracing proton-proton coupling networks through vicinal and geminal J-coupling), HSQC (¹H-¹³C one-bond correlation — assigning each proton to its directly attached carbon), and HMBC (¹H-¹³C multiple-bond correlation — connecting protons to carbons 2–4 bonds away, the critical experiment for assembling the carbon skeleton across quaternary carbons and heteroatoms). For degradants with defined stereochemistry, NOESY or ROESY adds through-space distance constraints. The 2025 ibrutinib degradant study by Yerla et al. exemplifies the full NMR characterization workflow for novel degradation impurities — COSY, HSQC, and HMBC spectra provided the unambiguous connectivity evidence that distinguished three isomeric oxidative degradants.
When Is NMR Required? NMR is not required for every degradant. If HRMS provides a unique molecular formula and MS/MS fragmentation definitively localizes the modification site — for example, a demethylation at a methoxy group that is the only O-methyl in the molecule — NMR confirmation adds no actionable information. NMR is indicated when: (a) the modification site is ambiguous from MS/MS data alone (multiple possible sites); (b) the degradant involves a skeletal rearrangement, ring opening, or ring closure that MS/MS cannot unambiguously trace; (c) the degradant exceeds the ICH qualification threshold and its structure will appear in the regulatory submission's impurity profile; or (d) the degradant's proposed structure carries a structural alert for genotoxicity and the regulatory risk of an incorrect assignment is high. The decision is risk-based: the cost and time of preparative isolation and NMR analysis are weighed against the regulatory and patient-safety consequences of an incorrect structural assignment.
Regulatory Submission: Packaging Degradant Identification Data for the Reviewer
The degradant identification data that fills a laboratory notebook must be condensed into the structured format of a regulatory submission — CTD Module 3.2.S.7.1 (drug substance stability) and 3.2.P.5.4 (drug product stability). The reviewer expects a specific data package, and missing elements are among the most common deficiencies in ANDA and NDA submissions.
What the Reviewer Expects. For each identified degradant above the ICH reporting threshold, the submission should include: (a) chemical name and structure; (b) molecular formula and molecular weight; (c) the stress condition or storage condition under which it was observed; (d) its retention time (RRT relative to API) in the stability-indicating method; (e) the proposed formation mechanism (a brief degradation pathway narrative); (f) the analytical evidence supporting the assigned structure — accurate mass (≤ 5 ppm error), key MS/MS fragment assignments (annotated spectrum), and NMR data if applicable; and (g) a toxicological assessment — is the degradant also a known metabolite? Does it contain structural alerts for genotoxicity per ICH M7? If the degradant exceeds the qualification threshold, has it been qualified through toxicology studies or literature precedent?
Mass Spectrometry Data in Filings. The 2022 CASSS industry roundtable on best practices for reporting MS data in regulatory filings (facilitated by Merck and BMS) established several consensus principles. MS/MS spectra are generally not included in the body of the submission — they are kept in the development report and made available upon agency request. UV chromatograms are preferred over total ion current (TIC) chromatograms for purity and stability comparisons, because TIC is sensitive to non-product-related perturbations (background ions, solvent clusters) that can misleadingly suggest impurity differences. Annotated mass spectra — with fragment ion structures drawn on the spectrum — are the preferred format when MS data must be presented. The mass accuracy of each reported ion should be documented (observed m/z, theoretical m/z, and ppm error).
Common Submission Deficiencies. The most frequent regulatory findings related to degradant identification include: incomplete structural characterization of degradants above the identification threshold (for example, reporting only the molecular formula without MS/MS or NMR structural evidence); failure to correlate forced degradation degradants with those observed in long-term and accelerated stability studies (the reviewer expects to see which stress-generated degradants actually appear on storage); insufficient justification for why certain degradants were not identified (the response "below identification threshold" must be supported by quantitative data); and absence of a genotoxicity assessment for degradants containing structural alerts. Proactively addressing each of these points — before the reviewer asks — is the hallmark of a well-prepared stability submission.
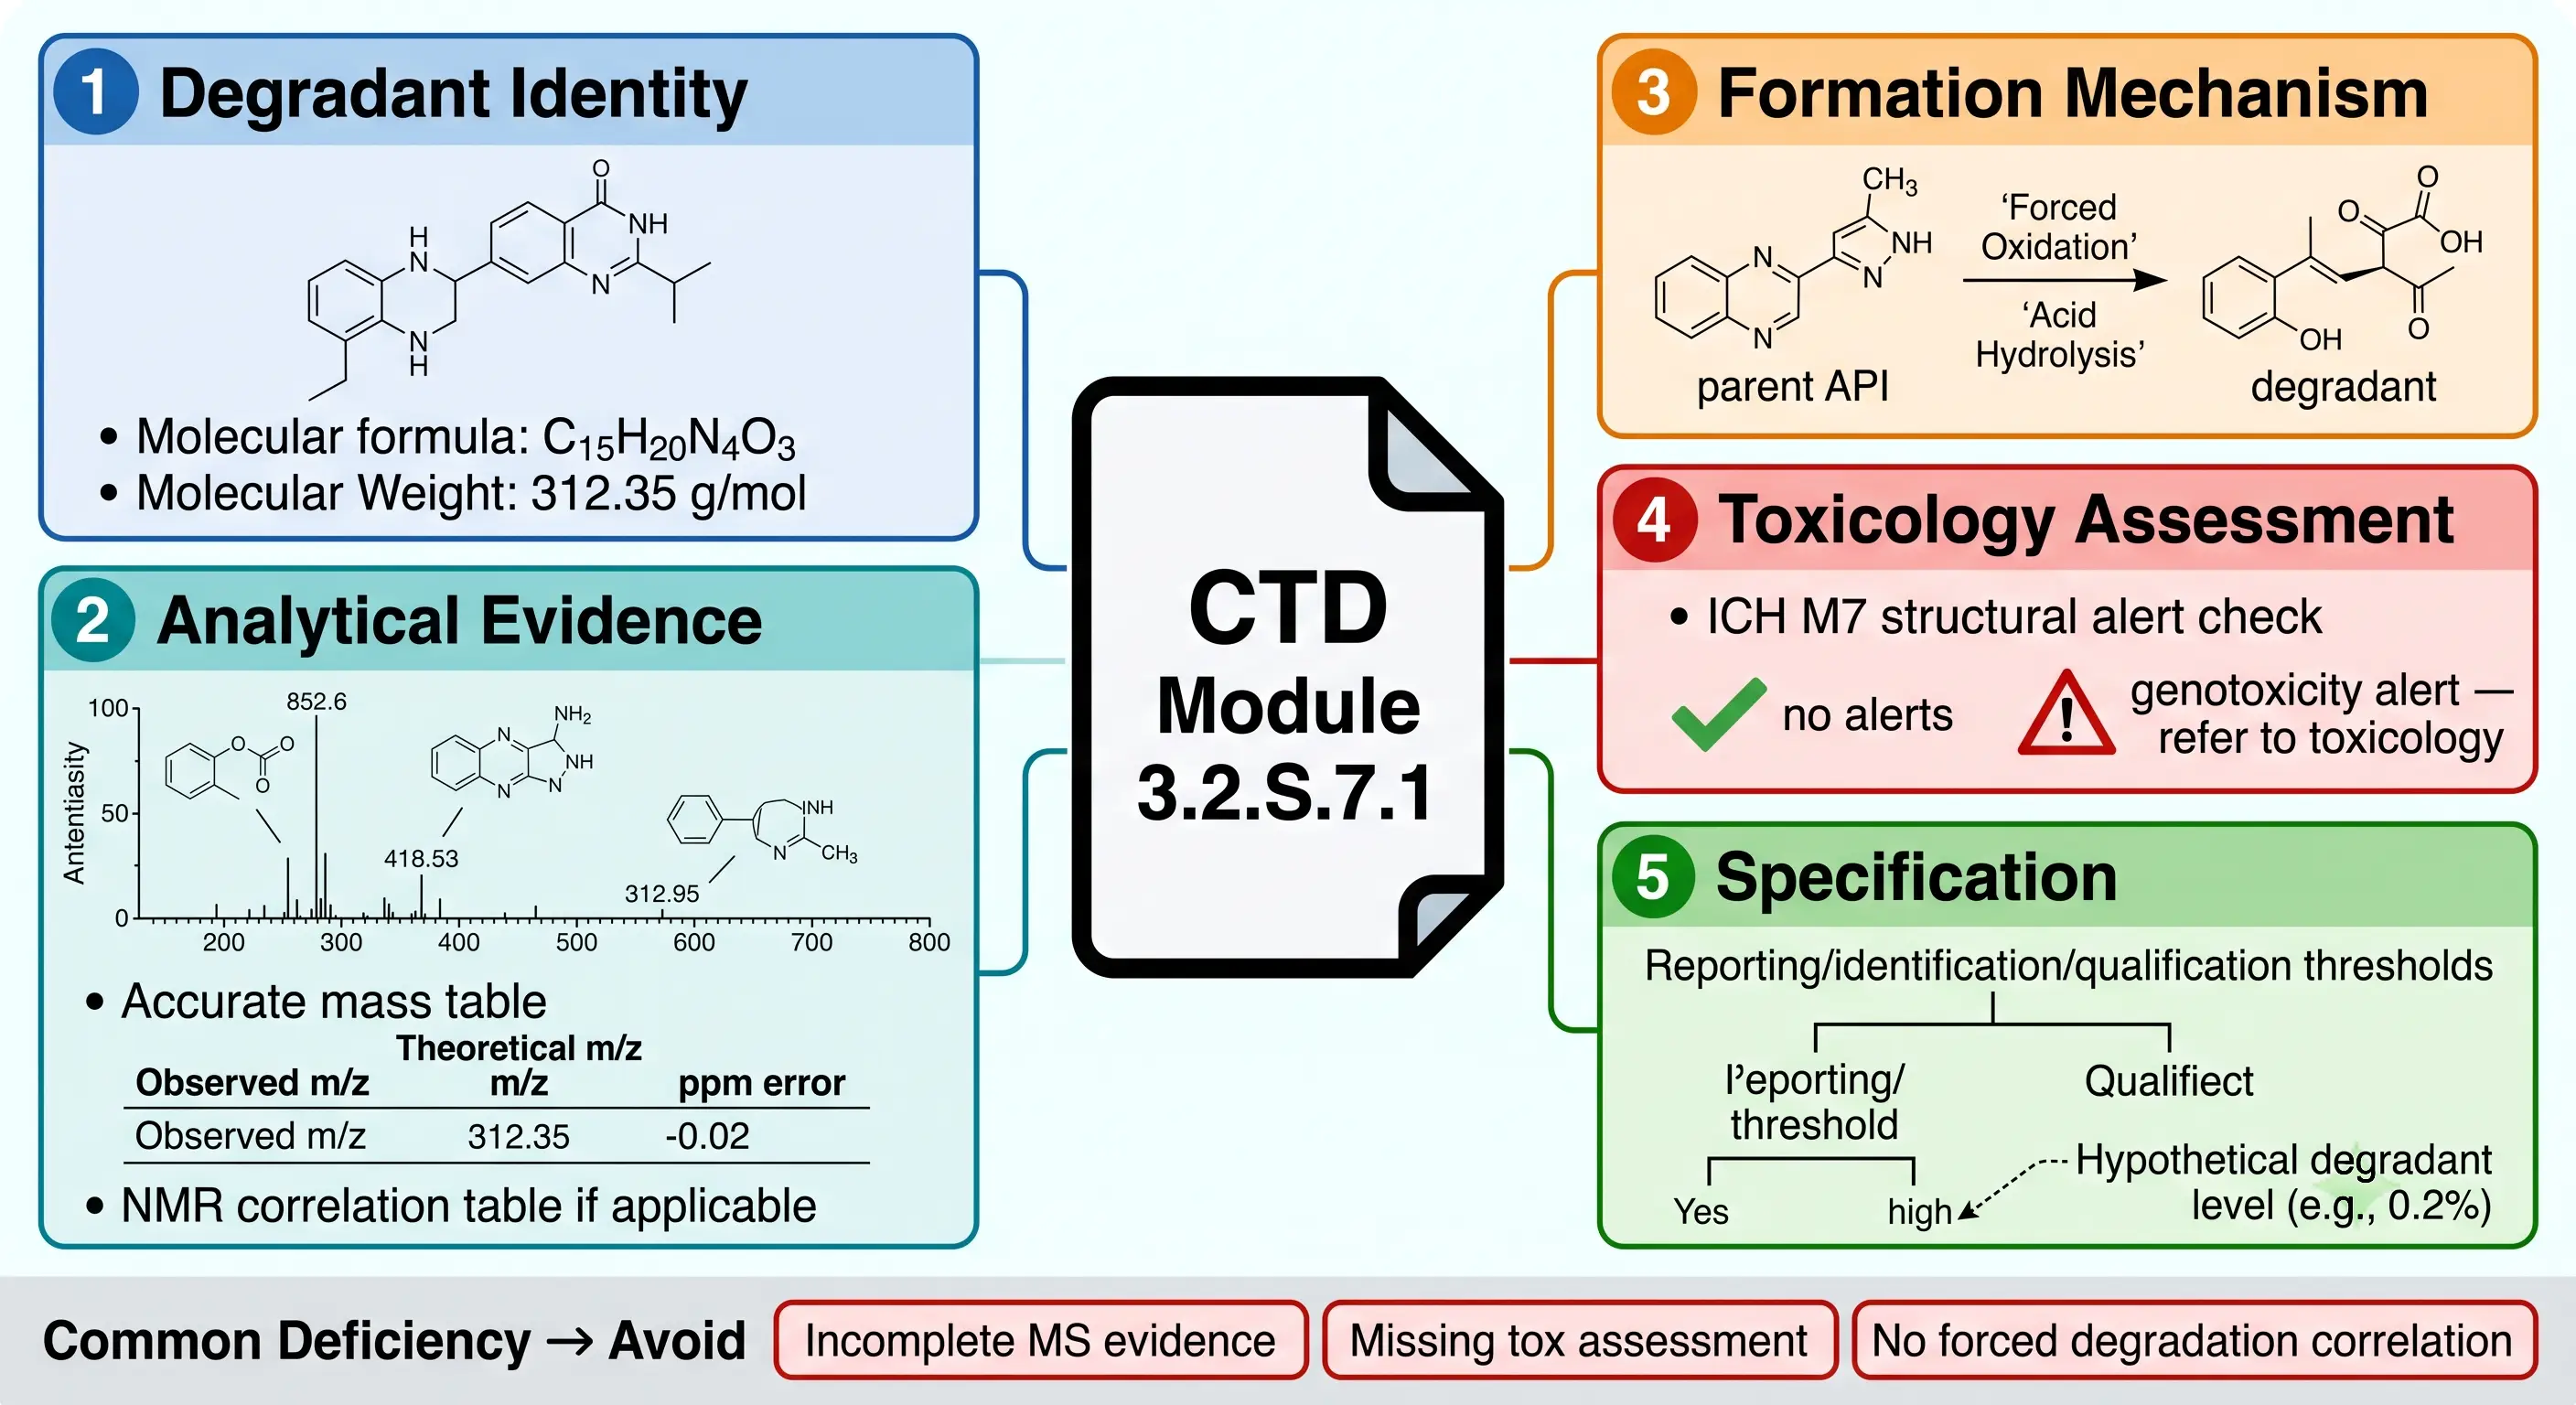 Figure 5: Regulatory Submission Data Package for Degradant Identification
Frequently Asked Questions
Q: At what level must a degradant be structurally identified?
A: Per ICH Q3A(R2) and Q3B(R2), any impurity at or above 0.1% of the drug substance (or 1.0 mg total daily intake) must be identified — meaning its chemical structure determined. Below 0.1% but above the reporting threshold (0.05% for drug substance, 0.1% for drug product), the degradant must be reported but structural identification is not mandatory. Above the qualification threshold (0.15% or 1.0 mg/day), the identified degradant must also undergo safety qualification.
Q: Is accurate mass alone sufficient to identify a degradant?
A: No. Accurate mass provides the molecular formula — the elemental composition — but not the connectivity of atoms. Two isomeric degradants can have identical accurate mass and molecular formula but different structures, different toxicology profiles, and different regulatory implications. MS/MS fragmentation is required to determine connectivity, and NMR is the definitive confirmation when ambiguity remains.
Q: When should NMR be used for degradant confirmation instead of relying on MS alone?
A: NMR is indicated when: (a) the position of modification is ambiguous from MS/MS (multiple possible sites); (b) the degradant involves a skeletal rearrangement; (c) the degradant exceeds ICH qualification thresholds and will appear in the regulatory impurity profile; or (d) the proposed structure contains a structural alert for genotoxicity. For routine, low-level degradants with unambiguous MS/MS fragmentation, HRMS/MS alone is generally sufficient for regulatory purposes.
Q: What mass accuracy is required for degradant identification?
A: ≤ 5 ppm mass error is the industry-accepted standard for molecular formula determination by HRMS. At 5 ppm error, a compound with mass 400 Da has a mass uncertainty of ±0.002 Da, which typically limits possible molecular formulas to one or two candidates. Better mass accuracy (< 3 ppm) is achievable with careful calibration and is recommended for degradants exceeding ICH identification thresholds.
Q: How are degradants distinguished from process impurities and excipient-related peaks?
A: By comparison of stressed and unstressed samples, and by placebo/excipient controls. A peak that appears in stressed samples but is absent (or present at lower levels) in the unstressed control is a degradant. A peak present at similar levels in both stressed and unstressed samples is a process impurity. A peak present in the placebo chromatogram (excipients without API, stressed under identical conditions) is an excipient-related peak, not a drug-related degradant.
Q: What software tools are most commonly used for degradant structural elucidation?
A: The major platforms are Compound Discoverer (Thermo Scientific, for Orbitrap data), MassHunter (Agilent, for Q-TOF data), and UNIFI (Waters, for Waters Q-TOF data). For fragmentation prediction: Mass Frontier (Thermo) and ACD/MS Fragmenter (ACD/Labs). For open-source workflows: MZmine for feature detection and molecular networking. Spectral libraries: mzCloud, MassBank, METLIN. The Narayanam et al. 2014 review provides the most comprehensive practical guidance on LC-MS method parameters for impurity and degradant characterization across all major instrument platforms.
References
- ICH Harmonised Guideline Q3A(R2): Impurities in New Drug Substances. ICH, 2006. https://database.ich.org/sites/default/files/Q3A(R2)%20Guideline.pdf
- ICH Harmonised Guideline Q3B(R2): Impurities in New Drug Products. ICH, 2006. https://database.ich.org/sites/default/files/Q3B(R2)%20Guideline.pdf
- Narayanam M, Handa T, Sharma P, et al. Critical practical aspects in the application of liquid chromatography-mass spectrometric studies for the characterization of impurities and degradation products. J Pharm Biomed Anal. 2014;87:191-217. doi:10.1016/j.jpba.2013.04.027
- Singh S, Handa T, Narayanam M, et al. A critical review on the use of modern sophisticated hyphenated tools in the characterization of impurities and degradation products. J Pharm Biomed Anal. 2012;69:148-173. doi:10.1016/j.jpba.2012.03.044
- Khandale N, Rajge RR, Singh SK, Singh G. Advances of hyphenated technique in impurity profiling of active pharmaceutical ingredients and pharmaceutical products. Sep Sci Plus. 2023;6(9):2300018. doi:10.1002/sscp.202300018
- Yerla RR, Manubolusurya S, Meganathan S, Madalapu V, Vaidyanathan G. Structural elucidation of novel degradation impurities of ibrutinib in ibrutinib tablets using preparative chromatography, LCMS, HRMS and 2D NMR techniques. J Chromatogr Sci. 2025;63(1):bmae002. doi:10.1093/chromsci/bmae002
- Zelesky T, Baertschi SW, Foti C, et al. Pharmaceutical forced degradation (stress testing) endpoints: a scientific rationale and industry perspective. J Pharm Sci. 2023;112(12):2948-2964. doi:10.1016/j.xphs.2023.09.003
- Baertschi SW, Alsante KM, Reed RA, eds. Pharmaceutical Stress Testing: Predicting Drug Degradation. 2nd ed. CRC Press; 2011. https://www.routledge.com/9781439801796
- CASSS Mass Spec 2022 Roundtable. Best Practices for Reporting MS Data in Regulatory Filings. Facilitator: Schuessler H (Merck), Scribe: Liu R (BMS). 2022. https://www.casss.org/docs/default-source/mass-spec/2022-roundtable-notes/best-practices-for-reporting-ms-data-in-regulatory-filings.pdf
- ICH Harmonised Guideline Q1B: Photostability Testing of New Drug Substances and Products. ICH, 1996. https://database.ich.org/sites/default/files/Q1B%20Guideline.pdf
Related Services


