What Is a Stability-Indicating Method? Definition and the FDA's Mandate
A stability-indicating method (SIM) is an analytical procedure capable of reliably measuring the active pharmaceutical ingredient (API) in the presence of its degradation products, process impurities, excipients, and matrix interferences — without any of those species distorting the API quantitation. In practice, this means one thing: when the HPLC chromatogram shows a peak for the parent drug, that peak must represent the parent drug and nothing else. Every degradant generated during storage — whether 0.1% or 10% of the label claim — must elute at a different retention time or be provably absent from the parent peak by orthogonal evidence.
The regulatory mandate is unambiguous. ICH Q1A(R2) requires that stability testing be performed using "validated stability-indicating analytical procedures." FDA 21 CFR 211.165(e) demands that laboratory test methods establish accuracy, sensitivity, specificity, and reproducibility — with specificity, in the stability context, defined as the ability to measure the analyte in the presence of all likely degradation products. A non-stability-indicating method produces data that is not merely suboptimal — it is uninterpretable. If the assay cannot distinguish between 95% intact API and 95% intact API plus 10% co-eluting degradant, the stability program has no foundation.
Three criteria define whether a method is truly stability-indicating. First, the method must separate the API from all degradation products generated under relevant stress conditions — not merely a subset of known degradants. Second, each degradant peak must be resolved from the API with baseline or near-baseline resolution (Rs ≥ 1.5 is the target; Rs ≥ 1.0 is the regulatory minimum). Third, the purity of the API peak must be demonstrated by orthogonal detection — typically photodiode array (PDA) UV spectral homogeneity, supplemented by mass spectrometry (MS) when chromophores are similar.
At Creative Proteomics DMPK, stability-indicating method development is treated as an integrated analytical discipline rather than a checkbox exercise. Each method is built around the specific degradation chemistry of the molecule — its functional groups, known degradation pathways, and the chromatographic behavior of its degradants — rather than a generic gradient screen.
A stability-indicating method is the analytical bridge between forced degradation studies — which generate the degradant cocktail that challenges the method — and long-term stability testing, where the validated method proves its worth across months or years of real-time data. Without a rigorously developed SIM, the degradation products identified during stress testing cannot be reliably tracked through the stability program.
Regulatory Framework: ICH Q1A, Q2(R2), Q1B, and FDA Expectations
The regulatory architecture governing stability-indicating methods is built on four interconnected ICH pillars and reinforced by FDA and USP requirements. Understanding how these guidelines interact — rather than reading each in isolation — is essential for designing a SIM that survives regulatory review.
ICH Q1A(R2) — The Mandate. Q1A(R2) is the originating requirement: stability studies must use stability-indicating methods. It also establishes the stress testing obligation — forced degradation under hydrolytic, oxidative, photolytic, and thermal conditions — that generates the degradant population against which the method must prove its specificity. The guideline's logic is linear: stress the molecule → resolve the degradants → validate the method that can track both parent loss and degradant growth across the entire shelf life.
ICH Q2(R2) — The Validation Framework. Published in December 2023 and adopted by FDA in March 2024 (89 FR 16582), Q2(R2) replaces Q2(R1) and brings two important innovations. First, it formally incorporates validation principles for multivariate analytical procedures and spectroscopic data — reflecting the growing role of chemometric and PAT (Process Analytical Technology) methods in pharmaceutical QC. Second, it introduces the concept of the analytical procedure lifecycle, linking method development (ICH Q14) through validation (Q2(R2)) to lifecycle change management (ICH Q12). For stability-indicating methods specifically, Q2(R2) reinforces that specificity must be demonstrated against stressed samples containing realistic degradation products, not merely against placebo or un-degraded API.
ICH Q1B — Photostability. Q1B defines the light exposure conditions (≥1.2 million lux-hours visible + ≥200 W·h/m² near-UV) that generate photolytic degradants. From a SIM development perspective, Q1B's relevance is that photodegradants are often structurally distinct from hydrolytic and oxidative degradants — ring-opening products, isomerization products, and radical recombination products that will elute at different positions and require different chromatographic selectivity than the degradants generated by acid, base, or peroxide stress.
ICH Q3A/Q3B — Impurity Thresholds. These guidelines establish the reporting (0.05% drug substance / 0.1% drug product), identification (0.1% or 1.0 mg/day), and qualification (0.15% or 1.0 mg/day) thresholds that directly determine the required sensitivity of the stability-indicating method. If the method's LOQ for degradants is above the reporting threshold, it fails by definition — degradants at regulatory concern levels are invisible.
FDA and USP. The FDA's 2015 Guidance on Analytical Procedures and Methods Validation and USP General Chapter <1225> (Validation of Compendial Procedures) provide complementary, operationally oriented guidance. USP <1225> aligns closely with ICH Q2(R2) on validation parameters but adds detail on system suitability testing — a critical element for SIMs, where the resolution between the API and the closest-eluting degradant must be confirmed at the start of every analytical run.
Forced Degradation as the Foundation: Generating the Degradant Cocktail That Challenges the Method
A stability-indicating method is only as good as the stress study that challenged it. If the forced degradation study fails to generate relevant degradation products — or generates degradation products that are chemically irrelevant — the method's claim to be "stability-indicating" rests on a weak foundation.
Target Degradation: The 5–20% Rule. The goal of forced degradation for SIM development is to generate 5–20% loss of the parent drug across each stress condition. Below 5%, the degradant population is too sparse to meaningfully challenge the method's resolving power. Above 20%, secondary and tertiary degradation products begin to dominate — species that are chemically interesting but rarely relevant to normal storage conditions and that complicate rather than clarify the chromatographic picture. The sweet spot is approximately 10% degradation: enough to populate the degradant space with representative species, not so much that the chromatogram becomes uninterpretable.
Five Canonical Stress Pathways. Each stress condition generates a different class of degradants, and the chromatographic method must handle all of them simultaneously:
Acid Hydrolysis (0.1–1N HCl, 25–60°C, 2–24h). Targets esters, acetals, ketals, enol ethers, and N-glycosides. Generates hydrolytic cleavage products that are typically more polar than the parent — earlier-eluting in reversed-phase HPLC.
Base Hydrolysis (0.1–1N NaOH, 25–60°C, 2–24h). Targets esters, lactones, amides, carbamates, and sulfonamides. Base-catalyzed degradants are often structurally similar to acid-catalyzed ones but not identical — the degradation rate and product distribution differ because the leaving group chemistry is pH-dependent.
Oxidative Stress (0.3–3% H₂O₂, ambient to 40°C, 1–24h). Targets sulfides, thioethers, tertiary amines, and electron-rich aromatics. Oxidative degradants are frequently more polar than hydrolytic ones (N-oxides, sulfoxides, epoxides) and may elute in the solvent front if the chromatographic method lacks adequate aqueous-phase retention.
Thermal Stress (60–80°C dry heat, 7–14 days). Probes solid-state degradation kinetics. Thermal degradants in the solid state may differ substantially from solution-state degradants — decarboxylation, dehydration, and polymorph conversion can occur without solvent involvement.
Photolytic Stress (ICH Q1B Option 1 or 2). Probes bond homolysis, Norrish-type cleavage, photooxidation, and cis-trans isomerization. Photolytic degradants can be isomeric with the parent — identical mass, similar UV spectrum — making them the most challenging species for both chromatographic resolution and peak purity assessment. A mandatory dark control distinguishes true photodegradation from concurrent thermal degradation.
From Stress Plate to Method Challenge. The stressed samples — not the unstressed API standard — become the primary method development material. The acid-, base-, peroxide-, thermal-, and light-stressed samples are each injected under the candidate chromatographic conditions, and the resulting chromatograms are overlaid and compared. Any co-elution between the API and a stress-generated peak is a specificity failure that requires method adjustment. The final method must resolve the API from every degradant generated across all five stress conditions in a single representative chromatogram — typically a mixture of all stressed samples spiked with the parent drug at the nominal assay concentration.
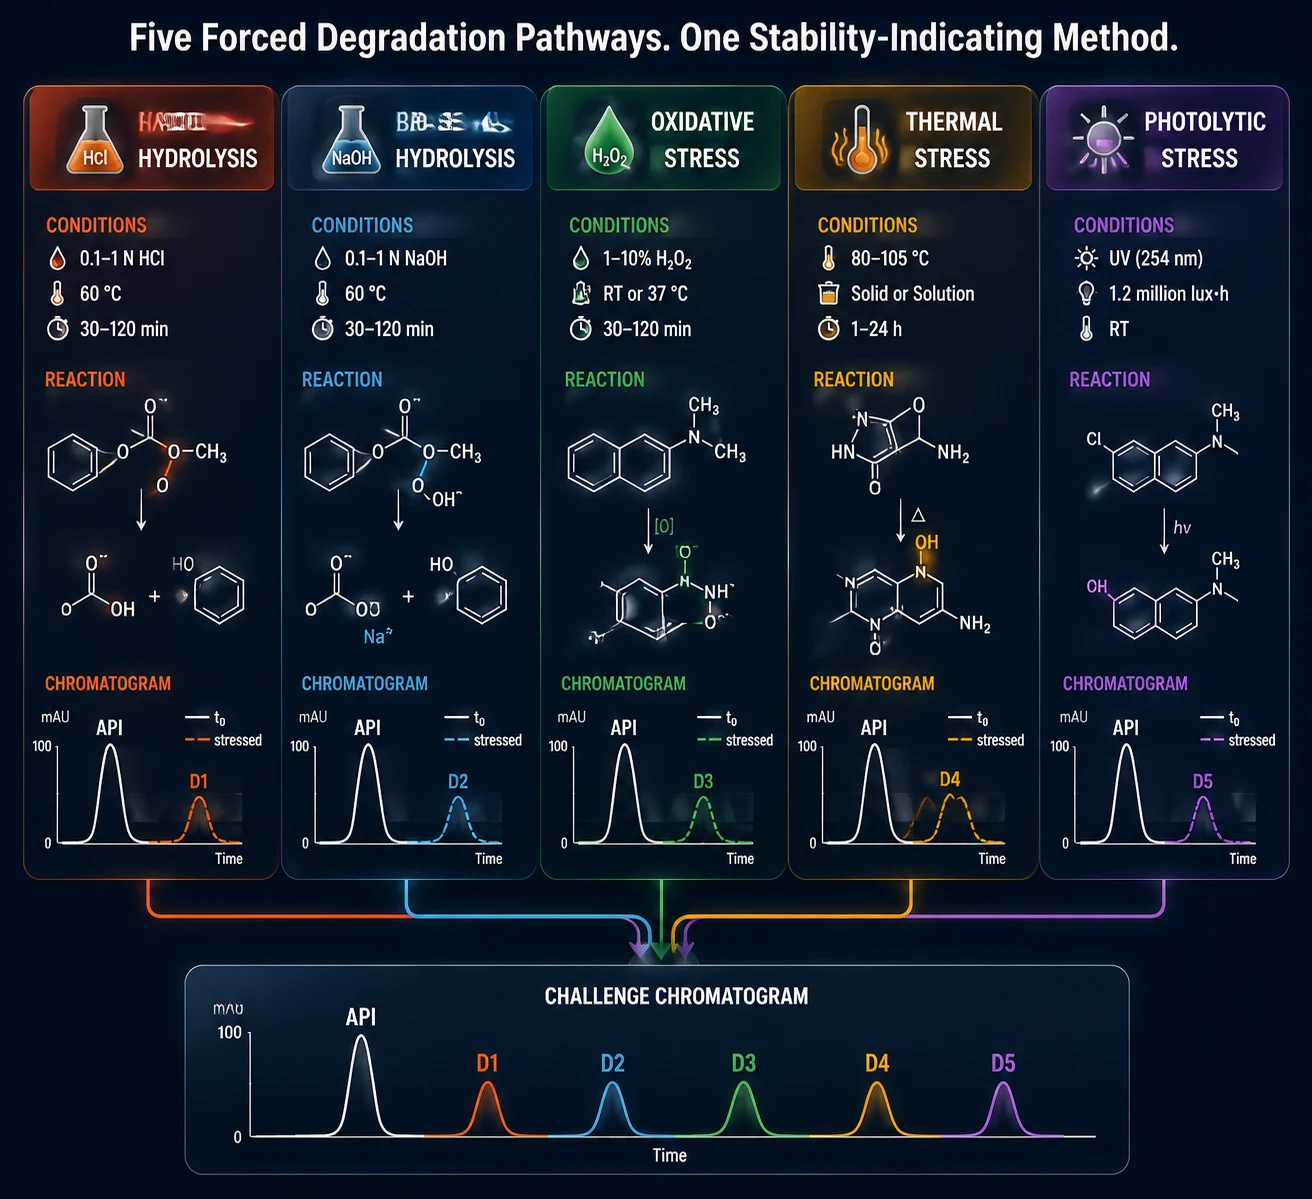 Figure 1: The Five Forced Degradation Stress Pathways for Stability-Indicating Method Challenge
Chromatographic Selectivity: Building Separation That Survives Regulatory Scrutiny
Chromatographic selectivity — the ability of the column and mobile phase to discriminate between the API and every structurally related degradant — is the heart of stability-indicating method development. No amount of validation rigor can rescue a method built on poor selectivity. Conversely, a method with genuinely orthogonal selectivity for the API-degradant pairs of interest will sail through validation with minimal difficulty.
Column Selection: The Most Consequential Decision. Reversed-phase C18 columns dominate stability-indicating methods, but "C18" is not a single stationary phase — it is a family with dramatically different selectivity characteristics. Classical fully porous C18 phases (Type B silica, endcapped, ~15% carbon load) provide balanced hydrophobic retention for most small-molecule APIs and are the default starting point. But when the API and a critical degradant co-elute on a standard C18 — as they frequently do when the degradant differs from the parent by a single hydroxylation, demethylation, or desaturation — the solution space includes: (a) polar-embedded C18 phases (amide or carbamate linker in the alkyl chain), which alter selectivity for hydrogen-bonding solutes; (b) phenyl-hexyl phases, which add π-π interaction capability for aromatic degradants; (c) pentafluorophenyl (PFP) phases, which provide orthogonal selectivity through dipole-dipole and charge-transfer interactions; and (d) C8 or C4 short-chain phases for highly retained, lipophilic compounds. The column screening strategy should test at least two orthogonal stationary phase chemistries before accepting a separation as adequate — a single-column screen that happens to work is not evidence that the method is robustly selective.
Mobile Phase Optimization. For HPLC-UV methods, phosphate buffers (pH 2.5–7.0) with acetonitrile or methanol gradients are the workhorse system. Phosphate provides low-UV transparency (critical for degradant detection at 210–220 nm where many non-chromophoric degradants absorb most strongly), excellent buffering capacity across a wide pH range, and low cost. For LC-MS-compatible methods — increasingly the norm for degradant identification — volatile buffers replace phosphate: 0.1% formic acid (pH ~2.7), ammonium formate (pH 3.0–4.5), or ammonium acetate (pH 4.5–6.8). The trade-off is real: volatile buffers generally provide poorer peak shape for basic compounds than phosphate at intermediate pH, and the low-UV cutoff of formic acid (210 nm) is higher than phosphate (195 nm).
Gradient vs. Isocratic. For stability-indicating methods, gradients are almost always preferred over isocratic elution. A well-designed gradient (5–95% organic over 20–40 minutes) provides three advantages: (a) it elutes degradants spanning a wide polarity range — from early-eluting hydrolytic products to late-eluting photolytic dimers — in a single run; (b) gradient compression at the high-organic end sharpens late-eluting peaks, improving sensitivity for low-level hydrophobic degradants; and (c) the gradient slope can be fine-tuned to expand the region where the API and the closest-eluting degradant separate. Isocratic methods are simpler and more robust for QC environments but offer far less flexibility for resolving complex degradation mixtures.
Critical Pair Resolution. The "critical pair" is the API and the degradant that elutes closest to it — the pair that defines the method's resolving power. The target is Rs ≥ 1.5 between the API and every stress-generated degradant. When this cannot be achieved with a single column-mobile phase combination, the options are: (a) accept Rs ≥ 1.0 and supplement with peak purity evidence (PDA, MS) proving that the 1.0-resolution pair is not co-eluting; (b) switch to an orthogonal column chemistry that separates the critical pair at the expense of other resolution; or (c) develop a dedicated related-substances method separate from the assay method — one optimized for degradant resolution at trace levels, the other for API quantitation at the label-claim level.
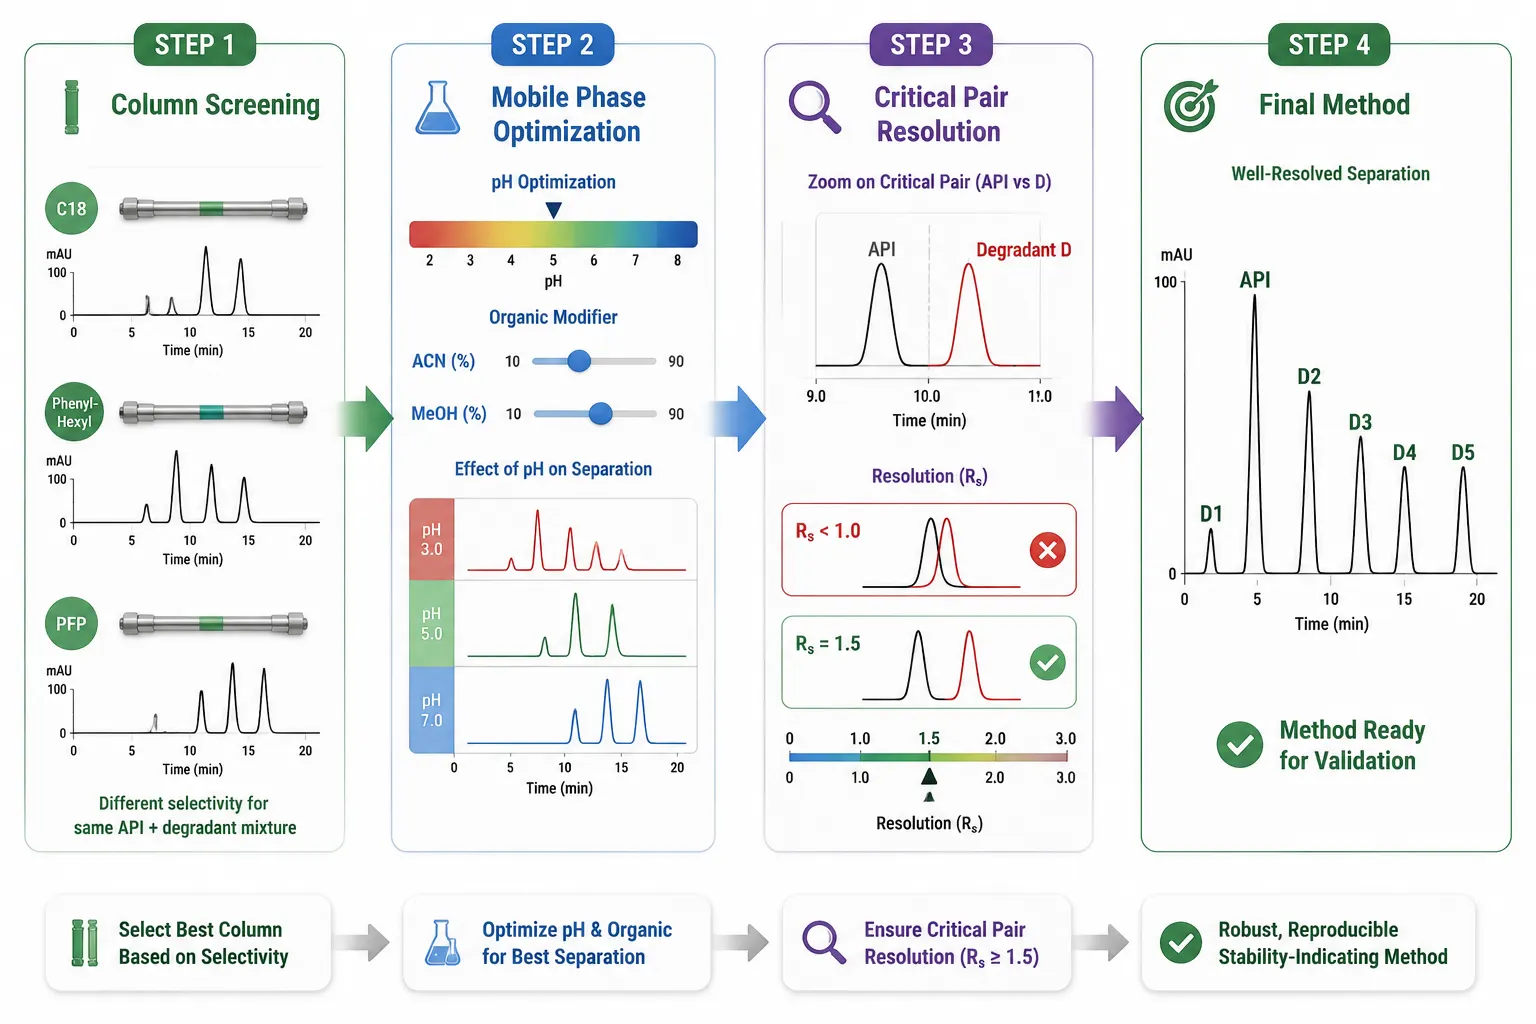 Figure 2: Chromatographic Selectivity Workflow — From Column Screening to Critical Pair Resolution
Peak Purity Assessment: Proving That the API Peak Is Truly One Component
Chromatographic resolution — even at Rs ≥ 1.5 — is necessary but not sufficient to prove that the API peak represents a single chemical species. Peak purity assessment (PPA) provides orthogonal evidence of spectral homogeneity across the chromatographic peak, confirming that no degradation product co-elutes beneath the API. Without PPA, the method's claim to be stability-indicating is incomplete.
PDA-Based Purity Analysis: Strengths and Limits. Photodiode array (PDA) detection is the most widely used PPA technique. The principle is straightforward: UV spectra are acquired continuously across the peak (typically 200–400 nm), and spectral similarity is quantified by comparing spectra at the upslope, apex, and downslope. The key metrics are the purity angle (a measure of actual spectral variation across the peak) and the purity threshold (the maximum variation attributable to baseline noise). When purity angle < purity threshold, the peak is considered spectrally pure.
The limitation — and it is a serious one — is that PDA purity analysis can only detect co-eluting species with different UV spectra from the parent. When a degradant shares the same chromophore as the API — as is common for degradants formed by aliphatic side-chain modification (hydroxylation, demethylation, desaturation) that leaves the aromatic chromophore intact — the UV spectra of API and degradant may be nearly identical. In this scenario, PDA purity angle remains below threshold even when co-elution is occurring, generating a false-negative result. A "pass" on PDA purity does not prove the peak is pure; it only proves that no co-eluting species with a detectably different UV spectrum is present.
MS-Based Orthogonal Purity: Closing the Chromophore Gap. Mass spectrometry (MS) provides PPA that is orthogonal to PDA: it detects co-elution based on mass-to-charge ratio (m/z) rather than UV absorbance. When API and degradant differ in mass — as they almost always do — extracted ion chromatograms (EICs) for the API and each suspected degradant m/z reveal whether the API peak contains mass contributions from anything other than the parent drug. MS-based PPA is particularly valuable for detecting: (a) co-eluting oxidative degradants (+16 Da for hydroxylation, +32 Da for sulfoxide formation); (b) co-eluting hydrolytic products that share the parent chromophore; and (c) dimeric or oligomeric degradants that may have unusual UV spectra. The 2024 industry consensus review by Marillier et al. — authored by 17 scientists spanning pharmaceutical companies and regulatory agencies — codified MS-based PPA as the primary orthogonal complement to PDA for stability-indicating method development.
The 2D-LC Option. When both PDA and MS fail to resolve the question — for example, with isomeric degradants (identical mass, identical or near-identical UV spectrum) — two-dimensional liquid chromatography (2D-LC) provides a third orthogonal dimension. 2D-LC couples two columns with different separation mechanisms (e.g., reversed-phase in the first dimension, HILIC or ion-exchange in the second), transferring the suspect peak region from the first column to the second for additional separation. The technique is operationally demanding but decisive: if the peak is pure in both dimensions, the evidence for homogeneity is strong. If it separates into two peaks in the second dimension, the co-elution is proven and the first-dimension method requires re-optimization.
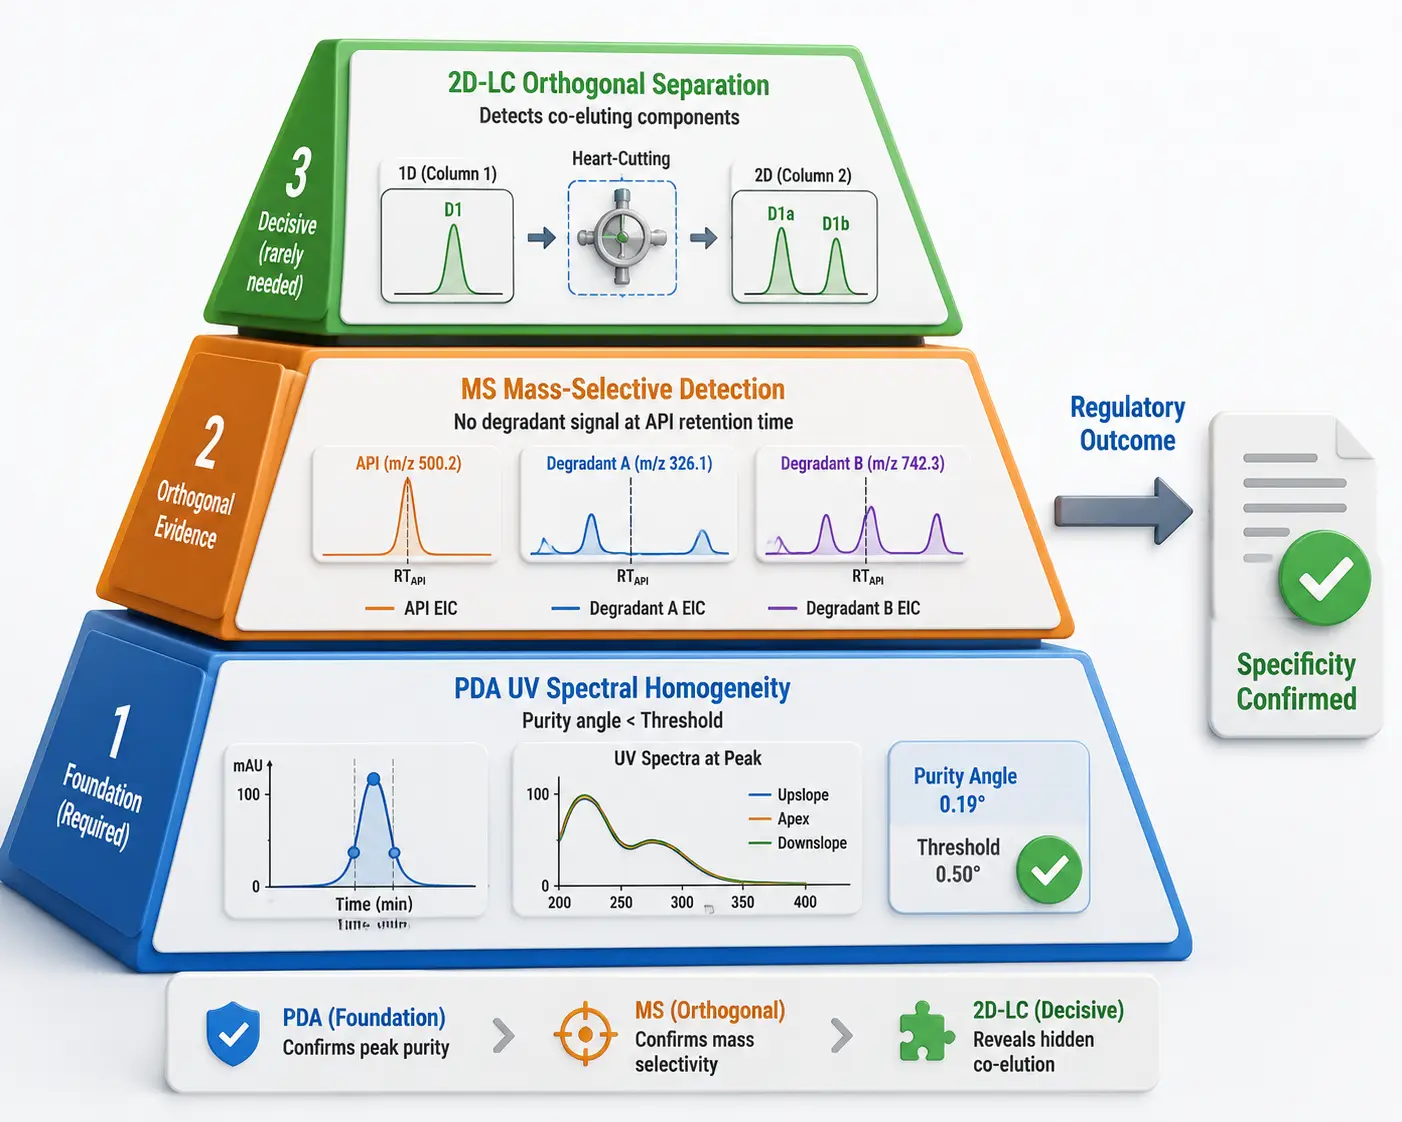 Figure 3: Peak Purity Assessment — PDA, MS, and 2D-LC Orthogonal Evidence Pyramid
Method Validation per ICH Q2(R2): Proving the SIM Works Before It Enters Routine Use
Validation is where the method's stability-indicating capability is formally demonstrated and documented. ICH Q2(R2), the current standard as of its 2024 FDA adoption, defines the validation parameters and — importantly — the logical sequence in which they should be addressed.
Specificity First. Specificity is the gatekeeper validation parameter: if the method fails specificity, the remaining validation data (accuracy, precision, linearity) is meaningless because it was generated on an analytically unresolved system. Specificity for a SIM is demonstrated by injecting: (a) the unstressed API standard; (b) individual stressed samples (acid, base, oxidative, thermal, photolytic); (c) a mixture of all stressed samples spiked with API at the nominal assay concentration; (d) placebo/excipients (for drug product methods); and (e) known process impurities if available. The chromatogram must show baseline resolution (Rs ≥ 1.5) between the API and every stress-generated peak, every process impurity, and every excipient peak. Peak purity — as discussed in Section 5 — provides the orthogonal confirmation that no co-elution is occurring at the API retention time.
Mass Balance as a Validation Cross-Check. Mass balance — the correlation between API loss and degradant appearance — is both a forced degradation quality metric and a validation cross-check. The calculation is: Mass Balance (%) = [(Assay of stressed sample + Sum of degradant peaks) / Assay of unstressed control] × 100. The target window is 95–105%, per the comprehensive 2024 review by Marden et al., representing a consensus across 10 pharmaceutical companies and ANVISA. Mass balance outside this window signals one of three problems: (a) degradants are present but not detected — a specificity failure; (b) degradants are detected but under- or over-quantified due to response factor differences — an accuracy failure; or (c) volatile or non-chromophoric degradants have formed — a detection gap that must be investigated and explained.
Accuracy, Precision, Linearity, Range. For assay methods (API quantitation), accuracy should fall within 98–102% recovery across the range, and precision should yield RSD < 1.0% for repeatability (same analyst, same day, same instrument) and RSD < 2.0% for intermediate precision (different days, analysts, instruments). For related-substances methods (degradant quantitation), accuracy is assessed at the reporting threshold, the identification threshold, and the qualification threshold; precision at LOQ level should be RSD < 10%. Linearity should be demonstrated from the reporting threshold (or LOQ, whichever is higher) to 120% of the specification limit, with R² ≥ 0.998.
Robustness: Anticipating the Real World. Robustness — Q2(R2)'s requirement to demonstrate that the method remains fit for purpose under small deliberate variations — should be built around the known sensitivities of the separation. Standard robustness challenges include: mobile phase pH ± 0.2 units, organic modifier ± 10% relative, column temperature ± 5°C, flow rate ± 0.2 mL/min, and — for gradient methods — dwell volume variation (different HPLC systems). The critical pair resolution (API vs. closest-eluting degradant) is the most sensitive indicator of robustness failure; if Rs drops below 1.5 under any robustness condition, the method's operable range (per ICH Q14's Method Operable Design Region concept) must be narrowed or the method re-optimized.
Beyond Stability-Indicating Validation: The Full Bioanalytical Method Lifecycle. The validation framework described here — specificity, accuracy, precision, linearity, range, robustness — is the same framework that governs bioanalytical method development and validation for regulated LC-MS/MS assays in the PK/TK context. The difference is one of emphasis: stability-indicating method validation places specificity against degradation products at the center, while bioanalytical method validation additionally requires rigorous assessment of matrix effects, recovery, dilution integrity, and incurred sample reanalysis. In practice, a well-developed stability-indicating HPLC method can serve as the starting point for a fully validated bioanalytical LC-MS/MS method — the chromatographic selectivity against degradants translates directly to selectivity against endogenous matrix interferences, and the robustness established during SIM development reduces the risk of method failure during in-study performance monitoring. This continuity — from forced degradation through SIM validation to regulated bioanalysis — is the analytical backbone of the drug development CMC and PK data package.
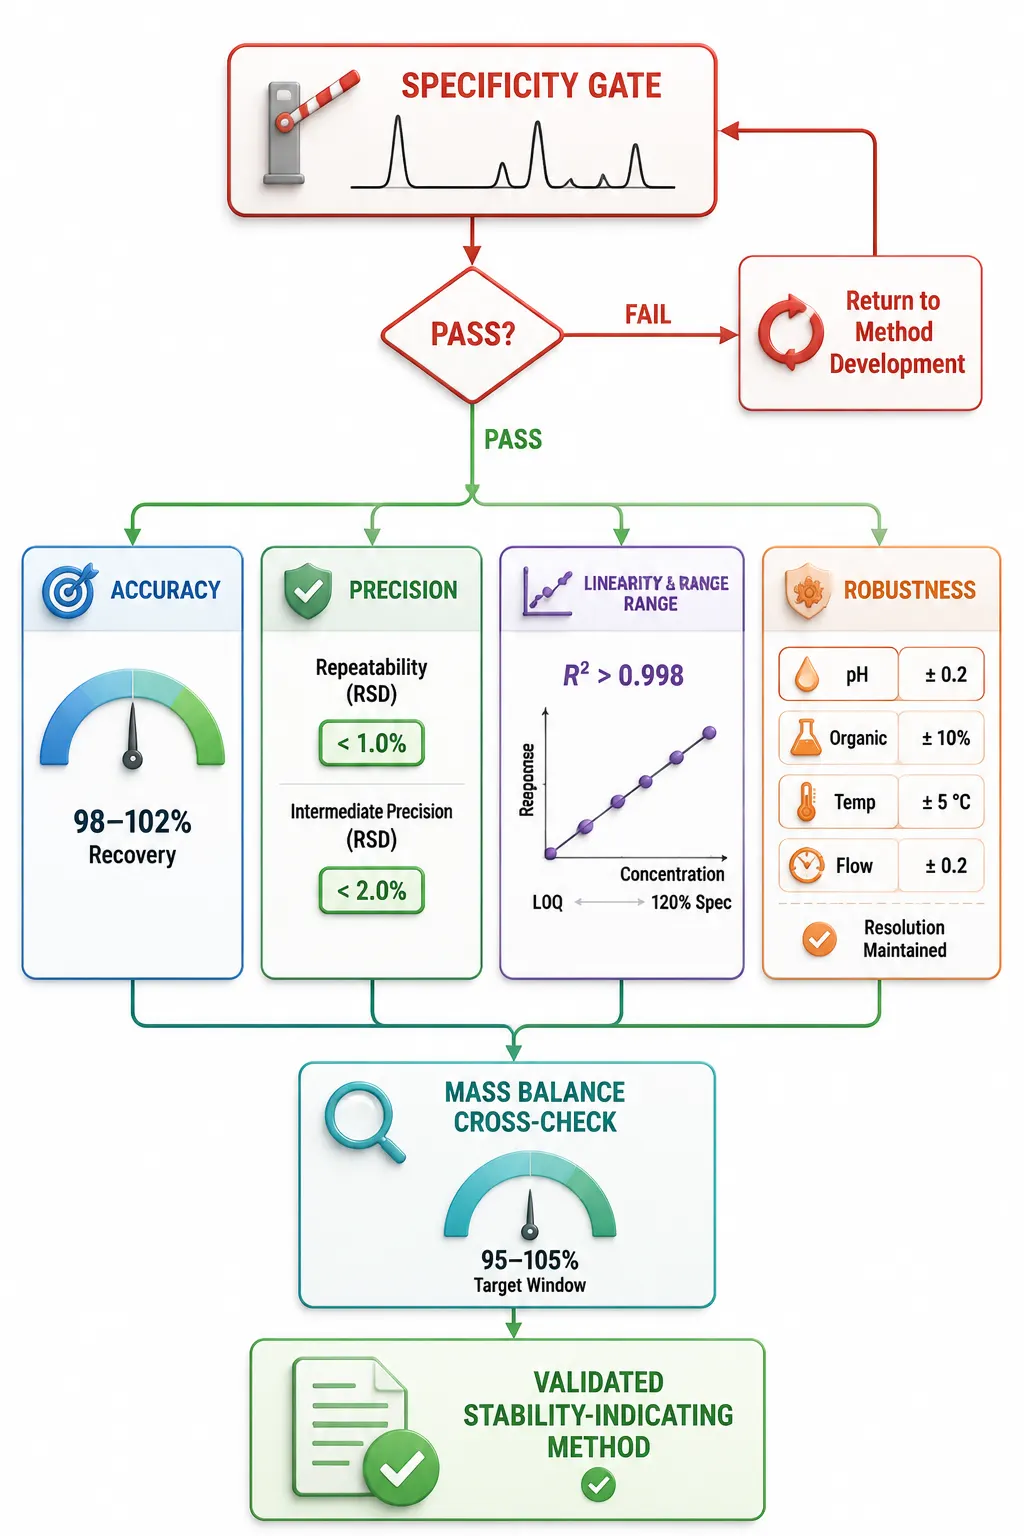 Figure 4: ICH Q2(R2) Validation Workflow for Stability-Indicating Methods
HPLC to UHPLC to LC-MS: The Technology Progression in Stability-Indicating Method Development
The technology landscape for stability-indicating methods has evolved substantially over the past decade, and the choice of platform — HPLC, UHPLC, or LC-MS — now depends on where the method sits in the development lifecycle and what question it is answering.
Conventional HPLC: The Regulatory Workhorse. Standard HPLC (4.6 mm ID columns, 3–5 μm particles, flow rates 1.0–2.0 mL/min) remains the dominant platform for stability-indicating methods in QC and regulatory submission contexts. Its advantages are practical: robust, well-understood, universally available, and compatible with the non-volatile phosphate buffers that provide the best peak shape and UV transparency for routine assay work. Run times of 20–40 minutes are typical. The method can be transferred between laboratories with minimal difficulty because HPLC systems across manufacturers are substantially similar in dwell volume, extra-column dispersion, and detector characteristics.
UHPLC: Speed, Resolution, and Green Chemistry. Ultra-high-performance liquid chromatography (sub-2 μm particles, 2.1 mm ID columns, flow rates 0.2–0.5 mL/min) offers three transformative advantages for SIM development. First, speed: run times are typically reduced by 50–75% compared to HPLC (5–12 minutes rather than 20–40), dramatically increasing the number of method development experiments that can be run per day. Second, resolution: the narrower peaks produced by UHPLC instrumentation (peak widths of 1–3 seconds vs. 10–20 seconds for HPLC) provide substantially higher peak capacity, enabling separation of complex degradation mixtures containing 15–30 peaks that would co-elute under HPLC conditions. Third, green chemistry: UHPLC's low flow rates reduce solvent consumption by approximately 75% per injection, directly lowering both operating costs and environmental impact — a consideration increasingly weighted in pharmaceutical sustainability programs. The 2024–2025 literature shows a clear shift: Analytical Quality by Design (AQbD) combined with UHPLC and ethanol-based green mobile phases (replacing acetonitrile) is emerging as the standard paradigm for modern pharmaceutical analysis.
LC-MS: From Quantitation to Identification. LC-MS integration transforms the stability-indicating method from a purely quantitative tool into a combined quantitation-identification platform. When the HPLC or UHPLC method uses MS-compatible mobile phases (volatile buffers: 0.1% formic acid, ammonium formate, ammonium acetate), the same chromatographic conditions that separate and quantify the API and its degradants can feed directly into a mass spectrometer for degradant structural characterization. This is the analytical bridge to degradant structural elucidation by LC-MS — high-resolution mass spectrometry (Q-TOF or Orbitrap) provides accurate mass and molecular formula for each degradant peak, while MS/MS fragmentation reveals the structural modifications relative to the parent drug. The combination — stability-indicating HPLC/UHPLC separation + LC-MS structural identification — provides everything the regulatory reviewer needs in a single coherent data package: proof of separation, proof of peak purity, proof of degradant identity, and a validated quantitative method for tracking all species across the stability program.
Platform Selection Logic. In early development (Phase I–II), UHPLC with MS-compatible mobile phases is preferred: the speed advantage supports rapid method development iteration, and MS compatibility ensures that any unexpected degradant peaks can be identified without re-developing the method. In late development (Phase III through commercial), methods are typically transferred to HPLC with robust phosphate-based mobile phases for global QC deployment, with the UHPLC method retained as a backup or for specialized impurity profiling. The key is that the separation selectivity — the fundamental chemistry of how the stationary phase discriminates between API and degradants — must be preserved across the transfer, even if retention times and peak widths change.
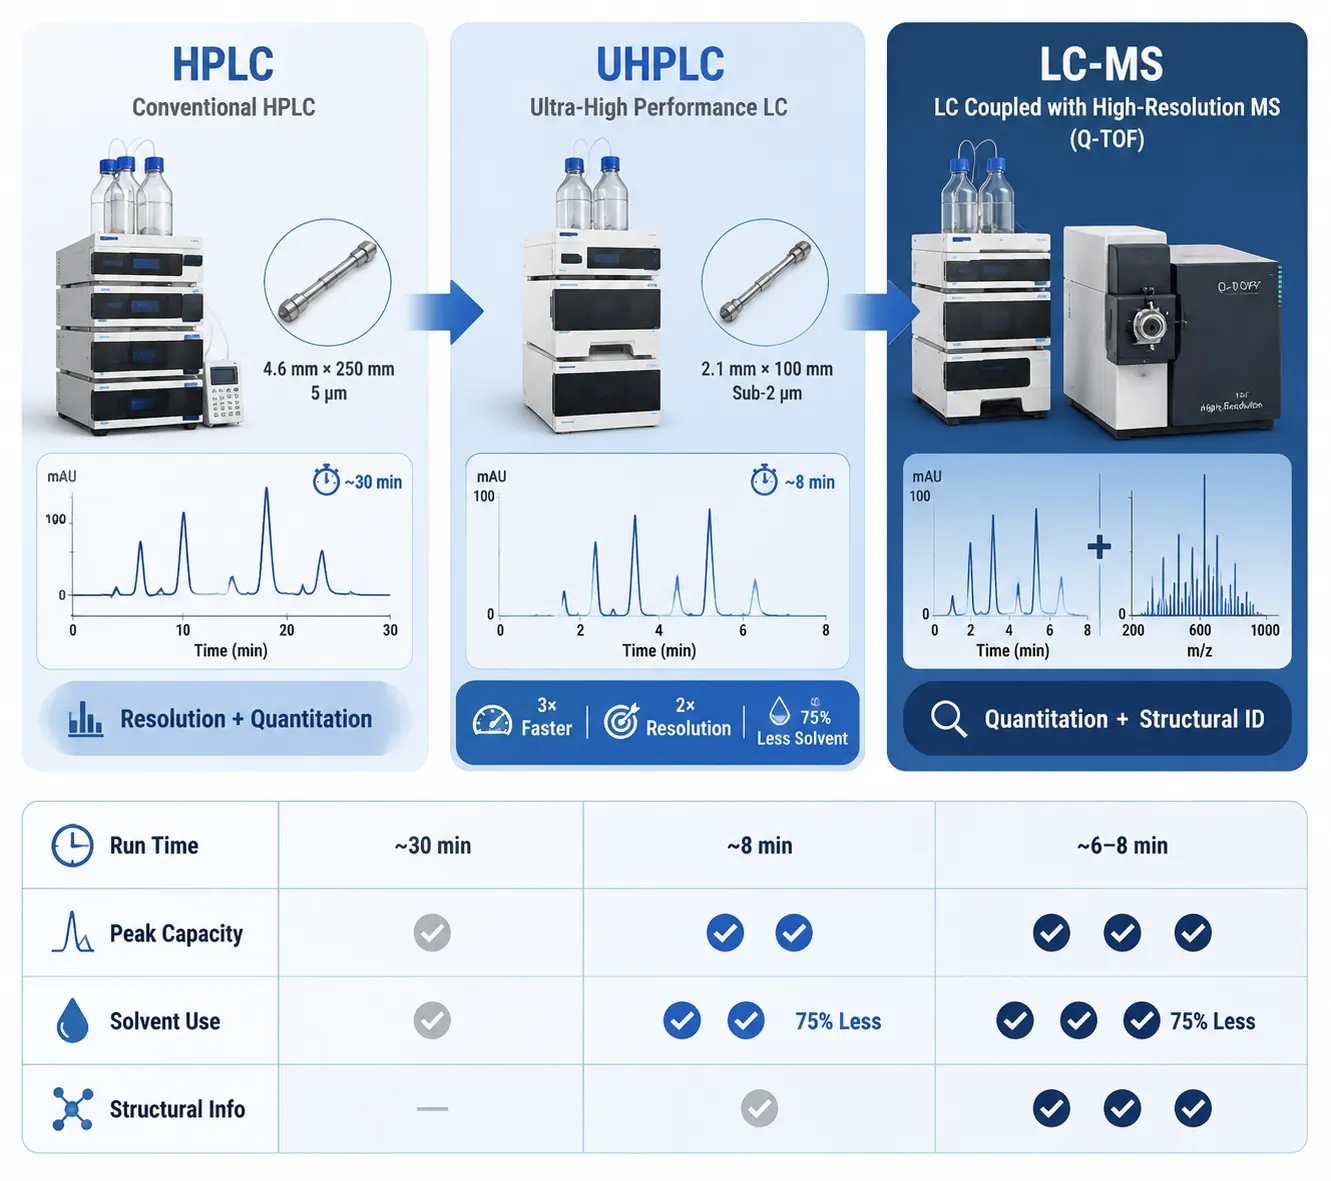 Figure 5: HPLC → UHPLC → LC-MS Technology Progression in Stability-Indicating Method Development
Frequently Asked Questions
Q: What is the difference between a stability-indicating method and a regular assay method?
A: A regular assay method quantifies the API in the presence of excipients and known process impurities. A stability-indicating method must additionally quantify the API in the presence of unknown degradation products generated during storage — species whose identity, retention time, and UV spectrum may be unknown at the time of method development. This requires forced degradation studies to generate representative degradants against which the method's specificity is formally demonstrated.
Q: Is peak purity by PDA alone sufficient to prove stability-indicating capability?
A: No. PDA purity analysis can only detect co-eluting species with detectably different UV spectra. Degradants sharing the parent chromophore — common for aliphatic side-chain modifications — may co-elute without triggering a purity failure. Orthogonal evidence from MS (different m/z) or a second chromatographic dimension (2D-LC) is required to close this gap. The 2024 industry consensus review by Marillier et al. recommends MS-based PPA as the standard orthogonal complement to PDA.
Q: How many stress conditions are required to challenge the method?
A: At minimum, four: acid hydrolysis, base hydrolysis, oxidative stress (H₂O₂), and thermal stress. Photolytic stress per ICH Q1B is strongly recommended — photodegradants are frequently structurally distinct from hydrolytic and oxidative products, and the method cannot claim to be stability-indicating against photodegradants it hasn't been challenged with. Neutral hydrolysis and metal-ion-catalyzed oxidation are supplementary conditions used when the chemistry of the molecule warrants them.
Q: What if the API and a degradant cannot be chromatographically resolved?
A: Document the effort: multiple orthogonal column chemistries, mobile phase pH screens, and gradient optimization attempts. If resolution remains inadequate (Rs < 1.0), the strategy shifts to proving — via MS and 2D-LC — that the unresolved species does not interfere with API quantitation. Specifically, demonstrate that the degradant's concentration never exceeds a defined threshold where its contribution to the API peak area would bias the assay result outside the ±2% accuracy window. This is a risk-based approach accepted by regulators when full chromatographic resolution is technically unachievable.
Q: How often should system suitability be run for a stability-indicating method?
A: At the start of every analytical run, before any study samples are injected. The system suitability test (SST) should include: (a) a resolution check between the API and the closest-eluting degradant (the critical pair), using a stressed sample or a spiked mixture; (b) column efficiency (theoretical plates for the API peak); (c) tailing factor (0.8–1.5 for the API peak); and (d) injection precision (RSD of six replicate injections of a standard). If the critical pair resolution falls below the validated minimum (typically Rs ≥ 1.5), the run must be stopped and the column replaced or the mobile phase re-prepared — no sample data generated under those conditions is reportable.
Q: Can a stability-indicating HPLC method be directly transferred to UHPLC?
A: Yes, with systematic adjustments. The stationary phase chemistry should be matched (e.g., same bonded phase on the UHPLC column), and the method conditions geometrically scaled: flow rate × (UHPLC column ID² / HPLC column ID²), injection volume × (UHPLC column volume / HPLC column volume), and gradient time × appropriate scaling factor. However, the transfer must be re-validated — retention times, critical pair resolution, and peak purity must be re-demonstrated because extra-column band broadening, dwell volume, and detector characteristics differ between HPLC and UHPLC systems.
References
- ICH Harmonised Guideline Q1A(R2): Stability Testing of New Drug Substances and Products. ICH, 2003. https://database.ich.org/sites/default/files/Q1A(R2)%20Guideline.pdf
- ICH Harmonised Guideline Q2(R2): Validation of Analytical Procedures. ICH, 2023 (FDA adoption March 2024, 89 FR 16582). https://database.ich.org/sites/default/files/ICH_Q2(R2)_Guideline_2023_1130.pdf
- ICH Harmonised Guideline Q1B: Photostability Testing of New Drug Substances and Products. ICH, 1996. https://database.ich.org/sites/default/files/Q1B%20Guideline.pdf
- Zelesky T, Baertschi SW, Foti C, et al. Pharmaceutical Forced Degradation (Stress Testing) Endpoints: A Scientific Rationale and Industry Perspective. J Pharm Sci. 2023;112(12):2948-2964. doi:10.1016/j.xphs.2023.09.003
- Marden S, Campbell JM, Adams N, et al. Mass Balance in Pharmaceutical Stress Testing: A Review of Principles and Practical Applications. AAPS J. 2024;26(5):96. doi:10.1208/s12248-024-00961-3
- Marillier P, Adams N, Baertschi SW, et al. Liquid Chromatographic Peak Purity Assessments in Forced Degradation Studies: An Industry Perspective. LCGC Int. 2024;1(1):22-31. doi:10.56530/lcgc.int.xd8667o5
- Mohannaik K, Basha SS, Bhaskar B, Malarvannan M. An Overview of Developments in Stability-Indicating Chromatographic Methods: an Essential Part of Regulatory Considerations. J Anal Chem. 2024;79(Suppl 1):S1-S13. doi:10.1134/S1061934824030092
- Baertschi SW, Alsante KM, Reed RA, eds. Pharmaceutical Stress Testing: Predicting Drug Degradation. 2nd ed. CRC Press; 2011. https://www.routledge.com/9781439801796
- FDA Guidance for Industry: Analytical Procedures and Methods Validation for Drugs and Biologics. U.S. Department of Health and Human Services, 2015. https://www.fda.gov/media/87801/download
- USP General Chapter <1225>: Validation of Compendial Procedures. United States Pharmacopeia. https://www.usp.org/harmonization-standards/pdg/excipients/1225
Related Services


