Why In Vitro Stability Screening Matters in Early Drug Discovery
Every drug discovery program faces the same bottleneck: synthesizing compounds is fast, but characterizing their pharmacokinetic fate is slow. In vitro stability screening breaks this bottleneck by answering the most fundamental DMPK question — "how long does this compound survive in a biological system?" — in days rather than weeks, using micrograms rather than milligrams.
The logic is straightforward. A compound that degrades in plasma within minutes will never reach its target, regardless of potency. A compound that is rapidly metabolized by liver enzymes will have high clearance, a short half-life, and — in all likelihood — poor oral bioavailability. These liabilities must be identified before animal PK studies, not after, because every dollar spent characterizing an unstable compound in vivo is a dollar wasted. In vitro stability screening is the gatekeeper: it deprioritizes the unstable and triages the promising into more resource-intensive studies.
Five complementary assays form the core stability screening cascade. Plasma stability assesses degradation by esterases, amidases, and other hydrolytic enzymes circulating in blood — the first enzymatic environment a compound encounters after absorption or intravenous administration. Microsomal stability measures NADPH-dependent oxidative metabolism by cytochrome P450 enzymes — the dominant clearance mechanism for the majority of small-molecule drugs. Chemical stability probes non-enzymatic degradation driven by pH, oxidation, and light — the same forces that determine shelf life and gastrointestinal survival. Hepatocyte stability captures both Phase I and Phase II metabolism in an intact cellular context, revealing clearance pathways that microsomes miss. S9 fraction stability occupies the middle ground: more complete than microsomes (it includes cytosolic Phase II enzymes), simpler than hepatocytes (no membrane barrier to cross).
At Creative Proteomics DMPK, in vitro stability profiling is designed as an integrated screening cascade rather than an à la carte menu. The five assays share a common analytical readout — LC-MS/MS quantification of parent compound remaining at timed intervals — enabling direct cross-assay comparison and a unified data package for go/no-go decisions.
Where in vitro stability screens for metabolic vulnerability, forced degradation studies probe the chemical degradation landscape under deliberate hydrolytic, oxidative, photolytic, and thermal stress — the two approaches are complementary pillars of a complete stability characterization program. Chemical stress reveals what the molecule does to itself; metabolic stability reveals what the body does to the molecule.
Plasma and Serum Stability: Species Comparison and Protocol Design
Plasma is not a passive carrier — it is an enzymatically active medium. Human plasma contains butyrylcholinesterase, paraoxonase, carboxylesterases, and a host of other hydrolytic enzymes that can degrade compounds before they ever reach a hepatocyte. Plasma stability testing answers a simple question with profound implications: does the compound survive in circulation long enough to distribute to its target?
Protocol Design. The standard plasma stability assay incubates the test compound (typically 1 µM) in pooled plasma at 37°C, with aliquots withdrawn at timed intervals (0, 15, 30, 60, 120 minutes) and quenched with ice-cold acetonitrile containing internal standard. LC-MS/MS quantification of parent compound remaining at each time point yields a degradation rate constant (k) from the slope of ln(% remaining) vs. time, and a half-life from t1/2 = 0.693/k. This protocol, standardized by Di, Kerns, Hong, and Chen in 2005, remains the industry benchmark two decades later — a testament to its robustness.
Species Comparison — Why It Matters. Plasma stability varies dramatically across species. A compound stable in human plasma for >120 minutes may degrade in rodent plasma within 15 minutes — or vice versa. This species-dependent instability has direct consequences: if the rat used in preclinical toxicology clears the compound through a plasma esterase that humans lack, the toxicology study may underestimate human exposure. Conversely, if the rat is uniquely stable and the human rapidly hydrolyzes the compound, the toxicology package overestimates the safety margin. The minimum plasma stability panel should include human, rat, and mouse plasma; dog should be added when the dog is the non-rodent toxicology species. Interspecies plasma stability data also informs bioanalytical method development: unstable compounds require immediate plasma separation at 4°C, esterase inhibitors (e.g., dichlorvos, PMSF) in collection tubes, and pH-controlled storage conditions to prevent ex vivo degradation between sample collection and analysis.
EDTA vs. Heparin. The choice of anticoagulant is not trivial. EDTA chelates calcium, which is a cofactor for some plasma esterases — EDTA plasma can artificially stabilize compounds that would degrade in heparinized plasma or in vivo. Heparin is generally preferred for stability studies because it preserves the ionic environment closer to physiological conditions, but the anticoagulant choice should be consistent across all samples within a study and documented in the bioanalytical report.
Functional Groups at Risk. Esters are the obvious liability — most plasma esterases evolved to hydrolyze ester bonds. But lactones, amides (particularly anilides), carbamates, sulfonamides, and peptide bonds are also susceptible. The presence of any of these groups in a lead series should trigger plasma stability screening at the earliest opportunity, ideally before the first rodent PK study.
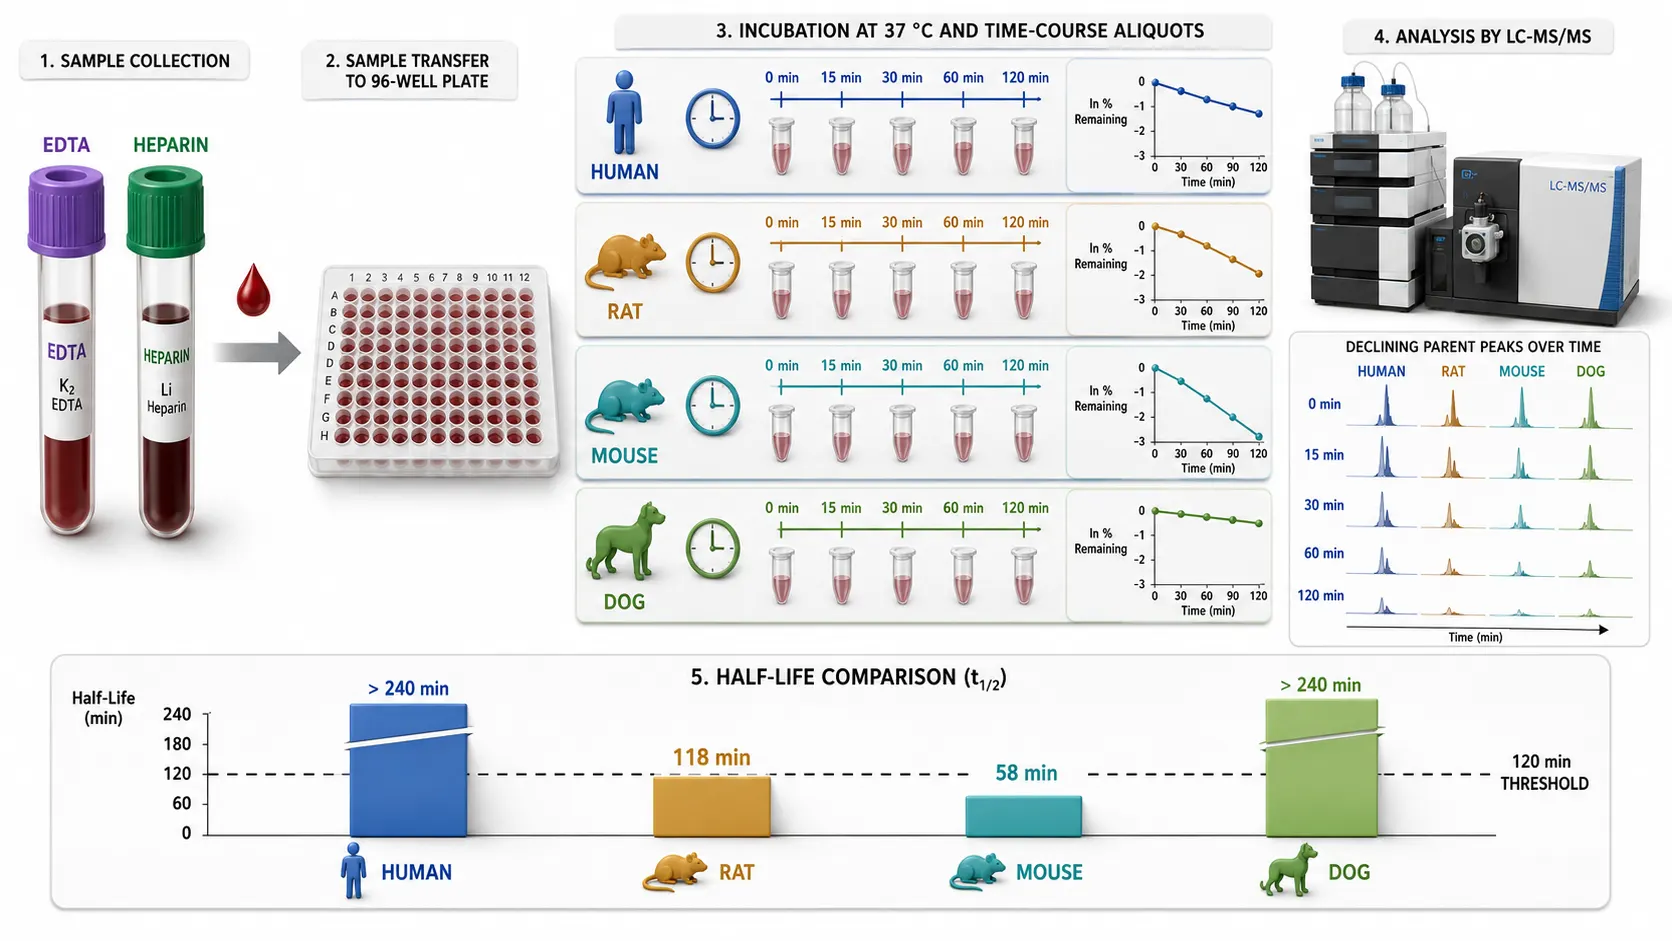 Figure 1: Plasma Stability Assay Workflow with Species Comparison
Microsomal Stability and Intrinsic Clearance Determination
If plasma stability asks "does the compound survive in blood?", microsomal stability asks "does the compound survive first-pass through the liver?" For most small-molecule drugs, the answer determines whether oral dosing is viable.
The Assay. Liver microsomes — vesicles of endoplasmic reticulum membrane enriched in cytochrome P450 enzymes — are incubated with the test compound (1 µM) in the presence of an NADPH-regenerating system at 37°C. The NADPH cofactor is the electrons source for CYP-mediated oxidation; without it, no Phase I metabolism occurs. Aliquots are withdrawn at 0, 5, 15, 30, and 60 minutes, quenched with ice-cold acetonitrile, and analyzed by LC-MS/MS. A minus-NADPH control (substituting buffer for the cofactor solution) runs in parallel to distinguish enzymatic metabolism from non-specific binding, chemical instability, or cofactor-independent degradation.
Calculating Intrinsic Clearance. The elimination rate constant (k, min−1) is derived from the slope of ln(% remaining) versus time. The in vitro half-life is t1/2 = 0.693/k, and the in vitro intrinsic clearance is:
CLint (µL/min/mg protein) = (0.693 / t1/2) × (incubation volume µL / microsomal protein mg)
Species Panel Strategy. A standard five-species panel — human (HLM), rat (RLM), mouse (MLM), dog (DLM), and monkey (CyLM) — serves three purposes. First, it identifies the preclinical species whose metabolic profile most closely matches human, informing the choice of toxicology species. Second, it reveals species-specific metabolic vulnerabilities: a compound stable in HLM (t1/2 > 60 min) but rapidly cleared in RLM (t1/2 < 15 min) may still be developable, but the rat toxicology data will need careful interpretation. Third, it provides the raw data for physiologically-based scaling to in vivo clearance across species. The standard interpretation framework classifies compounds with HLM t1/2 > 60 minutes as low-clearance (CLint < 10-15 µL/min/mg), 30-60 minutes as moderate, and < 30 minutes as high-clearance — but these cutoffs are guidelines, not rules, and should be calibrated against in-house historical data.
Protein Binding Correction. Lipophilic compounds bind non-specifically to microsomal membranes, reducing the free fraction available for metabolism (fu,mic). Ignoring this binding leads to overestimation of the true unbound intrinsic clearance. For early screening where throughput is paramount, the simplified approach — reporting CLint uncorrected for binding — is adequate for rank-ordering within a chemical series. For lead optimization candidates where absolute clearance prediction matters for dose projection, experimentally determined fu,mic (via equilibrium dialysis or ultrafiltration in the incubation matrix) should be applied: CLint,u = CLint / fu,mic.
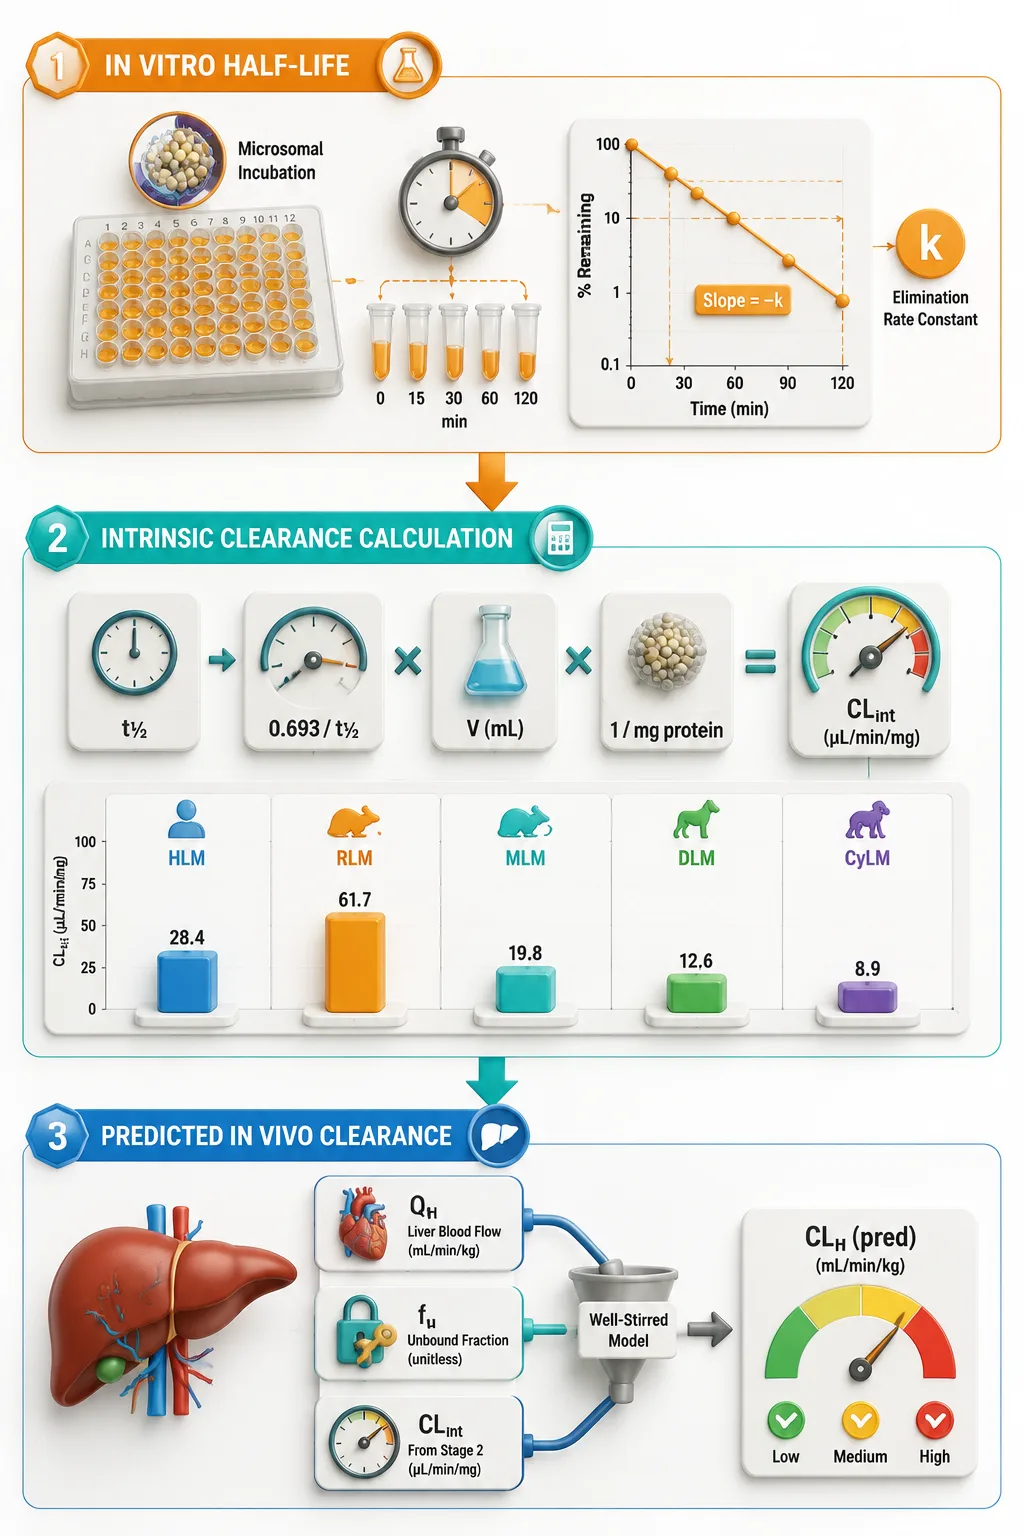 Figure 2: Microsomal Stability to Intrinsic Clearance — The IVIVE Pipeline
Chemical Stability: pH Profile, Simulated Fluids, and Oxidative Challenge
Enzymatic metabolism is only half the stability story. Compounds can degrade through purely chemical mechanisms — hydrolysis, oxidation, photolysis — without any enzyme involvement. Chemical stability screening identifies these non-enzymatic liabilities before they cause problems in formulation development or gastrointestinal transit.
pH Stability Profile. The gastrointestinal tract presents a pH gradient from strongly acidic (stomach, pH 1-2) to mildly basic (distal small intestine, pH 7-8). An oral drug must survive this entire transit without significant degradation. pH stability is assessed by incubating the compound in buffers spanning pH 1.0 (simulated gastric), pH 4.5, pH 6.5 (simulated intestinal), and pH 7.4 (blood/physiological) at 37°C, with sampling at 0, 1, 2, 4, and 24 hours. Acid-labile functional groups — certain acetals, ketals, enol ethers, and N-glycosides — will show rapid degradation at pH 1-2 but stability at neutral pH, flagging the need for enteric coating or alternative formulation strategies. Base-labile groups — esters, lactones, and certain amides — degrade preferentially at higher pH, and the kinetics observed at pH 7.4 directly inform predicted shelf-life at physiological temperature.
Simulated Gastrointestinal Fluids. Beyond pH alone, the enzymatic content of gastrointestinal fluids matters. Simulated Gastric Fluid (SGF, pH 1.2, containing pepsin) and Simulated Intestinal Fluid (SIF, pH 6.8, containing pancreatin) are the standard biorelevant media. For more predictive assessment, Fasted-State Simulated Intestinal Fluid (FaSSIF, pH 6.5) and Fed-State Simulated Intestinal Fluid (FeSSIF, pH 5.0) incorporate bile salts and lecithin at physiologically relevant concentrations. A compound stable in simple phosphate buffer at pH 6.8 may degrade in FaSSIF due to bile salt-catalyzed hydrolysis or solubilization-enhanced accessibility of labile groups — an effect that simple buffer studies miss.
Oxidative Challenge. Chemical oxidation — distinct from CYP-mediated enzymatic oxidation — is probed with hydrogen peroxide (0.3-3% H2O2, ambient to 40°C, 1-24 hours). This is particularly relevant for compounds containing sulfides, thioethers, electron-rich aromatic rings, and certain heterocycles prone to auto-oxidation. A positive result in the chemical oxidative screen, combined with a negative result in the microsomal (NADPH-dependent) screen, suggests a non-enzymatic oxidative degradation pathway that may manifest during long-term storage rather than during first-pass metabolism — a distinction with different mitigation strategies.
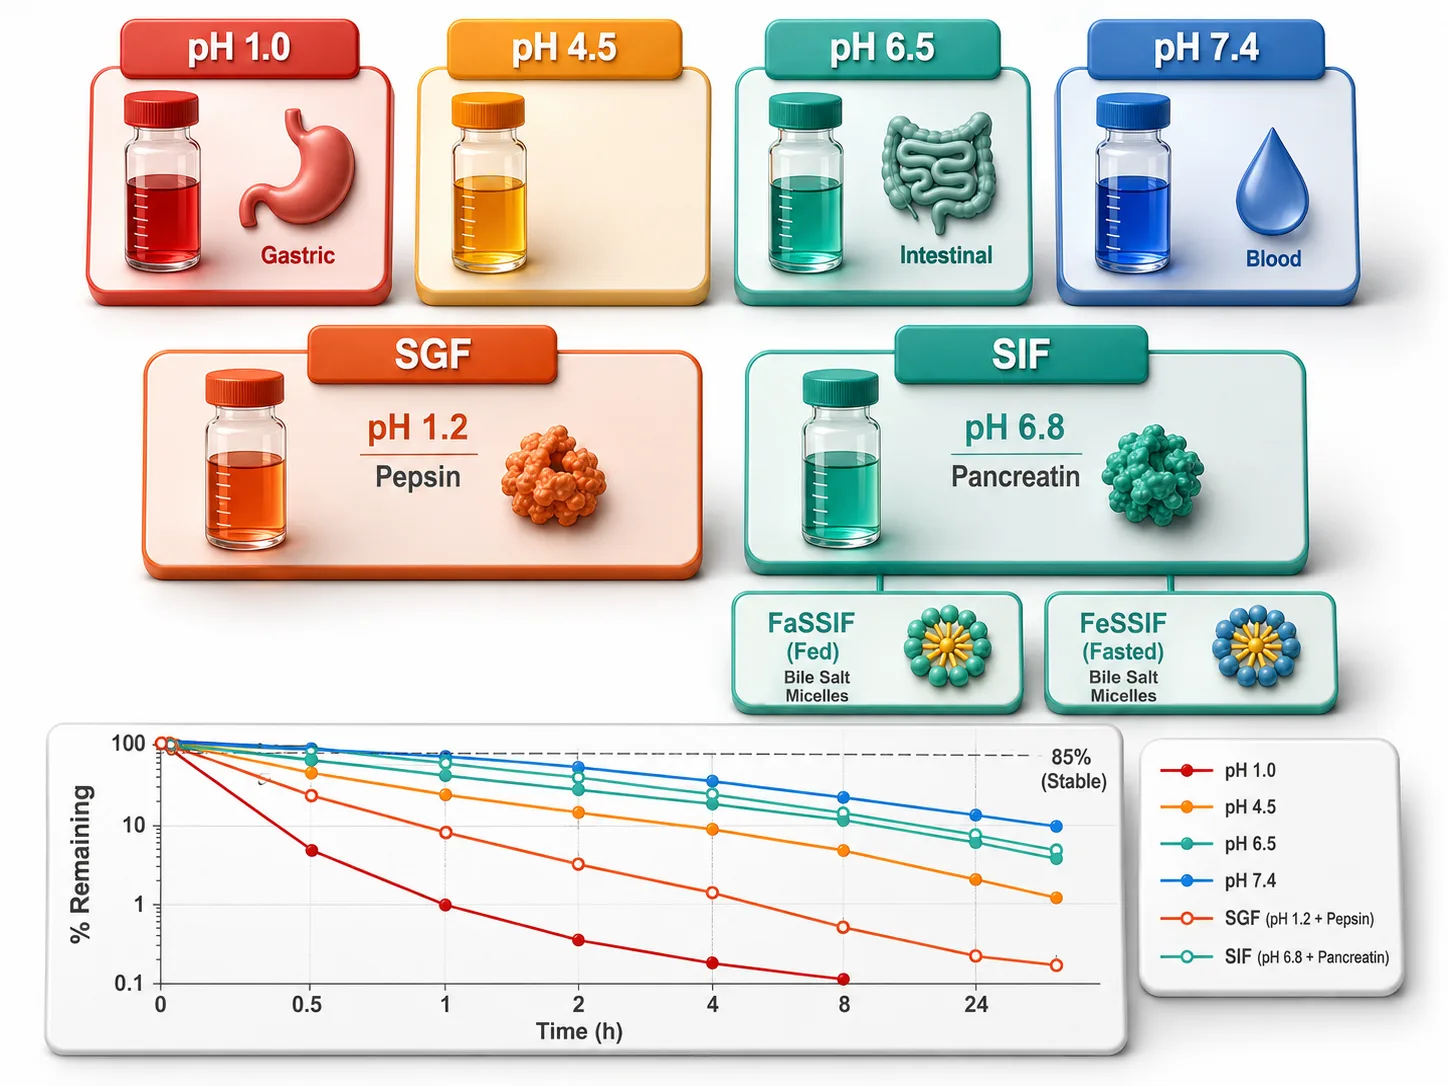 Figure 3: Chemical Stability — pH Profile and Simulated Fluid Degradation Kinetics
Hepatocyte and S9 Stability: When Microsomes Underestimate Clearance
Liver microsomes are the workhorse of metabolic stability screening, but they have a known blind spot: they lack cytosolic enzymes. Aldehyde oxidase (AO), xanthine oxidase, alcohol dehydrogenase, aldehyde dehydrogenase, and — critically — the UDP-glucuronosyltransferases (UGTs) and sulfotransferases (SULTs) that catalyze Phase II conjugation are either absent or non-functional in standard microsomal preparations. For compounds predominantly cleared by these non-CYP pathways, microsomal stability data will systematically underestimate true clearance — sometimes by orders of magnitude.
Hepatocyte Stability. Cryopreserved primary hepatocytes contain the full complement of Phase I and Phase II drug-metabolizing enzymes in their native subcellular localization, operating within an intact cellular environment that preserves membrane barriers, cofactor pools (NADPH, UDPGA, PAPS), and the interplay between uptake transport, metabolism, and efflux. The hepatocyte stability assay follows the same parent-disappearance format as the microsomal assay, with incubations typically extending to 120-180 minutes to capture slower Phase II kinetics. Hepatocyte stability is indicated when: (a) the microsomal stability screen shows unexpectedly low turnover for a compound that has structural alerts for AO, UGT, or SULT metabolism; (b) the compound belongs to a chemical series where in vitro-in vivo clearance extrapolation (IVIVE) from microsomes consistently underpredicts observed in vivo clearance; (c) the compound is highly polar or zwitterionic — poor membrane permeability may limit microsomal access but not prevent cytosolic enzyme access in intact cells; or (d) the program is at lead optimization stage and the decision to advance a candidate requires the highest-confidence clearance prediction achievable with current in vitro technology.
The 2024-2025 Understanding of the Microsome-Hepatocyte Disconnect. Recent work by Bapiro et al. (Drug Metabolism and Disposition, 2023) demonstrated that the disconnect between microsomal and hepatocyte intrinsic clearance is specifically attributable to divergent CYP activity — CYP function is significantly lower in intact hepatocytes than in microsomes, while AO and FMO activities correlate well between the two systems. Maurer et al. (Pharmaceuticals, 2025) showed in a 211-compound dataset that microsomes and hepatocytes actually perform similarly for IVIVE (53% vs 46% within 2-fold, respectively), once nonspecific binding is properly accounted for. The takeaway is nuanced: hepatocytes are not universally superior to microsomes, but they are essential for compounds where non-CYP clearance pathways dominate or where the CYP-specific disconnect is suspected.
S9 Fraction Stability — The Pragmatic Middle Ground. The S9 fraction — the 9,000g supernatant of liver homogenate — contains both microsomes and cytosol. When supplemented with the appropriate cofactors (NADPH for Phase I, UDPGA for glucuronidation, PAPS for sulfation), the S9 assay captures the combined Phase I + Phase II metabolic capacity in a single incubation. Running parallel incubations with different cofactor combinations — NADPH-only (Phase I), NADPH+UDPGA (Phase I + glucuronidation), and NADPH+UDPGA+PAPS (Phase I + full Phase II) — deconvolves the relative contributions of each pathway. The S9 assay is substantially simpler and cheaper than hepatocyte culture, making it suitable for earlier-stage screening when hepatocyte data is not yet justified but microsomal data alone is insufficient.
From In Vitro Half-Life to Predicted In Vivo Clearance
The in vitro half-life is not the endpoint — it is the starting point for predicting what happens in a whole organism. The chain of calculations that converts a microsomal t1/2 into a predicted human clearance value is called in vitro-to-in vivo extrapolation (IVIVE), and it is one of the most impactful — and most frequently misapplied — calculations in drug discovery DMPK.
The Scaling Ladder. Step 1: in vitro intrinsic clearance in the incubation (CLint, in vitro, µL/min/mg protein) is calculated from t1/2 as described in Section 3. Step 2: this value is scaled to the whole-liver level using two physiological scaling factors — microsomal protein per gram of liver (45-52.5 mg/g for human) and liver mass per kilogram of body weight (20-26 g/kg for human). The product yields the in vivo intrinsic clearance: CLint, in vivo (mL/min/kg) = CLint, in vitro × (mg protein/g liver) × (g liver/kg BW) / 1000. Step 3: the well-stirred liver model converts intrinsic clearance to hepatic clearance by accounting for liver blood flow (QH, approximately 20.7 mL/min/kg in human) and plasma protein binding (fu):
CLH = (QH × fu × CLint, in vivo) / (QH + fu × CLint, in vivo)
The Classification That Drives Decisions. The predicted hepatic clearance is compared to the species-specific hepatic blood flow to classify the compound: low clearance (< 30% of QH), intermediate (30-70%), or high (> 70%). Low-clearance compounds are the most desirable — they will have long half-lives, low first-pass extraction, and good oral bioavailability. High-clearance compounds face an uphill battle: even if absorbed, a large fraction is eliminated on first pass through the liver, requiring higher doses and producing greater inter-individual variability. Intermediate-clearance compounds are developable but require attention to the variables that influence clearance — enzyme induction or inhibition, genetic polymorphism, and disease state can each push an intermediate-clearance compound into the high-clearance zone.
When IVIVE Goes Wrong. Systematic underprediction of in vivo clearance by a factor of 2- to 5-fold is the rule, not the exception, across both microsomes and hepatocytes. The underprediction increases with increasing in vivo clearance — high-clearance compounds are predicted less accurately than low-clearance ones. The dominant sources of error, beyond the microsome-hepatocyte disconnect discussed above, are: (a) ignoring microsomal binding (fu,mic), which causes overestimation of free CLint and underprediction of in vivo clearance — ironically, correcting for fu,mic makes the prediction worse when the wrong binding value is used; (b) using literature rather than experimentally determined scaling factors for MPPGL and liver weight; and (c) applying the well-stirred model to compounds that violate its core assumption — that the unbound concentration at the enzyme site equals the unbound concentration in the perfusing blood, which fails for compounds with permeability-limited hepatic uptake or sinusoidal efflux transporters. For early discovery, the value of IVIVE is not the absolute accuracy of the predicted clearance number but the rank-ordering of compounds within a series and the identification of the clearance mechanism — CYP vs. non-CYP, hepatic vs. extra-hepatic — that drives the prediction.
When stability data graduates from internal decision-making to regulatory submission, it must satisfy the bioanalytical method validation standards of ICH M10. The guideline mandates that the LC-MS/MS method used to generate every stability time point — every percent-remaining value, every half-life calculation — has been validated for accuracy, precision, selectivity, and stability under the exact conditions of the assay. IVIVE predictions are only as defensible as the concentration data they are built on.
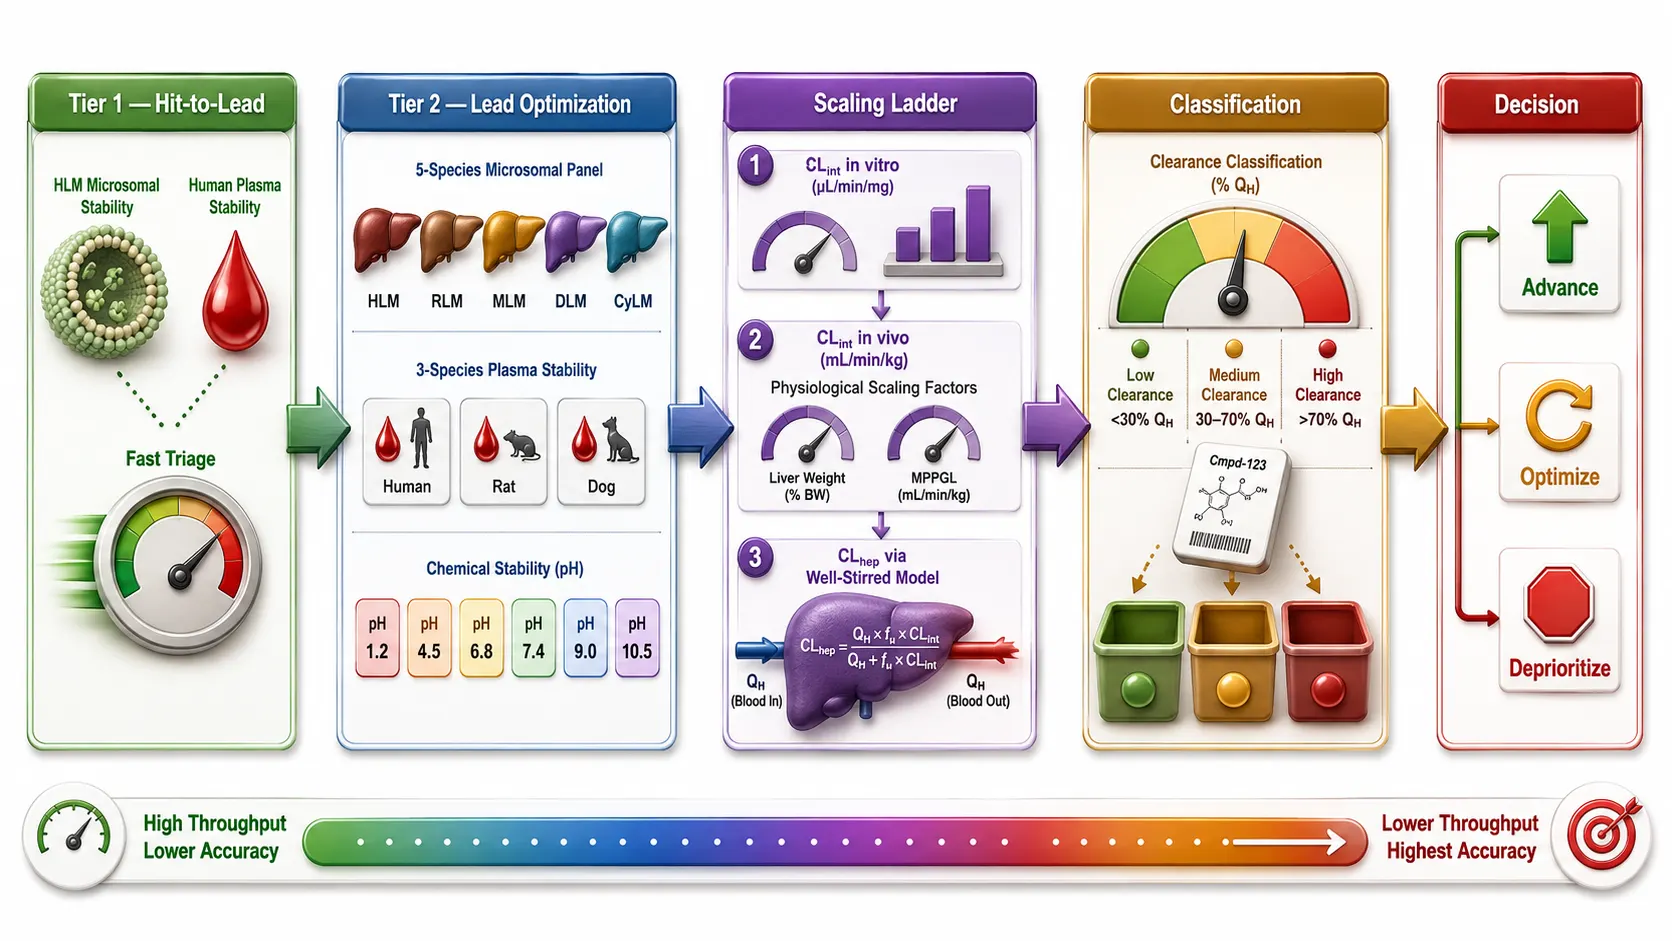 Figure 4: In Vitro Stability Screen to In Vivo Clearance Prediction — The Full IVIVE Workflow
Stability Screening Decision Tree: Which Assay, When, and Why
Running all five stability assays on every compound is wasteful. Running only one risks missing a clearance pathway that dominates in vivo. The solution is a tiered decision tree that allocates assays based on the stage of the program, the chemistry of the compound, and the answers emerging from preceding assays.
Tier 1 — Hit-to-Lead (High Throughput). Microsomal stability (HLM only) + plasma stability (human only). These two assays together capture the dominant Phase I clearance mechanism and the most common source of non-hepatic degradation. Compounds with HLM t1/2 < 15 minutes or plasma t1/2 < 30 minutes are flagged for structural modification. At this stage, throughput matters more than accuracy — single time point or two-point (0 and 30 min) formats are acceptable for triage, with full time-course analysis reserved for compounds that survive the initial cut.
Tier 2 — Lead Optimization (Standard Panel). Full five-species microsomal panel (HLM, RLM, MLM, DLM, CyLM) + plasma stability across human, rat, and mouse + chemical stability (pH 1.0, 6.5, 7.4, 24 hours). The expanded species panel identifies the animal model whose metabolic profile best predicts human and provides the data for IVIVE-based dose projection in the toxicology species. Chemical stability at this stage prevents late-stage formulation surprises: discovering that a lead compound degrades at gastric pH after six months of optimization is an expensive lesson.
Tier 3 — Candidate Selection (Deep Characterization). Hepatocyte stability (human + toxicology species) + S9 fraction stability with cofactor deconvolution + CYP reaction phenotyping (if CYP metabolism is the major pathway). This tier answers the question the earlier tiers could only approximate: what is the best possible prediction of in vivo clearance, and what is the mechanistic basis for it? It also generates the CYP phenotyping data that informs the drug-drug interaction risk assessment — a regulatory requirement for any compound advancing toward IND.
Chemistry-Driven Triggers. Certain structural features override the tiered logic and trigger specific assays earlier: (a) ester, lactone, or carbamate groups → immediate plasma stability across species, regardless of program stage; (b) carboxylic acid or phenol groups → immediate hepatocyte or S9 stability (these are UGT and SULT substrates — microsomes will miss them); (c) aza-heterocycles with electron-rich aromatic rings → chemical oxidative stability screen; (d) N-oxide or sulfoxide moieties → AO liability assessment via hepatocyte stability or specific AO substrate assay; (e) peptide bonds or amide linkages with aromatic amines → plasma stability plus S9 stability to capture both hydrolytic and conjugative clearance. These chemistry-driven triggers are not esoteric knowledge — they are based on decades of medicinal chemistry experience encoded in the structural alert literature and should be part of every medicinal chemist's mental checklist when designing a new series.
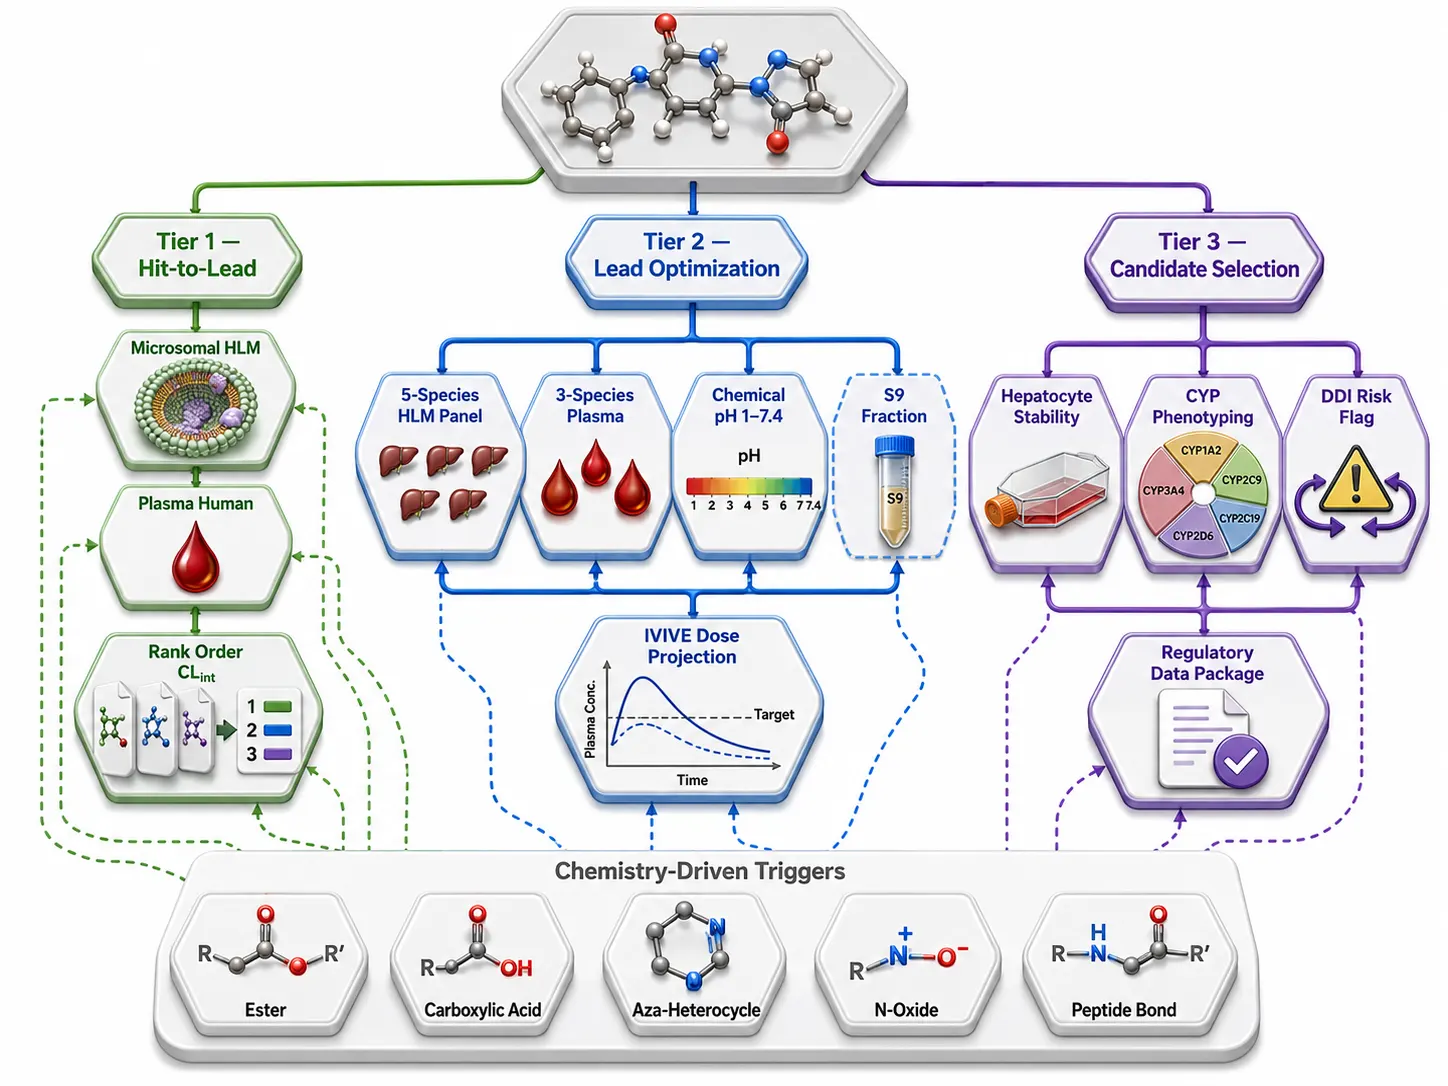 Figure 5: Stability Screening Decision Tree — Tiered Assay Selection Based on Program Stage and Compound Chemistry
Frequently Asked Questions
Q: How much compound do I need for a full stability panel?
A: For the complete five-assay panel (microsomal 5-species + plasma 3-species + chemical stability pH profile + hepatocyte + S9), approximately 2-3 mg of dry powder or 100 µL of 10-20 mM DMSO stock is sufficient. Individual assays require less: a single-species microsomal stability assay needs ~50 µg.
Q: My compound is stable in microsomes but unstable in vivo — why?
A: The most common explanations, in order: (a) non-CYP clearance pathways — aldehyde oxidase, UGTs, or plasma esterases that microsomes lack — are the dominant clearance mechanism; (b) extra-hepatic clearance (renal, biliary, or gut-wall metabolism) contributes significantly; (c) the compound is a substrate for hepatic uptake transporters (OATP1B1/1B3) that deliver it to the hepatocyte interior at concentrations far exceeding the unbound plasma concentration, making liver clearance perfusion rate-limited rather than enzyme-limited. Run a hepatocyte stability assay as the first follow-up — it will capture non-CYP pathways and transporter effects that microsomes miss.
Q: What is an acceptable plasma stability half-life for an oral drug?
A: >120 minutes is considered good and unlikely to be a development liability. 60-120 minutes is acceptable if the compound has favorable properties in all other dimensions. <30 minutes is a red flag — but context matters. If the compound is intended as a prodrug that must be rapidly hydrolyzed, plasma instability is a feature, not a bug. If the compound is administered intravenously and distributed to its target within minutes, a short plasma half-life may be tolerable as long as the pharmacodynamic effect outlasts the plasma exposure.
Q: Why do different species have such different microsomal stability for the same compound?
A: CYP isoform composition, expression level, and substrate specificity vary substantially across species. CYP3A4 (human) and CYP3A1/3A2 (rat) are not identical enzymes — they have overlapping but distinct substrate recognition profiles. CYP2C9 — responsible for the metabolism of many acidic drugs in humans — has no direct ortholog in rodents; rat CYP2C6/2C7 and mouse CYP2C29/2C37 are the closest functional equivalents but differ in both substrate specificity and expression level. This is why empirical testing across species is irreplaceable — no in silico model currently predicts interspecies metabolic differences with sufficient accuracy to substitute for experimental data.
Q: When should I use S9 fraction instead of hepatocytes?
A: S9 is the preferred choice when: (a) throughput is important — S9 assays are 96-well compatible and do not require cell culture; (b) the primary question is "does Phase II metabolism contribute?" rather than "what is the absolute clearance?"; (c) cost is a constraint — S9 is substantially cheaper per data point than hepatocytes. Hepatocytes are preferred when: (a) the absolute clearance prediction must be as accurate as possible (candidate selection stage); (b) transporter-mediated uptake into hepatocytes is suspected to influence clearance; (c) the compound is a low-turnover substrate where the longer incubation times possible with hepatocytes (>180 minutes vs. the 60-minute practical limit for microsomes and S9) are needed to observe sufficient depletion. Many programs use S9 for the initial Phase II assessment and reserve hepatocytes for the final two to three candidates.
Q: How do I handle compounds with very low turnover in microsomes — t1/2 > 180 minutes?
A: Standard microsomal incubation conditions (0.5-1.0 mg/mL protein, 60 minutes) will show negligible depletion for these compounds. Options: (a) increase microsomal protein concentration to 2 mg/mL to increase enzyme-to-substrate ratio; (b) extend incubation time to 120-180 minutes, verifying that microsomal enzyme activity is stable over this period using a positive control; (c) use the hepatocyte "relay" method — sequential addition of fresh hepatocytes at intervals — to extend total incubation time beyond what a single hepatocyte batch can sustain; (d) accept that if a compound shows no measurable turnover under the most aggressive in vitro conditions available, it is likely a very low-clearance compound in vivo, and focus characterization resources on other ADME properties rather than refining a clearance number that will be dominated by assay noise.
References
- Di L, Kerns EH, Hong Y, Chen H. Development and application of high throughput plasma stability assay for drug discovery. Int J Pharm. 2005;297:110-118. https://doi.org/10.1016/j.ijpharm.2005.03.022
- Bapiro TE, et al. The Disconnect in Intrinsic Clearance Determined in Human Hepatocytes and Liver Microsomes Results from Divergent Cytochrome P450 Activities. Drug Metab Dispos. 2023;51(7):892-901. https://doi.org/10.1124/dmd.123.001323
- Maurer TS, et al. Beyond-Rule-of-Five Compounds Are Not Different: In Vitro-In Vivo Extrapolation of Female CD-1 Mouse Clearance Based on Merck Healthcare KGaA Compound Set. Pharmaceuticals. 2025;18(4):568. https://doi.org/10.3390/ph18040568
- Houston JB. Utility of in vitro drug metabolism data in predicting in vivo metabolic clearance. Biochem Pharmacol. 1994;47(9):1469-1479. https://doi.org/10.1016/0006-2952(94)90520-7
- Wan H, et al. Impact of Input Parameters on the Prediction of Hepatic Plasma Clearance Using the Well-Stirred Model. Curr Drug Metab. 2010;11(7):583-594. https://doi.org/10.2174/138920010792927334
- Zhu L, et al. Probing into the plasma stability and microsomal stability of thiol-based prodrug derivatives: Using IYS-15, an HDAC inhibitor as the model thiol. Bioorg Med Chem. 2025;119:118064. https://doi.org/10.1016/j.bmc.2025.118064
- Trunzer M, et al. Improving In Vitro-In Vivo Extrapolation of Clearance Using Rat Liver Microsomes for Highly Plasma Protein-Bound Molecules. Drug Metab Dispos. 2024;52(5):345-354. https://doi.org/10.1124/dmd.123.001597
- Vu NAT, Song YM, et al. Beyond the Michaelis-Menten: Evaluation of a tQSSA-Based IVIVE Approach for Predicting In Vivo Intrinsic Clearance From Hepatocyte Assays. CPT Pharmacometrics Syst Pharmacol. 2025;15(2):e70169. https://doi.org/10.1002/psp4.70169
- Ring BJ, et al. Comparative pharmacokinetics of drugs with short half-lives. Methods Find Exp Clin Pharmacol. 2005;27(Suppl A):25-33.
- ICH Harmonised Guideline M10: Bioanalytical Method Validation and Study Sample Analysis. ICH, 2022. https://database.ich.org/sites/default/files/M10_Guideline_Step4_2022_0524.pdf
Related Services


