Why PBPK for DDI? The Regulatory Landscape in 2026
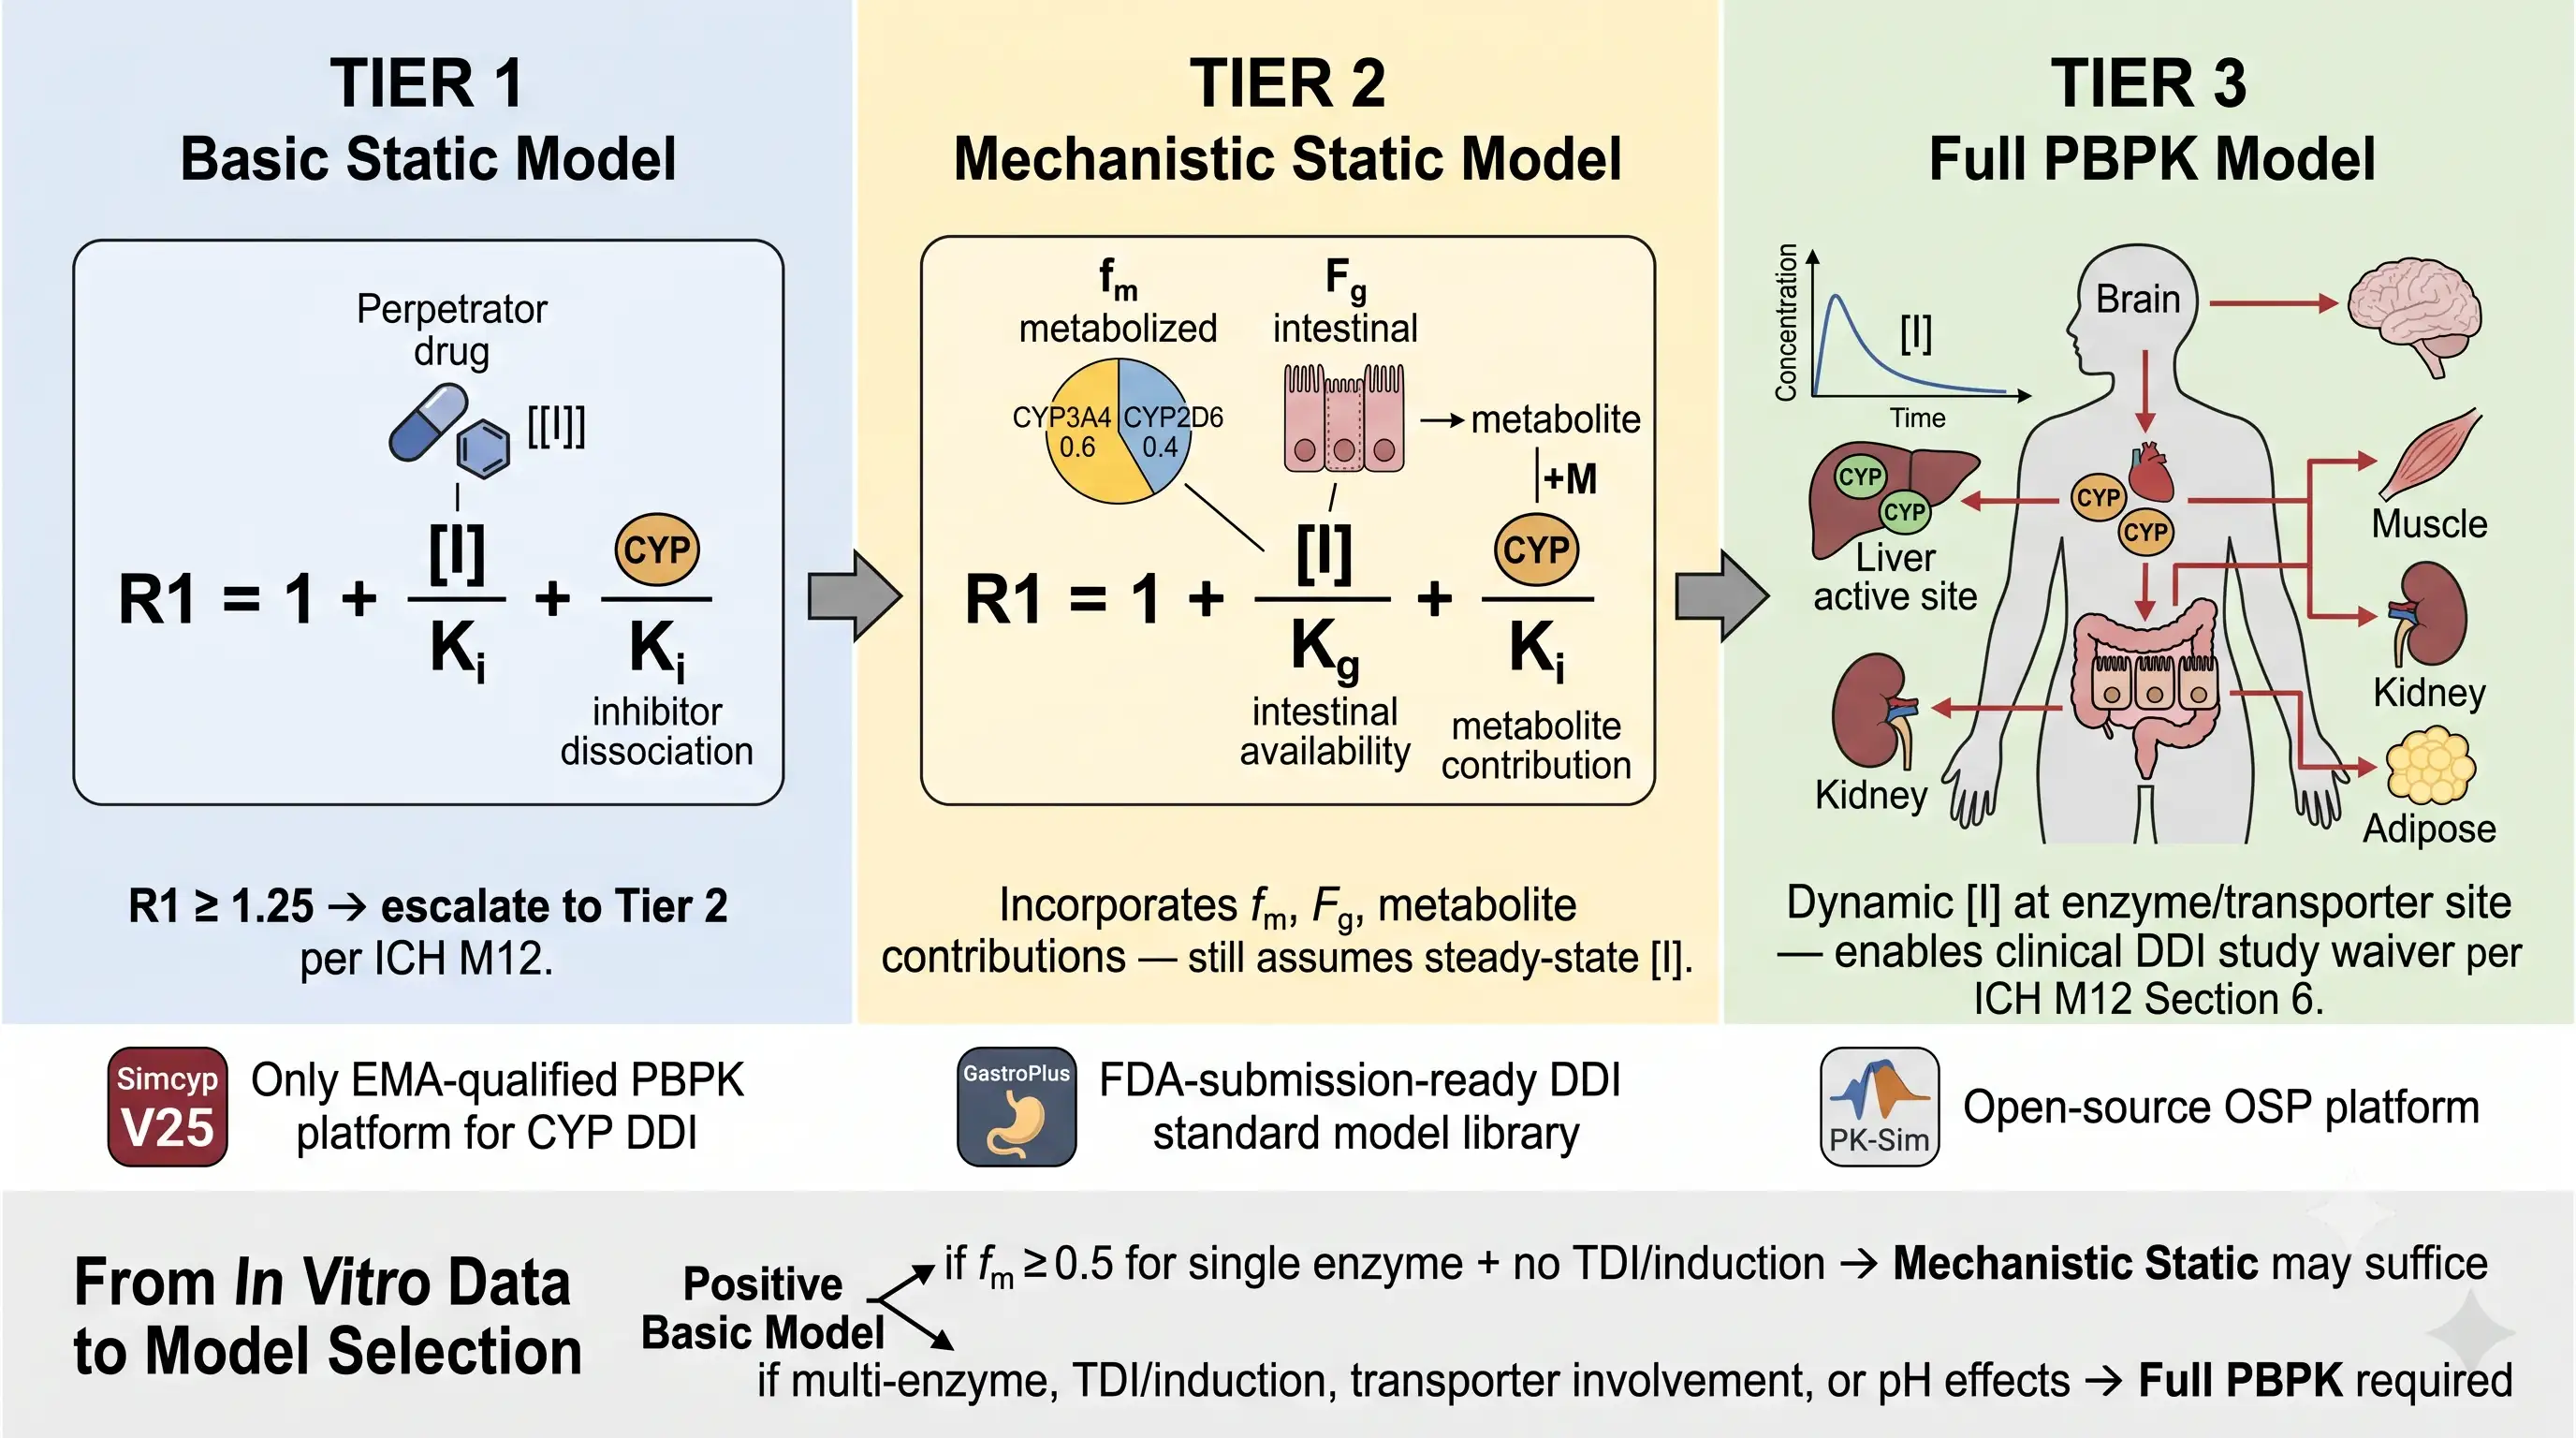 Figure 1: The Three-Tier DDI Modeling Framework — Basic Static → Mechanistic Static → Full PBPK
In January 2026, the ICH adopted M15 — the first globally harmonized guideline on model-informed drug development (MIDD) — and with it, PBPK modeling graduated from a supportive technical activity to a formalized regulatory decision-support discipline. The question is no longer "can PBPK be used for DDI assessment?" but "under what conditions can PBPK substitute for a clinical DDI study?" ICH M12 Section 6 provides the answer: when model credibility is established, PBPK can waive dedicated clinical DDI studies, reducing development timelines by months and trial costs by hundreds of thousands of dollars per avoided study.
The regulatory alignment is unprecedented. ICH M15 establishes a risk-based model credibility framework — context of use, model influence (Low/Medium/High), and totality of evidence — that applies across FDA, EMA, and PMDA. Simultaneously, ICH M12 harmonizes the specific DDI assessment requirements including the PBPK acceptability criteria. In July 2025, the EMA CHMP issued a formal qualification opinion for the Simcyp Simulator V19 for CYP-mediated DDI predictions — the first and only platform-level qualification of its kind, covering CYP1A2, 2C8, 2C9, 2C19, 2D6, and 3A4/5 for competitive and mechanism-based inhibition. Simcyp V25 (March 2026) extended the platform with transporter-mediated DDI capabilities, AI-enabled chat support, and enhanced biopharmaceutics modules, having contributed to over 120 FDA-approved novel drugs.
The business case is equally compelling. A single dedicated clinical DDI study with a strong CYP3A4 inhibitor costs $200,000-500,000 and adds 4-6 months to the development timeline. PBPK-based DDI assessment — built from in vitro data the DMPK team already generates — can answer multiple DDI questions from a single verified model: What is the DDI risk with CYP3A4 inhibitors? CYP2D6 inhibitors? CYP inducers? What happens in renal impairment? In the elderly? Li, Sun & Zhang (2025, Pharmaceutics) analyzed all FDA-approved novel drugs from 2020-2024 and found that 65 of 245 (26.5%) submitted PBPK models as pivotal regulatory evidence, with DDI assessment accounting for 81.9% of all PBPK applications. The trajectory is clear: PBPK is the standard of care for DDI risk assessment in modern drug development.
The in vitro data that feeds PBPK DDI models — CYP inhibition IC50/Ki, TDI kinact/KI, and reaction phenotyping — is generated by the same DMPK assays covered in CYP-mediated DDI assessment. A PBPK model is only as good as the in vitro data it is built on, and the most common FDA rejection reason is not a modeling error — it is an input parameter that was estimated rather than measured.
The Three-Tier DDI Modeling Framework: Basic Static → Mechanistic Static → PBPK
The DDI prediction framework is not a single method but a hierarchy of increasing complexity, data requirements, and predictive power. Understanding when each tier is sufficient — and when it is not — is the foundational skill of DDI risk assessment.
Tier 1 — Basic Static Model. The simplest form: R1 = 1 + [I]/Ki, where [I] is the estimated inhibitor concentration at the enzyme active site and Ki is the in vitro inhibition constant. ICH M12 sets the cutoff at R1 ≥ 1.25: if the predicted AUC ratio of the victim drug is less than 1.25-fold in the presence of the inhibitor, no further DDI investigation is needed. The basic model is intentionally conservative — it uses the maximum unbound systemic inhibitor concentration as [I], assuming worst-case conditions — which makes it an excellent negative predictor (if it says no DDI, there is almost certainly no DDI) but a poor positive predictor (many flagged DDI risks are clinically irrelevant). The basic model is sufficient when: (a) the drug is NOT a time-dependent inhibitor or inducer, (b) clearance is predominantly renal or through multiple enzymes (no single fm ≥ 0.5), and (c) the R1 is well below 1.25.
Tier 2 — Mechanistic Static Model. The mechanistic static model incorporates three additional layers of physiological realism: (a) fm — the fraction of total clearance mediated by the inhibited CYP enzyme, derived from reaction phenotyping; (b) Fg — intestinal wall availability, capturing the contribution of gut CYP3A4 to first-pass metabolism; and (c) metabolite contributions — when a circulating metabolite has its own inhibitory or inductive activity. The mechanistic static model still assumes steady-state inhibitor concentrations, but it can distinguish between a drug with fm,CYP3A4 = 0.9 (high DDI vulnerability) and fm,CYP3A4 = 0.3 (low vulnerability). It is the appropriate tier when: a single CYP enzyme accounts for the majority of clearance, the inhibitor is a reversible inhibitor (not TDI or inducer), and there is no transporter involvement.
Tier 3 — Full PBPK Model. PBPK simulates the complete pharmacokinetic time-course — absorption, distribution, metabolism, and excretion — in each organ compartment, using differential equations to model dynamic inhibitor concentrations at the enzyme or transporter site. The output is not a single AUC ratio but a full concentration-time profile for the victim drug in the presence and absence of the perpetrator. PBPK is the only tier that can capture: (a) non-linear kinetics (saturable metabolism, autoinduction), (b) time-dependent enzyme abundance changes (induction takes days to reach steady state), (c) multi-enzyme metabolic pathways (carbamazepine inducing CYP3A4 + CYP2C8 + CYP2C9 + CYP2C19 simultaneously), (d) transporter-enzyme interplay in the liver and intestine, and (e) pharmacogenetic subpopulation effects. PBPK is also the only tier eligible for clinical DDI study waiver per ICH M12 Section 6. The platform landscape — Simcyp (EMA-qualified V19 for CYP DDI, V25 with transporter expansion, ~80% FDA submission share), GastroPlus with its DDI Standard Model Library (pre-built, verified models for submission efficiency), and PK-Sim (open-source) — provides validated tools for each development stage.
Building the PBPK DDI Model: Input Parameters, Verification, and Common Pitfalls
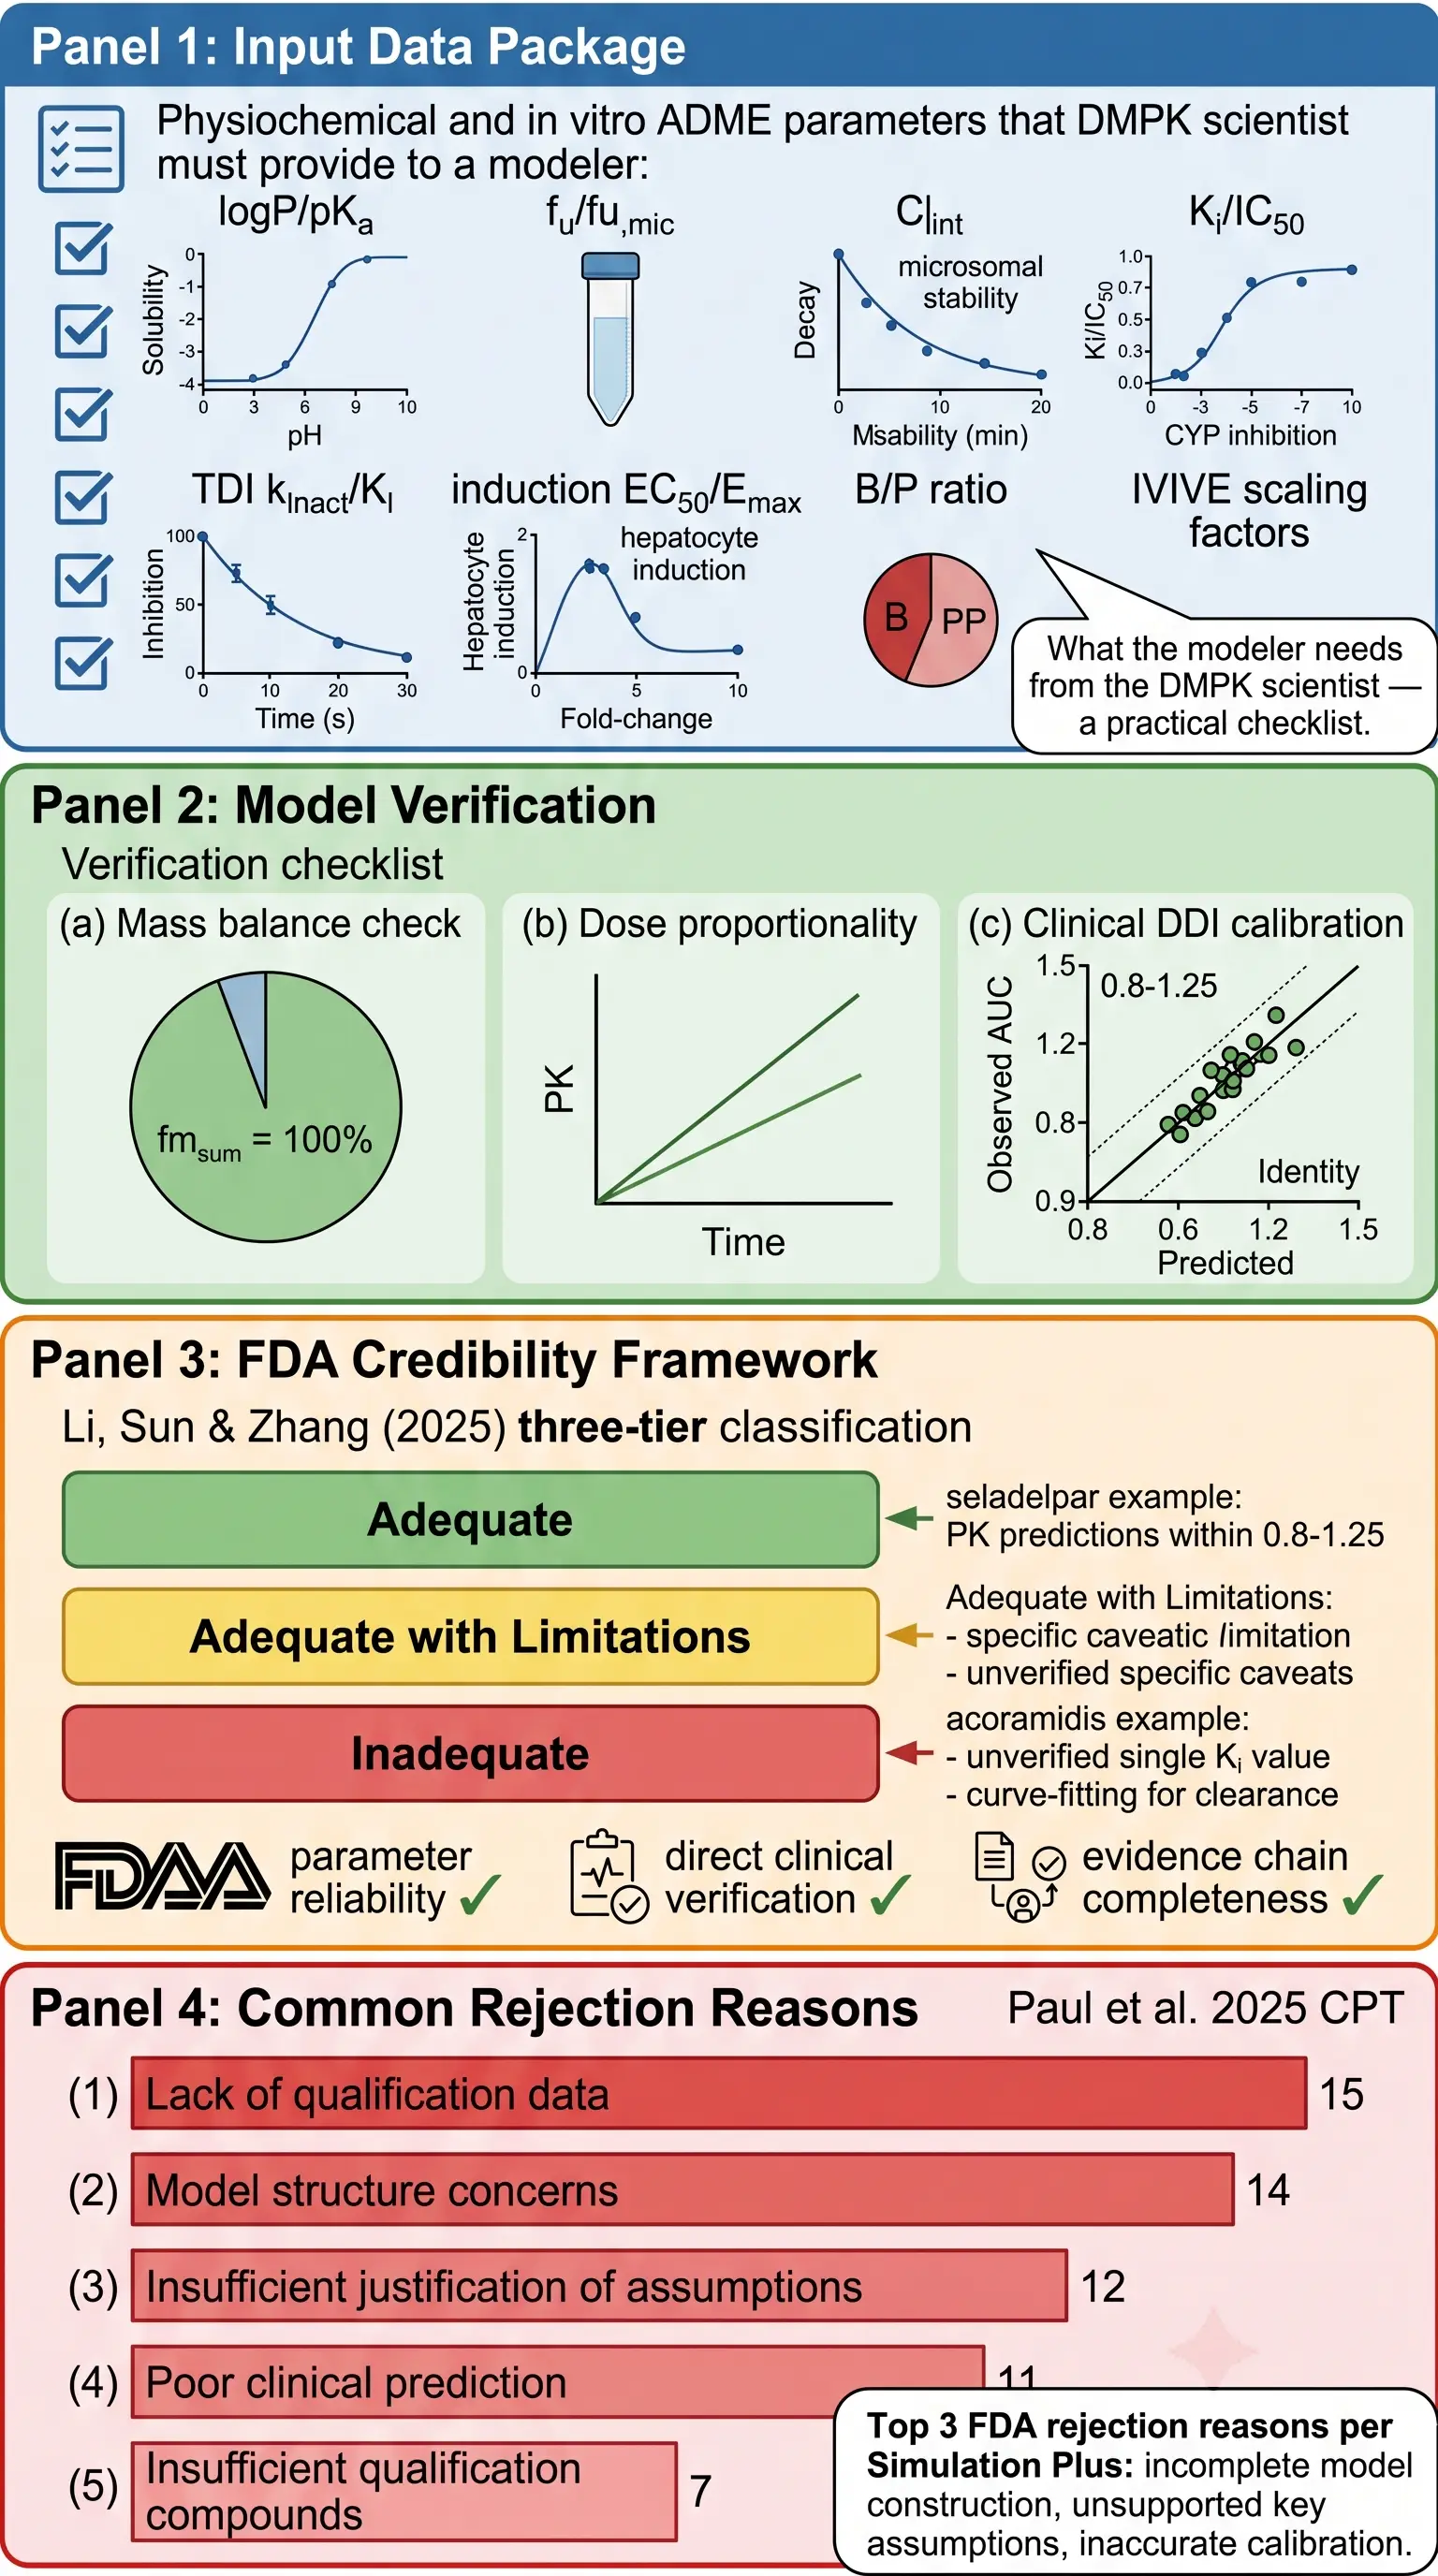 Figure 2: Building the PBPK DDI Model — Input Parameters, Verification, and FDA Credibility Criteria
The PBPK model is a data integration engine, not a data generator. Every prediction it makes is bounded by the quality of the input parameters, and the most consequential decision a PBPK modeler makes is whether to use a measured value or a literature estimate. For DDI prediction, the four parameters that most strongly influence model output — and therefore demand the highest-quality experimental data — are fm (fraction metabolized), Ki or IC50 (inhibitor potency), fu,mic (microsomal free fraction), and the clinical inhibitor concentration at the enzyme site.
The minimum data package a DMPK scientist must provide to the modeler includes: physicochemical properties (logP, pKa, pH-dependent solubility profile); plasma and microsomal protein binding (fu and fu,mic by equilibrium dialysis); blood-to-plasma ratio; intrinsic clearance (Clint from substrate depletion in HLM or hepatocytes); reaction phenotyping (fm by CYP isoform using selective chemical inhibitors or recombinant enzymes); CYP inhibition panel (IC50/Ki for CYP1A2, 2B6, 2C8, 2C9, 2C19, 2D6, 3A4); TDI assessment (kinact/KI by IC50 shift with 30-min NADPH pre-incubation); and CYP induction (EC50/Emax from 3-day cultured human hepatocytes). For drugs where transporters are involved, add: substrate specificity and inhibition data for P-gp, BCRP, OATP1B1/1B3, OAT1/3, OCT2, and MATE1/2K. Each parameter should include the IVIVE scaling factors used (microsomal protein per gram liver, hepatocellularity).
Model verification follows a three-step sequence. Step 1 — Mass balance check: verify that the sum of fm values across all elimination pathways equals 1.0 (or that renal clearance accounts for the remainder). A mass imbalance indicates a missing elimination pathway and will produce systematically biased DDI predictions. Step 2 — Dose proportionality and clinical PK calibration: the model must reproduce the observed clinical PK of the drug (Cmax, AUC, Tmax, t1/2) within predefined acceptance criteria. If the model cannot reproduce the drug's own PK, it cannot predict the effect of a perpetrator on that PK. Step 3 — Independent verification: both the victim and perpetrator models must be verified against independent clinical DDI data — typically, the perpetrator model is verified with a sensitive index substrate (e.g., midazolam for CYP3A4), and the victim model with a strong index inhibitor/inducer. Li, Sun & Zhang (2025) identified three FDA credibility criteria: parameter reliability (critical inputs measured, not estimated), direct clinical verification (at least one clinical DDI study for calibration), and evidence chain completeness (a closed loop from in vitro data → model → clinical observation → regulatory prediction).
The common pitfalls identified in EMA marketing authorization applications, by frequency (Paul et al. 2025, Clin Pharmacol Ther): (1) lack of relevant qualification data — the model wasn't tested against DDI studies with chemically similar compounds (15 cases); (2) model structure concerns — failure to incorporate autoinhibition, intestinal enzyme activity, or a known transporter mechanism (14 cases); (3) insufficient justification of key assumptions — fm values from literature without experimental confirmation, single Ki values without sensitivity analysis (12 cases). A specific example: acoramidis (ATTRUBY, 2024 NDA) had its PBPK model classified as Inadequate because it relied on a single unverified Ki value with 10× variation in sensitivity analysis, and used curve-fitting for clearance — a violation of the mechanistic modeling principle that model parameters must be independently measurable, not fitted to the data the model is supposed to predict.
For drugs that are substrates of drug transporters, transporter-mediated DDI assessment provides the in vitro uptake and efflux data that feeds the transporter module of PBPK models — including OATP1B1/1B3, P-gp, and BCRP inhibition constants that are essential for liver and intestine compartment parameterization.
Transporter-Mediated DDI PBPK: The Fastest-Growing Application
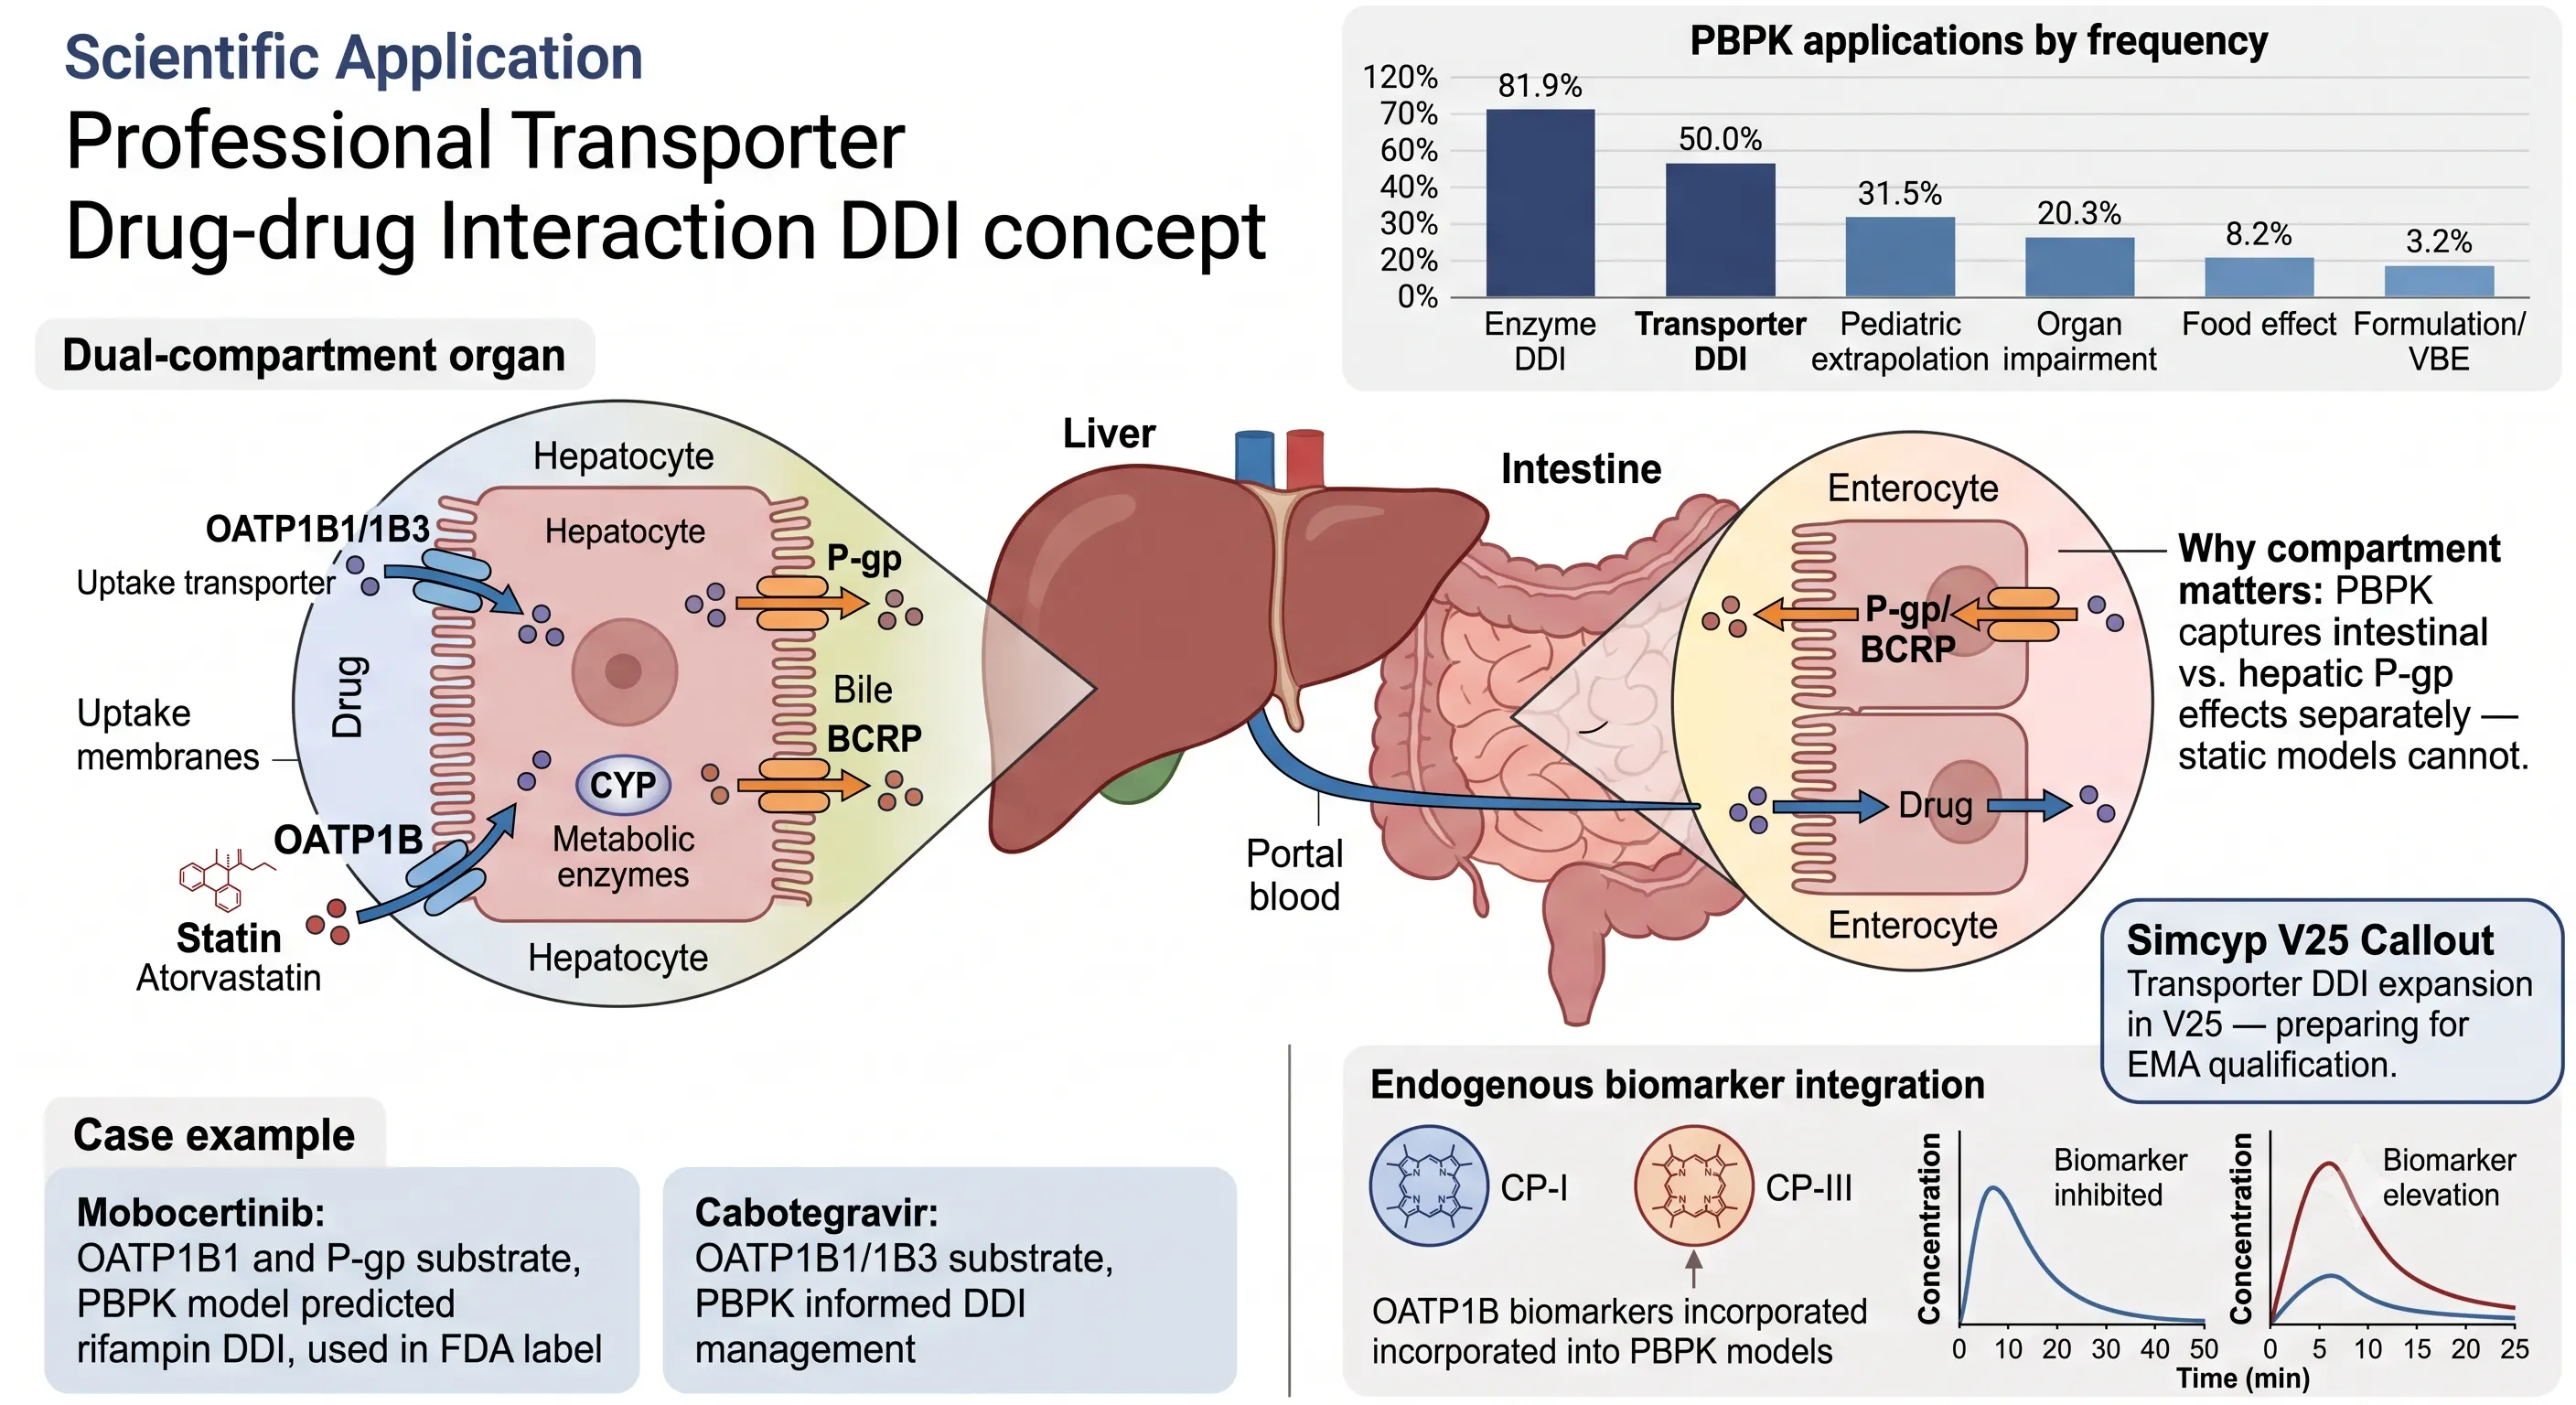 Figure 3: Transporter-Mediated DDI PBPK — The Fastest-Growing Application
FDA analysis of PBPK model applications in approved drugs reveals that transporter-mediated DDI is the second most common PBPK application after enzyme-mediated DDI — and it is the fastest-growing. The reason is mechanistic: static models cannot capture transporter-enzyme interplay because they lack the spatial compartment structure of the hepatocyte. A perpetrator drug that inhibits OATP1B-mediated hepatic uptake reduces the intracellular concentration of the victim drug, which in turn reduces the substrate available for CYP-mediated metabolism — a coupled kinetic effect that requires the differential equation framework of PBPK to resolve.
The hepatic transporter PBPK model distinguishes three kinetic compartments: the sinusoidal (basolateral) membrane where OATP1B1/1B3 and NTCP mediate uptake from portal blood, the intracellular hepatocyte compartment where CYP enzymes and UGTs metabolize the drug, and the canalicular (apical) membrane where P-gp, BCRP, and BSEP mediate efflux into bile. The intestine adds a fourth compartment — the enterocyte apical membrane where P-gp and BCRP efflux drug back to the gut lumen, reducing net absorption. The critical modeling distinction is that intestinal P-gp and hepatic P-gp have different functional consequences: intestinal P-gp reduces oral bioavailability (F), while hepatic P-gp promotes biliary clearance — and only PBPK models these two pools separately. A static model that lumps all P-gp activity into a single parameter cannot distinguish a drug that is a P-gp substrate in the gut (reduced F, potential for intestinal DDI) from one that is a P-gp substrate in the liver (increased biliary clearance, potential for hepatic DDI).
Simcyp V25's transporter DDI expansion, released in March 2026, added compound libraries, case studies, and model documentation specifically targeting the OATP1B, P-gp, BCRP, OAT1/3, OCT2, and MATE1/2K transporter families — laying the groundwork for a future EMA qualification of the transporter module. The GastroPlus DDI Standard Model Library similarly includes pre-verified transporter-drug models for FDA-submission efficiency. Two FDA-reviewed case examples illustrate the regulatory application: mobocertinib, an OATP1B1 and P-gp substrate, where PBPK modeling informed the DDI label without a dedicated clinical transporter DDI study; and cabotegravir, an OATP1B1/1B3 substrate, where PBPK predictions were submitted as part of the regulatory DDI assessment package.
An emerging methodology that strengthens transporter PBPK credibility is endogenous biomarker integration — coproporphyrin-I (CP-I) and coproporphyrin-III (CP-III) are endogenous substrates of OATP1B that circulate at measurable plasma concentrations. When an OATP1B inhibitor is administered, plasma CP-I and CP-III concentrations rise in a dose-dependent manner, providing a real-time, patient-specific biomarker of transporter inhibition that can be modeled within the PBPK framework to verify the transporter component independently of the drug's own PK. This closes a key evidence gap in transporter DDI PBPK: the ability to verify that the transporter module is correctly parameterized before using it to predict drug-specific DDIs.
Complex DDI Scenarios: When Simple Models Are Not Enough
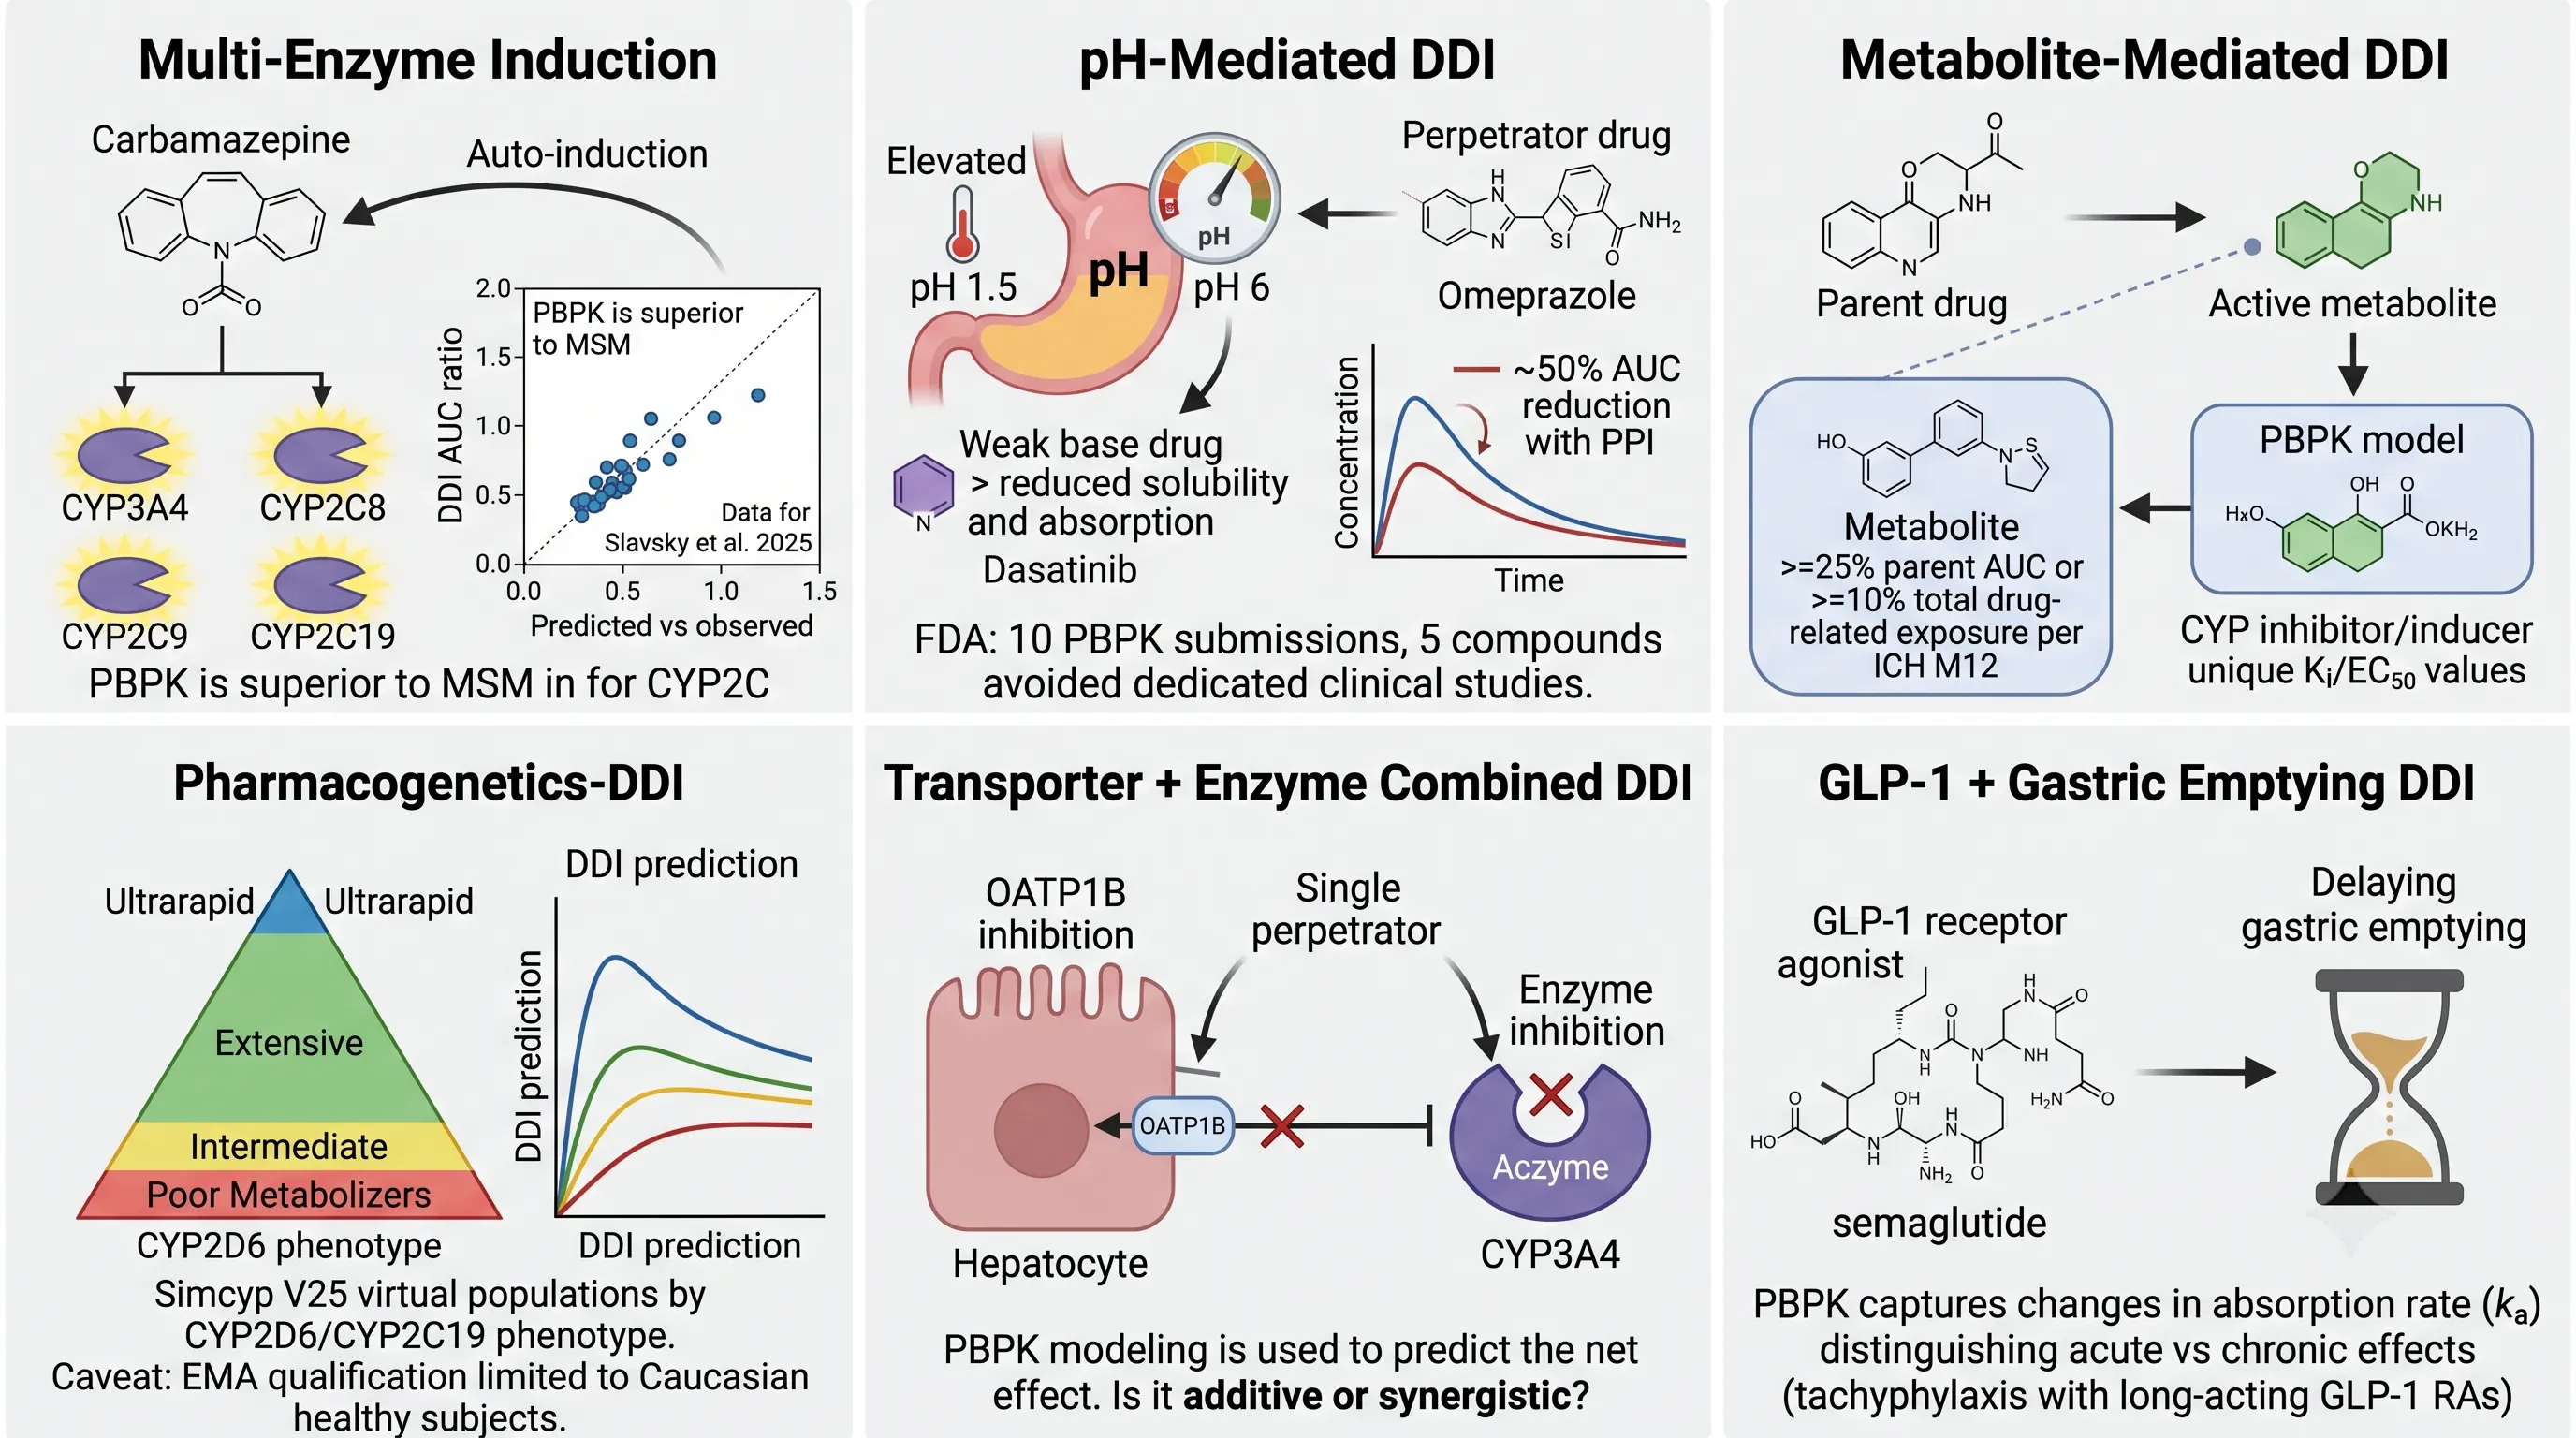 Figure 4: Complex DDI Scenarios — When Simple Models Are Not Enough
The basic static model asks one question: "does this drug inhibit CYP X at clinically relevant concentrations?" Five categories of DDI fall outside this question entirely, and attempting to answer them with static models produces answers that range from misleading to dangerously wrong.
Multi-enzyme induction — the carbamazepine paradigm. Carbamazepine induces CYP3A4, CYP2C8, CYP2C9, CYP2C19, and CYP2B6 simultaneously while also undergoing autoinduction (inducing its own CYP3A4-mediated metabolism, causing its own clearance to increase 2- to 3-fold over 2-3 weeks of dosing). Slavsky et al. (2025, Pharmaceutics) demonstrated that mechanistic static models predict CYP3A4 induction accurately but systematically fail for CYP2C induction because they cannot account for the fractional contribution of each CYP2C isoform to total clearance of a victim drug that is metabolized by multiple enzymes. PBPK (Simcyp V23.1) resolved this by simultaneously modeling all five CYP induction processes and their time-dependent enzyme abundance changes, producing DDI predictions within 2-fold of observed clinical data. Yin et al. (2024) independently developed a GastroPlus parent-metabolite PBPK model of carbamazepine and its active epoxide metabolite, capturing the non-linear PK driven by autoinduction and confirming that PBPK-predicted midazolam DDI (AUC ratio 0.49) matched observed data.
pH-mediated DDI. Acid-reducing agents (ARAs) — proton pump inhibitors (PPIs), H2-receptor antagonists (H2RAs), and antacids — elevate gastric pH from ~1.5 to 4-6, dramatically reducing the solubility and dissolution of weakly basic drugs (pKa 3-6). ICH M12 explicitly excludes absorption-mediated DDI from its scope, leaving this as a regulatory gap that PBPK is uniquely positioned to fill. The FDA has received 10 PBPK submissions assessing elevated gastric pH effects: 4 were confirmed by dedicated clinical DDI studies, and 5 compounds avoided dedicated studies based on PBPK results alone. The PPI (e.g., omeprazole 40 mg QD × 5 days) represents the worst-case scenario due to irreversible H+/K+-ATPase inhibition; if PBPK predicts no clinically significant DDI with a PPI, no ARA-related DDI study is needed.
Pharmacogenetics-DDI. Approximately 7% of Caucasians and 1-2% of East Asians are CYP2D6 poor metabolizers (PMs) — they have little to no functional CYP2D6 activity. For a drug metabolized 60% by CYP2D6 and 40% by CYP3A4, a CYP3A4 inhibitor produces minimal DDI in extensive metabolizers (the CYP2D6 pathway compensates) but potentially severe DDI in PMs (the CYP3A4 pathway is the only remaining route). PBPK virtual populations — simulated cohorts of individuals with defined CYP2D6/CYP2C19 genotype distributions — can predict the DDI magnitude in each phenotype subgroup separately. The caveat: EMA qualification of Simcyp is currently limited to Caucasian healthy subjects; pharmacogenetic subgroup predictions, while mechanistically sound, have not received separate regulatory qualification.
Metabolite-mediated DDI. ICH M12 requires evaluation of circulating metabolites as potential perpetrators when the metabolite represents ≥25% of parent AUC or ≥10% of total drug-related exposure. PBPK models handle this by building a separate model for the metabolite — with its own distribution volumes, clearance parameters, and CYP inhibition/induction data — linked to the parent model through the formation clearance (fm × Clint). The metabolite then acts as a second perpetrator in the DDI simulation, a scenario that no static model can accommodate. GLP-1 receptor agonists and gastric emptying represent an emerging complex scenario: long-acting GLP-1 RAs (semaglutide, dulaglutide) delay gastric emptying acutely but show tachyphylaxis with chronic dosing, while short-acting agents (exenatide, lixisenatide) maintain the gastric effect — PBPK captures the time-dependent absorption rate changes by modeling gastric emptying as a time-varying parameter linked to GLP-1 RA pharmacokinetics.
Regulatory Submission Best Practices: From PBPK Model to DDI Label
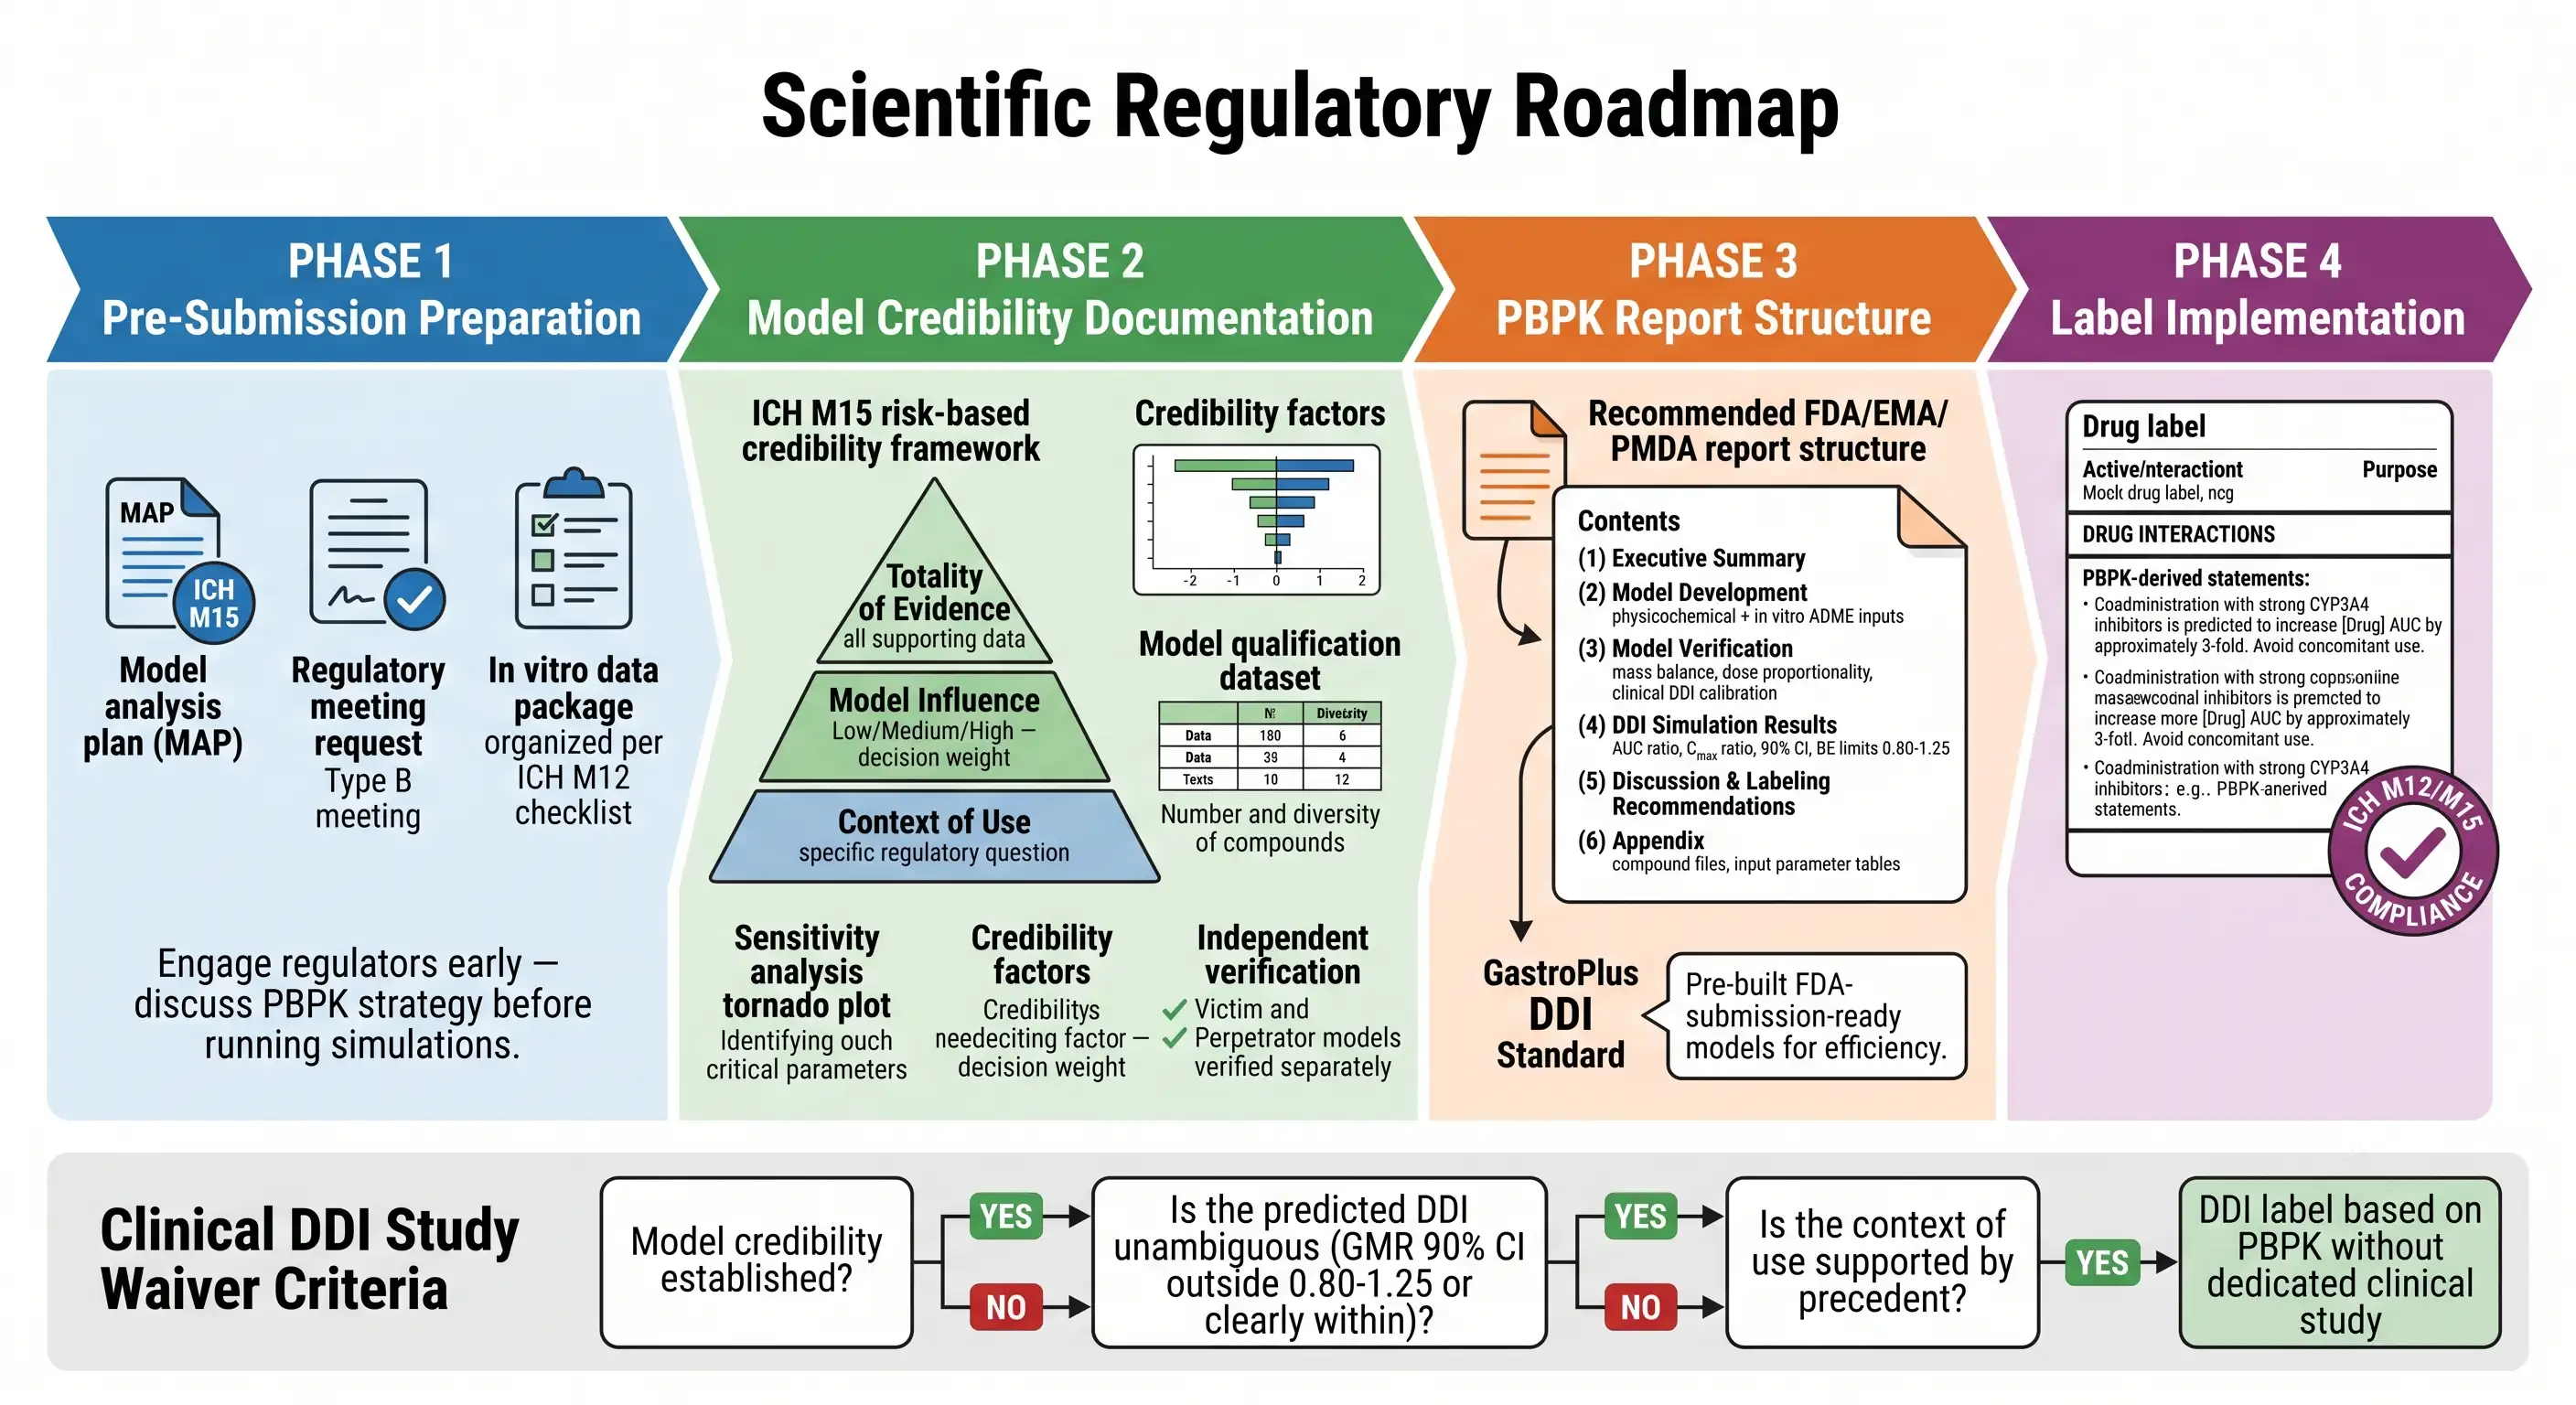 Figure 5: Regulatory Submission Best Practices — From PBPK Model to DDI Label
A PBPK model that predicts a DDI correctly but is documented incorrectly will be rejected by regulators — and the distinction between "correct" and "acceptable" is the ICH M15 credibility framework. The credibility framework is not a checklist; it is a risk-proportionate evidence standard. A PBPK model used to waive a clinical DDI study (High Model Influence) requires substantially more evidence than a model used to prioritize which clinical DDI studies to run (Low Model Influence).
The submission preparation follows four phases. Phase 1 — Pre-Submission Engagement: Prepare a Model Analysis Plan (MAP) documenting the planned modeling strategy, input parameters, verification plan, and intended context of use — and discuss it with regulators at a Type B meeting before running confirmatory simulations. The single most common regulatory complaint about PBPK submissions is that the model was built and verified without prior agreement on what constitutes sufficient verification. Phase 2 — Credibility Documentation: The ICH M15 framework requires documentation of three elements. Context of Use: the specific regulatory question the model addresses (e.g., "Predict the effect of ketoconazole 400 mg QD on [Drug] AUC and Cmax to inform labeling"). Model Influence: the weight the model evidence carries relative to other evidence — Low (exploratory, hypothesis-generating), Medium (supporting a dose recommendation alongside clinical data), or High (substituting for a clinical study). Model Risk: the consequence of an incorrect model-based decision — a model predicting a 50% DDI that is actually a 10% DDI (false positive) leads to unnecessary label restrictions; a model predicting a 10% DDI that is actually a 50% DDI (false negative) leads to patient harm. The totality of evidence includes sensitivity analysis results (tornado plot identifying critical parameters), the qualification dataset (number and chemical diversity of compounds used for model verification), and independent victim/perpetrator model verification.
Phase 3 — PBPK Report Structure. Regulatory PBPK reports for FDA/EMA/PMDA follow a standardized format: (1) Executive Summary — the regulatory question, model approach, and conclusion in one page; (2) Model Development — all input parameters with sources, IVIVE scaling factors, and justification for parameters not experimentally determined; (3) Model Verification — mass balance, dose proportionality, DDI calibration against clinical data (observed vs predicted AUC and Cmax ratios for each verifying DDI study, with the identity line and 0.8-1.25 boundary); (4) DDI Simulation Results — predicted AUC ratio, Cmax ratio, and 90% confidence intervals for each simulated DDI scenario; (5) Discussion — interpretation of results, model limitations, and labeling recommendations; (6) Appendix — compound files, complete input parameter tables, and sensitivity analysis figures. The GastroPlus DDI Standard Model Library can accelerate this process by providing pre-built, literature-verified models for common perpetrators that have already been accepted in prior FDA submissions.
Phase 4 — DDI Label Implementation. The criteria for translating PBPK predictions into labeling language: if the 90% CI of the predicted GMR falls entirely within 0.80-1.25 → "No clinically significant DDI — no dose adjustment required." If the 90% CI falls clearly outside 0.80-1.25 in either direction → the DDI magnitude drives the label recommendation (e.g., "Avoid concomitant use" for >5-fold AUC increase, "Consider dose reduction" for 2-5-fold increase). If the 90% CI straddles the 0.80-1.25 boundary → the prediction is not sufficiently precise for a labeling decision; a clinical DDI study or additional model refinement is warranted. The in vitro metabolic stability data that determines Clint — the starting clearance parameter in every PBPK model — must be generated under conditions that reflect the in vivo situation: substrate concentration at therapeutic levels (not 10 µM for a 10 nM drug), appropriate cofactor concentrations, and incubation times within the linear range of metabolite formation.
PBPK Modeling in Practice: A Step-by-Step DDI Prediction Walkthrough
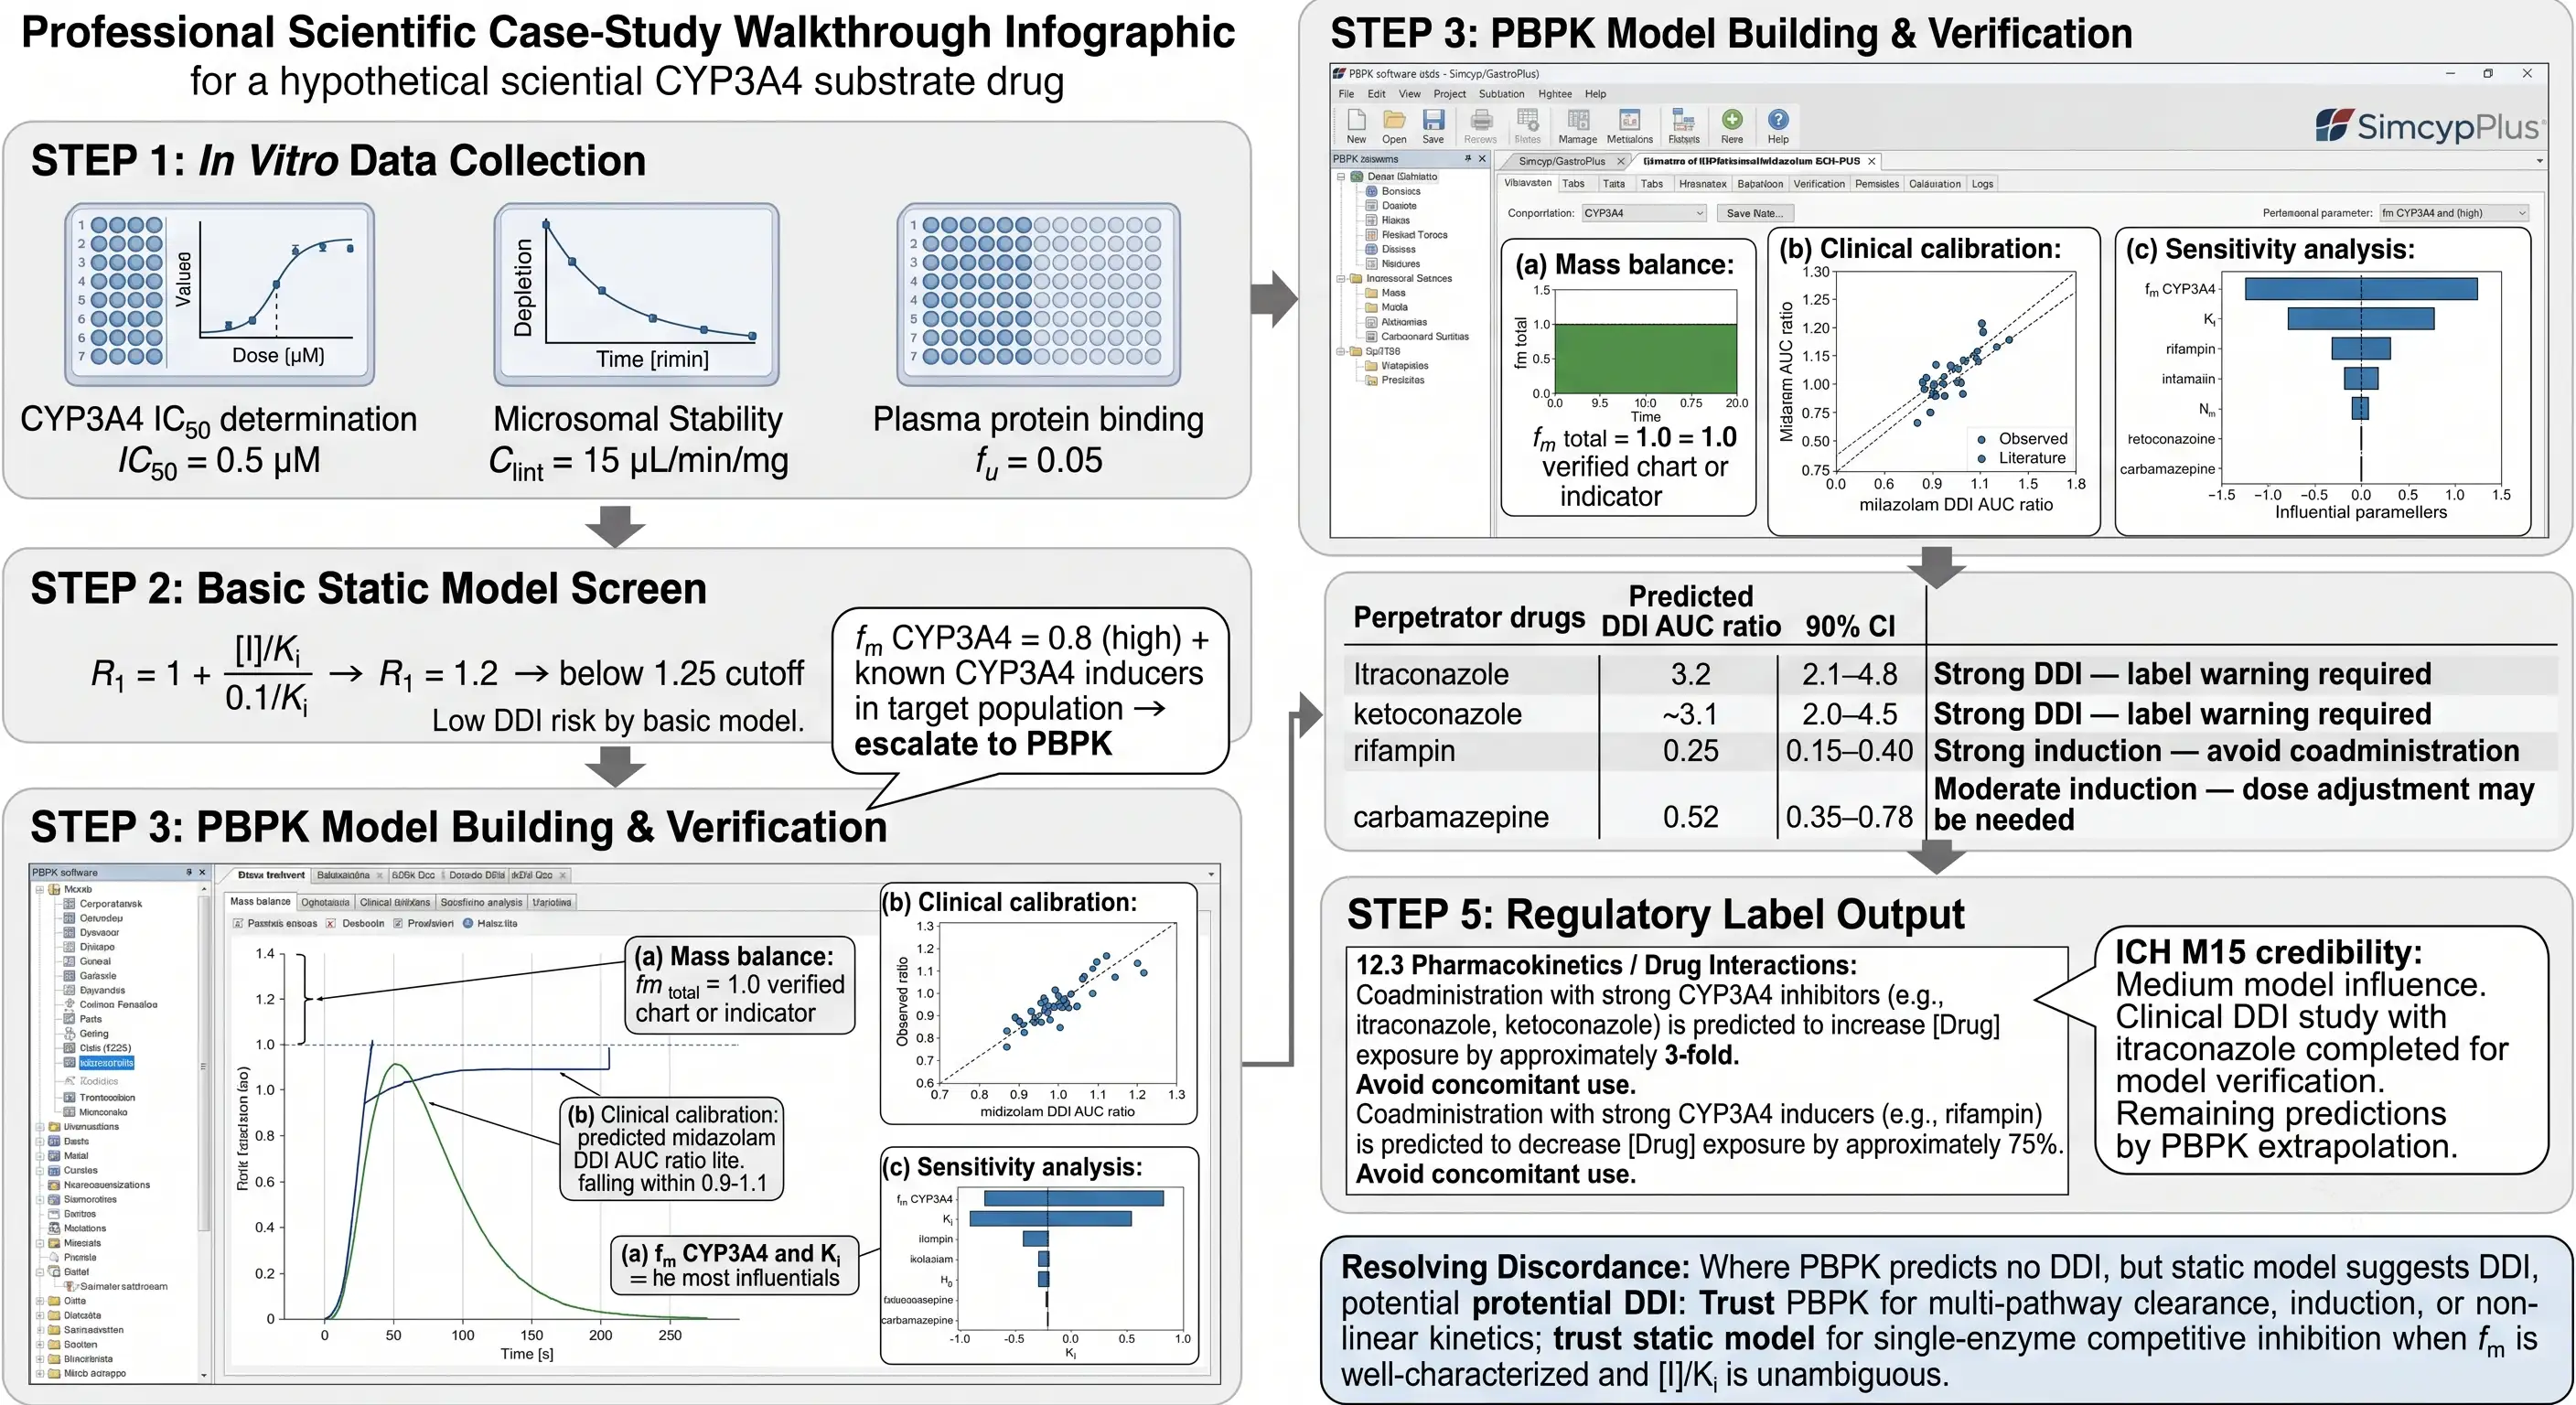 Figure 6: PBPK DDI Prediction in Practice — A Step-by-Step Walkthrough from In Vitro Data to Regulatory Label
The following walkthrough illustrates the PBPK DDI workflow for a hypothetical CYP3A4 substrate drug — a representative scenario that accounts for the majority of PBPK DDI submissions to the FDA.
Step 1 — In Vitro Data Collection. CYP3A4 IC50: 0.5 µM (determined with midazolam 1'-hydroxylation in HLM). Microsomal Clint: 15 µL/min/mg. fu: 0.05 (plasma), fu,mic: 0.25 (microsomal). Reaction phenotyping: fm,CYP3A4 = 0.8, fm,CYP2D6 = 0.15, renal = 0.05. No TDI (IC50 shift <1.5-fold). No CYP induction. B/P ratio: 0.65. pKa (base): 7.2. logP: 3.1.
Step 2 — Basic Static Model Screen. R1 = 1 + [I]/Ki = 1 + 0.1/0.5 = 1.2. Below the ICH M12 cutoff of 1.25 → "Low DDI risk by basic model." But fm,CYP3A4 = 0.8 (single-enzyme-dependent clearance) and the target population includes patients on CYP3A4 inhibitors and inducers → escalate to PBPK for definitive assessment.
Step 3 — PBPK Model Building and Verification. The model is built in Simcyp V25. Mass balance: fm,CYP3A4 (0.8) + fm,CYP2D6 (0.15) + renal (0.05) = 1.0 — verified. Clinical PK calibration: the model reproduces the observed clinical PK from the Phase I SAD study (Cmax and AUC within 0.9-1.1 of observed). Independent verification: literature DDI data for a structurally similar CYP3A4 substrate co-administered with ketoconazole is used to verify the CYP3A4 inhibition component — the PBPK model predicts the literature DDI AUC ratio within 0.9-1.1 of the observed value. Sensitivity analysis: a tornado plot identifies fm,CYP3A4 and Ki as the most influential parameters, and both are experimentally measured (not literature values).
Step 4 — DDI Simulation Results. The verified model is used to simulate four clinical DDI scenarios: (a) itraconazole (strong CYP3A4 inhibitor): predicted AUC ratio 3.2 (90% CI 2.1-4.8) → strong DDI; (b) ketoconazole (strong CYP3A4 inhibitor): predicted AUC ratio 3.5 (90% CI 2.3-5.2) → consistent with itraconazole prediction; (c) rifampin (strong CYP3A4 inducer): predicted AUC ratio 0.25 (90% CI 0.15-0.40) → strong induction; (d) carbamazepine (moderate CYP3A4 inducer): predicted AUC ratio 0.52 (90% CI 0.35-0.78) → moderate induction.
Step 5 — Regulatory Label Output. Because the model was verified with clinical DDI data and the predictions are unambiguous (90% CI clearly outside 0.80-1.25), the PBPK results translate directly to labeling: "Coadministration with strong CYP3A4 inhibitors (e.g., itraconazole, ketoconazole) is predicted to increase [Drug] exposure by approximately 3-fold. Avoid concomitant use. Coadministration with strong CYP3A4 inducers (e.g., rifampin) is predicted to decrease [Drug] exposure by approximately 75%. Avoid concomitant use. Coadministration with moderate CYP3A4 inducers (e.g., carbamazepine) is predicted to decrease [Drug] exposure by approximately 50%. Consider dose adjustment and monitor for reduced efficacy." The ICH M15 credibility assessment: Medium Model Influence — the model was verified with clinical DDI data, but the predictions for inducers were made by extrapolation and not independently verified with a clinical induction DDI study.
Resolving Discordance. When PBPK and the static model disagree — PBPK predicts no clinically significant DDI but the basic static model R1 > 1.25 — trust PBPK when the discrepancy is explained by: (a) multi-pathway clearance (the inhibitor affects only one of several elimination routes), (b) the inhibitor concentration at the enzyme site is substantially lower than the systemic concentration used in the static model (due to plasma protein binding or distribution kinetics), or (c) the victim drug has a wide therapeutic index and the predicted DDI magnitude, even if real, is clinically insignificant. Trust the static model when: (a) the DDI mechanism is simple competitive inhibition of a single, well-characterized clearance pathway, (b) fm and [I]/Ki are both well-characterized with narrow confidence intervals, and (c) the PBPK model has not been independently verified with clinical DDI data. The convergence of in vitro DDI data generation and PBPK modeling — from CYP inhibition and TDI assays through transporter interaction profiling — provides the complete input parameter package that determines whether a PBPK model is credible enough to substitute for a clinical study.
Frequently Asked Questions
When can PBPK modeling substitute for a clinical DDI study?
PBPK can substitute for a clinical DDI study when three conditions are met per ICH M12 Section 6 and ICH M15: (1) model credibility is established through independent verification of both victim and perpetrator drug models against clinical PK data, (2) the predicted DDI effect is unambiguous — the 90% confidence interval of the geometric mean ratio for AUC and Cmax either clearly falls within the 0.80-1.25 no-effect boundary or clearly falls outside it, and (3) the context of use is supported by regulatory precedent (e.g., CYP-mediated DDI with Simcyp, which received EMA qualification in 2025). The FDA has accepted PBPK-based DDI predictions in lieu of dedicated clinical studies for compounds where the model was verified with at least one clinical DDI study (typically a strong CYP inhibitor or inducer as the calibrator), and the remaining predictions were made by extrapolation. The ICH M15 framework provides a risk-based structure for justifying this substitution: the higher the model influence (weight of the model evidence in the regulatory decision), the more rigorous the credibility documentation must be.
What is the difference between the basic static model, mechanistic static model, and full PBPK model for DDI prediction?
The basic static model (Tier 1) uses the simple equation R1 = 1 + [I]/Ki, where [I] is the estimated inhibitor concentration at the enzyme site and Ki is the in vitro inhibition constant. It assumes worst-case steady-state conditions and provides a conservative initial screen — if R1 < 1.25 (ICH M12 cutoff), no further DDI investigation is needed. The mechanistic static model (Tier 2) incorporates the fraction metabolized (fm) by each CYP enzyme, intestinal availability (Fg), and metabolite contributions — it provides a more realistic assessment but still assumes steady-state inhibitor concentrations. The full PBPK model (Tier 3) simulates dynamic concentration-time profiles at the enzyme/transporter site in each organ compartment, capturing non-linear kinetics, autoinduction, multi-enzyme contributions, and transporter-enzyme interplay. PBPK is the only tier eligible for clinical DDI study waiver when model credibility is established. The decision of which tier to use depends on the drug's properties: single-enzyme reversible inhibition with well-characterized fm → mechanistic static may suffice; TDI, induction, multi-enzyme, or transporter involvement → PBPK is required.
What are the most common reasons FDA and EMA reject PBPK models in DDI submissions?
Paul et al. (2025, Clin Pharmacol Ther) analyzed EMA marketing authorization applications and identified the top five rejection categories (ranked by frequency): (1) lack of relevant data to assess predictive performance (15 cases) — the qualification dataset did not include DDI studies with sufficiently similar drugs; (2) concerns around PBPK model structure (14 cases) — failure to incorporate mechanisms such as autoinhibition, intestinal enzyme activity, or relevant transporters; (3) insufficient justification of key assumptions (12 cases) — input parameters (fm, Ki, enzyme abundance) sourced from literature without experimental validation; (4) poor prediction of clinical data (11 cases) — predicted AUC or Cmax ratios fell outside acceptable bounds; (5) insufficient number of compounds in the qualification dataset (7 cases). Li, Sun & Zhang (2025, Pharmaceutics) classified FDA-reviewed models as Adequate, Adequate with Limitations, or Inadequate — the Inadequate models (e.g., acoramidis, itovebi) had unverified single Ki values with 10× sensitivity analysis variation and curve-fitted clearance parameters that violated mechanistic modeling principles.
Which PBPK platforms are accepted by FDA and EMA for DDI submissions?
Simcyp Simulator (Certara) is the only PBPK platform with formal EMA qualification for CYP-mediated DDI predictions — the CHMP qualification opinion was adopted in July 2025, covering CYP1A2, 2C8, 2C9, 2C19, 2D6, and 3A4/5 for competitive and mechanism-based inhibition. Simcyp has contributed to over 120 FDA-approved novel drugs and holds approximately 80% of the PBPK market share among FDA submissions. GastroPlus (Simulations Plus) has also been used in numerous successful FDA submissions — the GastroPlus DDI Standard Model Library provides pre-built, verified victim and perpetrator models for submission efficiency, and GastroPlus has been accepted for DDI, pediatrics, organ impairment, food effect, and virtual bioequivalence applications. PK-Sim (Open Systems Pharmacology) is an open-source alternative used primarily in academic and early-discovery settings. The ICH M15 guideline establishes a platform-agnostic credibility framework — the platform matters less than the rigor of model construction, verification, and documentation.
How does PBPK handle complex DDI scenarios that static models cannot?
PBPK handles five categories of complex DDI that static models cannot adequately address. (1) Multi-enzyme induction: carbamazepine simultaneously induces CYP3A4, 2C8, 2C9, and 2C19 — Slavsky et al. (2025) demonstrated that PBPK (Simcyp) outperformed mechanistic static models for CYP2C induction DDI because PBPK captures the fm contributions of each enzyme to total clearance. (2) Autoinduction: drugs that induce their own metabolism (e.g., carbamazepine, rifampin) require dynamic enzyme abundance changes over time — only PBPK captures this temporal dimension. (3) pH-mediated DDI: acid-reducing agents elevate gastric pH, reducing solubility and absorption of weak base drugs — FDA has received 10 PBPK submissions in this area, with 5 compounds avoiding dedicated clinical studies based on PBPK results alone. (4) Transporter-enzyme interplay: a perpetrator that inhibits both OATP1B-mediated hepatic uptake and CYP3A4-mediated metabolism produces a net DDI effect that is not simply additive — PBPK captures the spatial and kinetic components. (5) Pharmacogenetics-DDI: CYP2D6 or CYP2C19 poor metabolizers have reduced metabolic capacity through the affected pathway, making them more susceptible to inhibition of alternative pathways — PBPK virtual populations can simulate each phenotype subgroup separately, though this application has not received separate EMA qualification.
What in vitro data does the DMPK scientist need to provide for a PBPK DDI model?
The minimum data package for building a PBPK DDI model includes: physicochemical properties — logP, pKa (single or multiple), and pH-dependent solubility profile (pH 1.0-6.8); protein binding — fraction unbound in plasma (fu) and microsomal incubation (fu,mic), determined by equilibrium dialysis or ultrafiltration; blood-to-plasma ratio (B/P); metabolic stability — intrinsic clearance (Clint) in human liver microsomes or hepatocytes, from substrate depletion curves; reaction phenotyping — fraction metabolized (fm) by each CYP enzyme, determined using selective chemical inhibitors or recombinant CYP enzymes; CYP inhibition — reversible IC50 or Ki values for CYP1A2, 2B6, 2C8, 2C9, 2C19, 2D6, and 3A4 (ICH M12 panel); time-dependent inhibition — kinact and KI for mechanism-based inactivators, determined by the IC50 shift assay with 30-minute NADPH pre-incubation; CYP induction — EC50 and Emax for CYP1A2, 2B6, and 3A4, from 3-day cultured human hepatocyte incubation at multiple concentrations; and transporter data — substrate specificity and inhibition (IC50/Ki) for P-gp, BCRP, OATP1B1/1B3, OAT1/3, OCT2, MATE1/2K if transporter involvement is suspected. Each parameter should be determined under consistent experimental conditions and IVIVE scaling factors documented for model input.
References
- ICH M15: General Principles for Model-Informed Drug Development. International Council for Harmonisation; Step 4 Final Guideline, adopted 29 January 2026. https://database.ich.org/sites/default/files/ICH_M15_Step4_Final_Guideline_2026_0129.pdf
- ICH M12: Drug Interaction Studies. International Council for Harmonisation; Final Guideline, 2024. https://database.ich.org/sites/default/files/ICH_M12_Step4_Guideline_2024_0521.pdf
- Li Y, Sun H, Zhang Z. The evolution and future directions of PBPK modeling in FDA regulatory review. Pharmaceutics. 2025;17(11):1413. DOI: 10.3390/pharmaceutics17111413
- Slavsky M, Karve AS, Hariparsad N. Physiologically based pharmacokinetic modeling to assess perpetrator and victim cytochrome P450 2C induction risk. Pharmaceutics. 2025;17(8):1085. DOI: 10.3390/pharmaceutics17081085
- Yin X, Cicali B, Rodriguez-Vera L, Lukacova V, Cristofoletti R, Schmidt S. Applying physiologically based pharmacokinetic modeling to interpret carbamazepine's nonlinear pharmacokinetics and its induction potential on cytochrome P450 3A4 and cytochrome P450 2C9 enzymes. Pharmaceutics. 2024;16(6):737. DOI: 10.3390/pharmaceutics16060737
- Paul P, Colin PJ, Musuamba Tshinanu F, Versantvoort C, Manolis E, Blake K. Current use of physiologically based pharmacokinetic modeling in new medicinal product approvals at EMA. Clin Pharmacol Ther. 2025;117(3):808-817. DOI: 10.1002/cpt.3525
- Certara. Simcyp Simulator Version 25: Streamline Drug Development with Regulatory-Compliant PBPK. March 2026. Certara Inc. https://www.certara.com/simcyp-simulator/
- Zhang X, Fraczkiewicz G, Lukacova V. PBPK modeling addresses oral absorption-mediated drug interactions. Drug Metab Pharmacokinet. 2026;67:101523. DOI: 10.1016/j.dmpk.2026.101523
- European Medicines Agency. Qualification Opinion on Simcyp Simulator V19 for CYP-Mediated Drug-Drug Interactions. CHMP; adopted 24 July 2025. https://www.ema.europa.eu/system/files/documents/other/qualification-opinion-simcyp-simulator-en.pdf
Related Services


