Why Transporter DDI Matters: Clinical Cases and the ICH M12 Mandate
If CYP enzymes are the liver's chemical processing plant, drug transporters are the loading docks, distribution network, and waste disposal system — and inhibiting them can be just as clinically catastrophic as inhibiting CYP3A4. The most famous transporter-mediated DDI is the cyclosporine-statin interaction: cyclosporine inhibits the hepatic uptake transporter OATP1B1, preventing statins from entering hepatocytes for metabolism and biliary excretion. The result is a 5- to 20-fold increase in systemic statin exposure, producing rhabdomyolysis — muscle breakdown so severe it causes acute renal failure. This DDI was not predicted by CYP inhibition data alone, because the interaction occurs at the transporter level before the drug ever reaches a CYP enzyme. Transporter-mediated DDI is the fastest-growing segment of DDI assessment precisely because these interactions are mechanistically distinct from CYP-mediated interactions and require their own experimental framework.
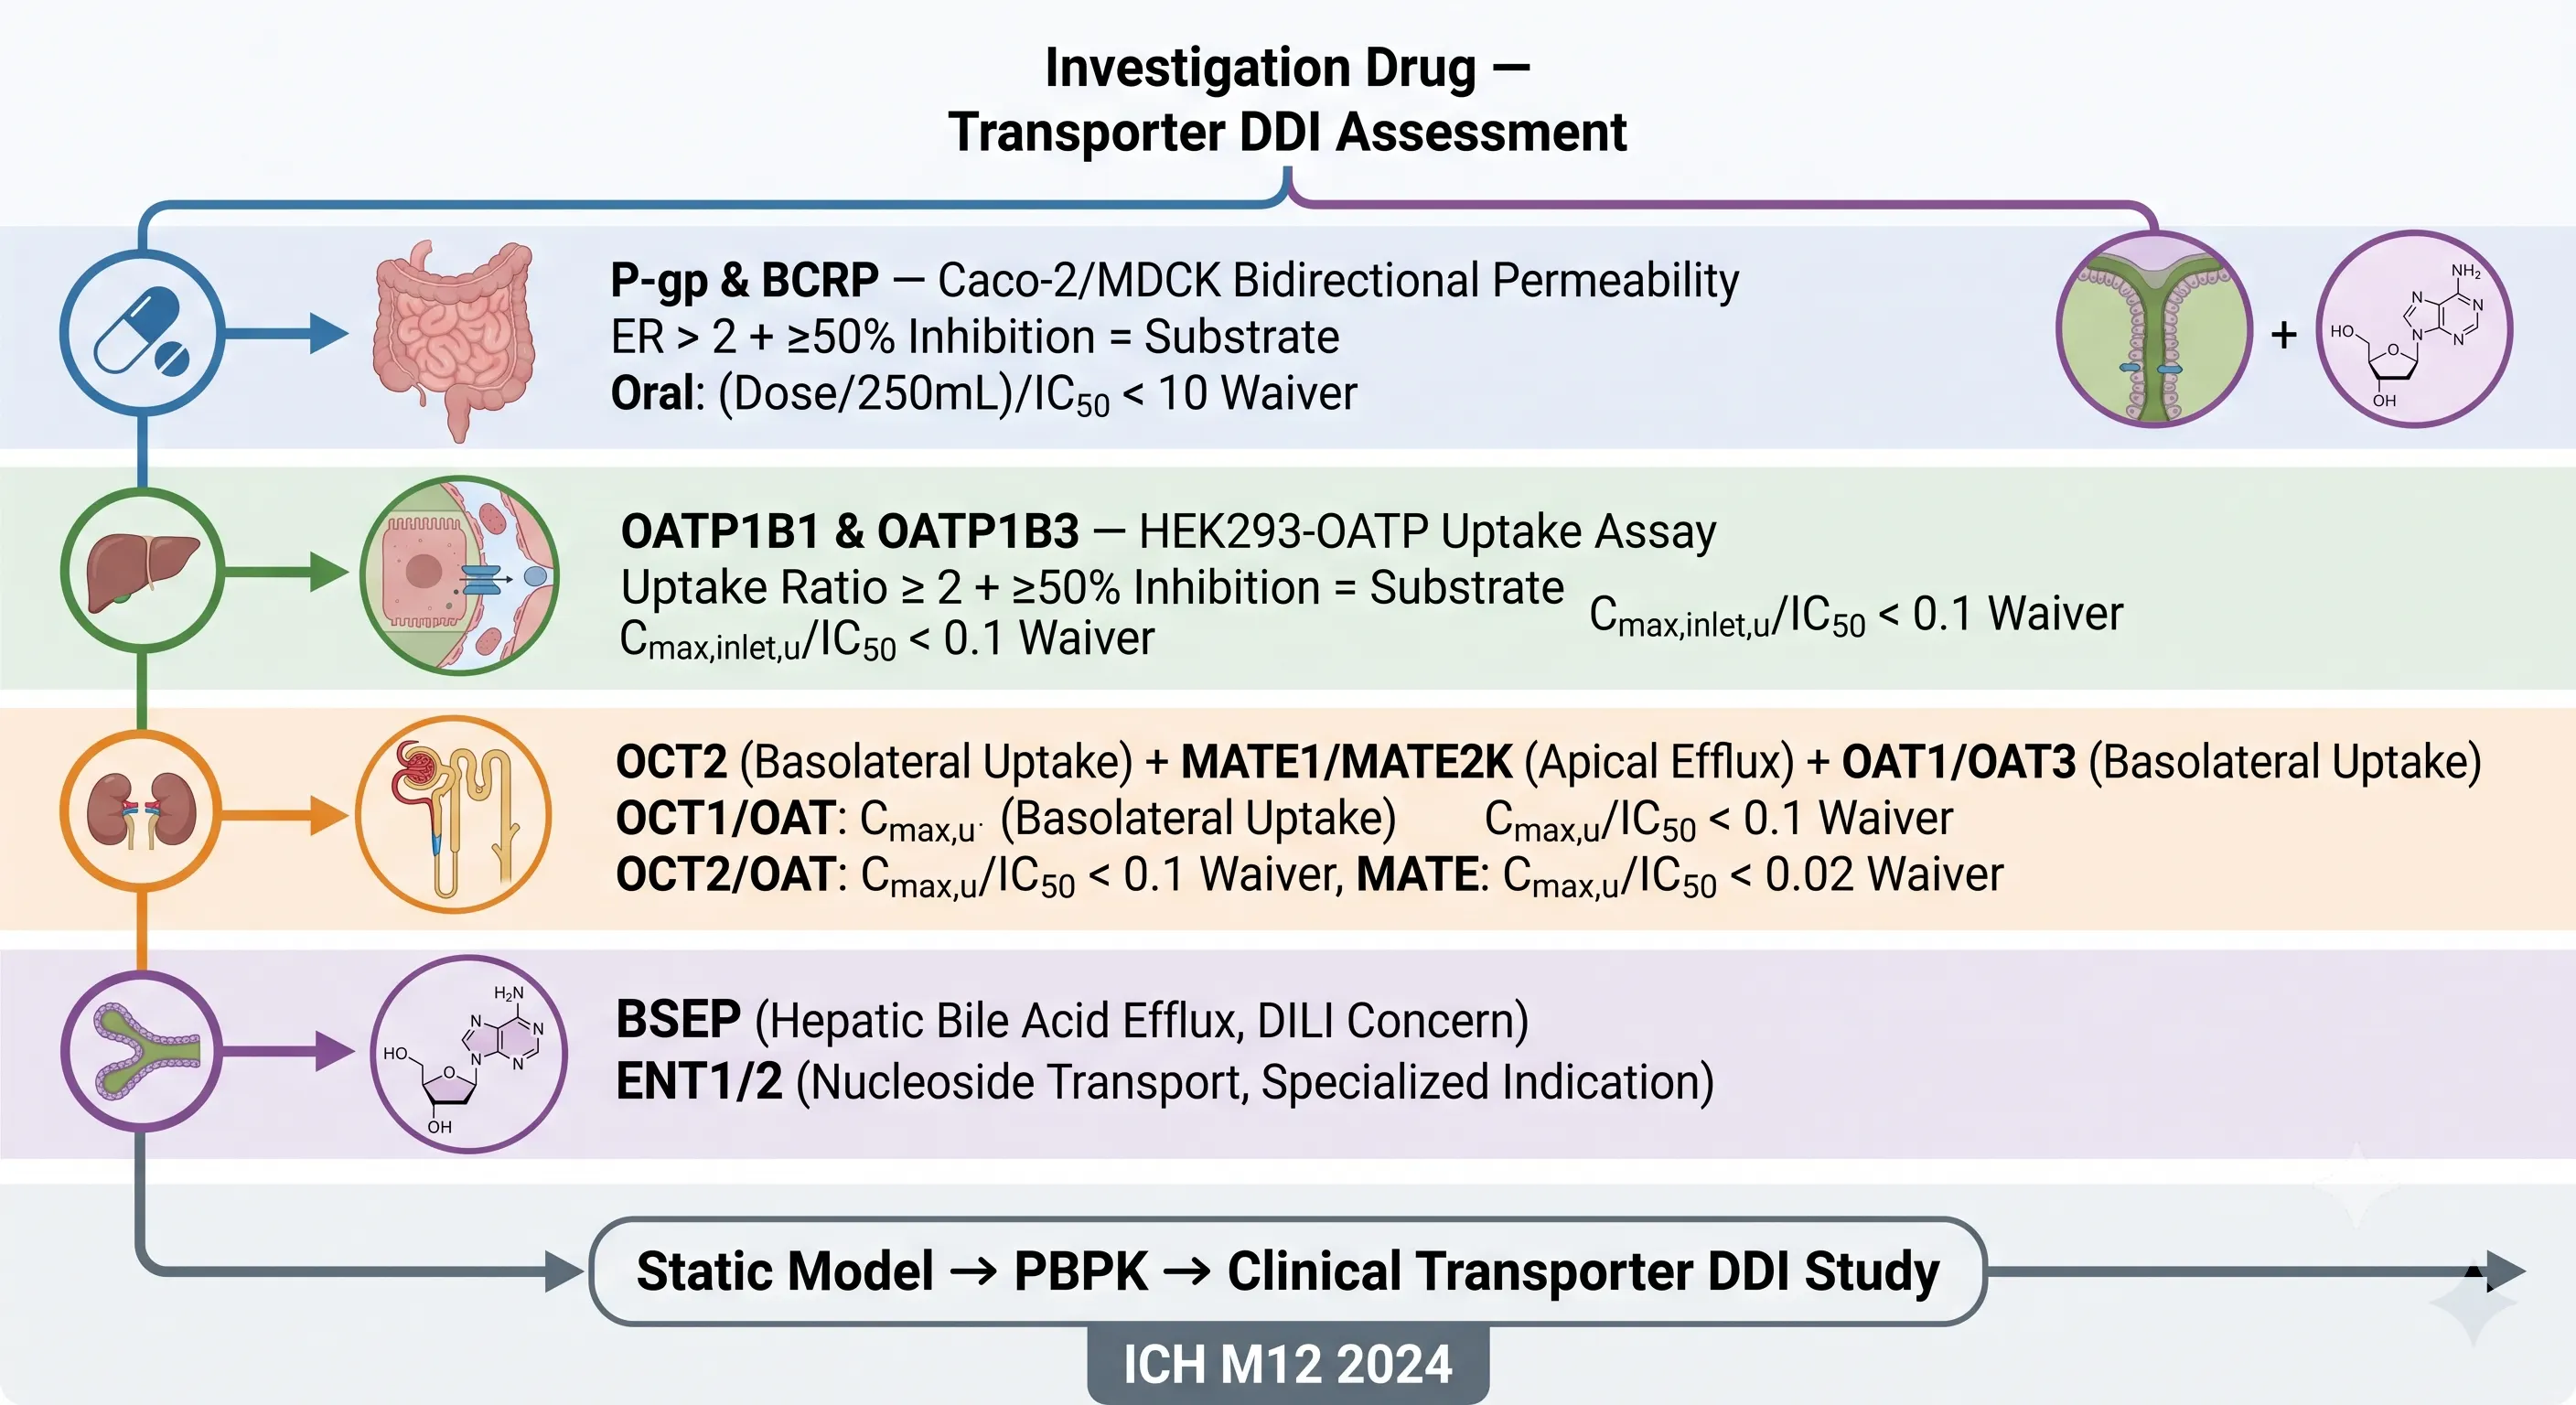 Figure 1: The ICH M12 Transporter DDI Decision Framework — When to Test Which Transporter
ICH M12 (2024) expands the transporter assessment requirements substantially beyond previous regional guidances. Where FDA 2012 and EMA 2013 each had their own (inconsistent) transporter panels and cutoff criteria, ICH M12 mandates evaluation of nine transporters across three organ systems: P-gp (ABCB1) and BCRP (ABCG2) at the intestine, blood-brain barrier, and liver; OATP1B1 and OATP1B3 at the liver sinusoidal membrane; OCT2, MATE1, MATE2K, OAT1, and OAT3 at the renal proximal tubule; plus BSEP at the hepatic canalicular membrane and ENT1/2 in specialized indications. The framework distinguishes between substrate assessment — "is my drug transported by this protein, making it a potential DDI victim?" — and inhibition assessment — "does my drug inhibit this transporter, making it a potential DDI perpetrator?" — with different experimental approaches, cutoff criteria, and clinical decision algorithms for each. This article provides the practical guide to navigating the complete ICH M12 transporter DDI framework, from in vitro assay design through cutoff interpretation to clinical prediction.
The complementary relationship between transporter and enzyme DDI assessment is built into the ICH M12 structure itself. Where CYP-mediated DDI assessment addresses the metabolic clearance dimension of drug interactions, transporter assessment addresses the distributional dimension — a drug that is not a CYP substrate can still be a transporter victim, and the clinical consequences can be equally severe. The two assessment frameworks share the same tiered clinical prediction algorithm (Basic Model → Mechanistic Static Model → PBPK) but use transporter-specific cutoff criteria that reflect the unique physiology of each transporter's tissue localization and the clinical consequences of its inhibition.
The ICH M12 Transporter Framework: When to Test Which Transporter
ICH M12 organizes transporter assessment around a simple question: does the drug reach the anatomical site where this transporter is expressed at concentrations sufficient to produce a clinically meaningful interaction? The answer determines whether a given transporter must be evaluated for substrate liability, inhibition liability, both, or neither. The decision framework is organ-system-based and risk-stratified, not a blanket panel applied to every compound.
P-gp and BCRP (intestinal, hepatic, BBB) — Always evaluate for inhibition; substrate evaluation depends on route and disposition. For orally administered drugs, substrate liability assessment is mandatory because P-gp and BCRP at the intestinal epithelium can limit oral absorption and are themselves subject to inhibition by co-administered drugs. The substrate assessment uses bidirectional permeability across Caco-2 or MDCK cell monolayers, with an efflux ratio (Papp B→A / Papp A→B) ≥ 2 indicating potential substrate status. This must be confirmed by demonstrating that a selective inhibitor (tariquidar for P-gp, Ko143 for BCRP) reduces the ER by ≥50%. For parenteral drugs, substrate assessment is only required when biliary or active renal secretion is a major elimination pathway. For all drugs — regardless of route — the inhibition assessment uses two different cutoff scenarios: for oral drugs where intestinal P-gp/BCRP inhibition is the primary concern, (Dose/250mL)/IC50 < 10 provides a clinical study waiver. For parenteral drugs or post-absorption metabolites, Cmax,u/IC50 < 0.02 is the relevant cutoff.
OATP1B1 and OATP1B3 (hepatic uptake) — Evaluate substrate liability when hepatic elimination ≥ 25% of total clearance. These transporters are the primary determinant of hepatic drug extraction for a broad range of anionic drugs. If the liver accounts for less than 25% of total clearance — because renal excretion dominates or the drug is cleared by plasma esterases — OATP-mediated DDI is mechanistically unlikely and substrate assessment can be waived. The in vitro model uses HEK293 cells stably overexpressing human OATP1B1 or OATP1B3, with uptake measured against empty vector control cells. A ≥2-fold increase in uptake rate in the transporter-expressing cells, with ≥50% reduction by rifampicin (a pan-OATP inhibitor), confirms substrate status. The inhibition cutoff for OATP1B1/1B3 uses Cmax,inlet,u — the estimated unbound drug concentration at the hepatic portal inlet, which accounts for the contribution of oral absorption to liver exposure — with Cmax,inlet,u/IC50 < 0.1 providing a clinical study waiver.
OCT2, MATE1, MATE2K, OAT1, OAT3 (renal) — Evaluate when active renal secretion ≥ 25% of systemic clearance. The renal transporter assessment is triggered when the renal clearance of the drug substantially exceeds the filtration clearance (GFR × fu,p), indicating net active secretion. OCT2 mediates basolateral uptake of cationic drugs (metformin, cisplatin, varenicline) from blood into the proximal tubule cell; MATE1 and MATE2K mediate apical efflux from the tubule cell into the urine. OAT1 and OAT3 mediate basolateral uptake of anionic drugs (tenofovir, cidofovir, furosemide) into the proximal tubule cell. The inhibition cutoffs reflect the differing clinical consequences: OCT2 and OAT1/3 use Cmax,u/IC50 < 0.1, while MATE1/2K uses the stricter Cmax,u/IC50 < 0.02 — the most conservative cutoff in the ICH M12 transporter framework, reflecting the risk of intracellular drug accumulation and nephrotoxicity when MATE-mediated efflux is blocked.
BSEP, ENT1, ENT2 (specialized) — Evaluate only in specific contexts. BSEP (ABCB11), the bile salt export pump at the hepatic canalicular membrane, is not evaluated as a routine DDI target. Instead, BSEP inhibition is assessed as part of the drug-induced liver injury (DILI) risk evaluation — potent BSEP inhibition by drugs like troglitazone and bosentan has been linked to cholestatic hepatotoxicity, and ICH M12 mentions BSEP in the context of hepatotoxicity risk rather than pharmacokinetic DDI. ENT1 and ENT2 (equilibrative nucleoside transporters) are evaluated only when the drug is a nucleoside analog (e.g., gemcitabine, cytarabine, ribavirin) where ENT-mediated cellular uptake is a rate-determining step in drug distribution or for drugs where nucleoside transport interaction is mechanistically plausible.
Efflux Transporters: P-gp (ABCB1) and BCRP (ABCG2) — Caco-2 and MDCK Bidirectional Models
P-gp and BCRP are the gatekeepers of drug disposition. They sit at every major barrier between blood and tissue — the intestinal lumen, the brain capillary endothelium, the placental syncytiotrophoblast, and the bile canaliculus — where they actively pump a structurally diverse array of drugs back into the lumen or blood, limiting absorption and tissue penetration. A drug that is a P-gp or BCRP substrate may have low oral bioavailability despite good passive permeability, may be excluded from the CNS despite favorable logP, and may have its systemic exposure dramatically increased when a co-administered P-gp/BCRP inhibitor blocks these efflux pumps.
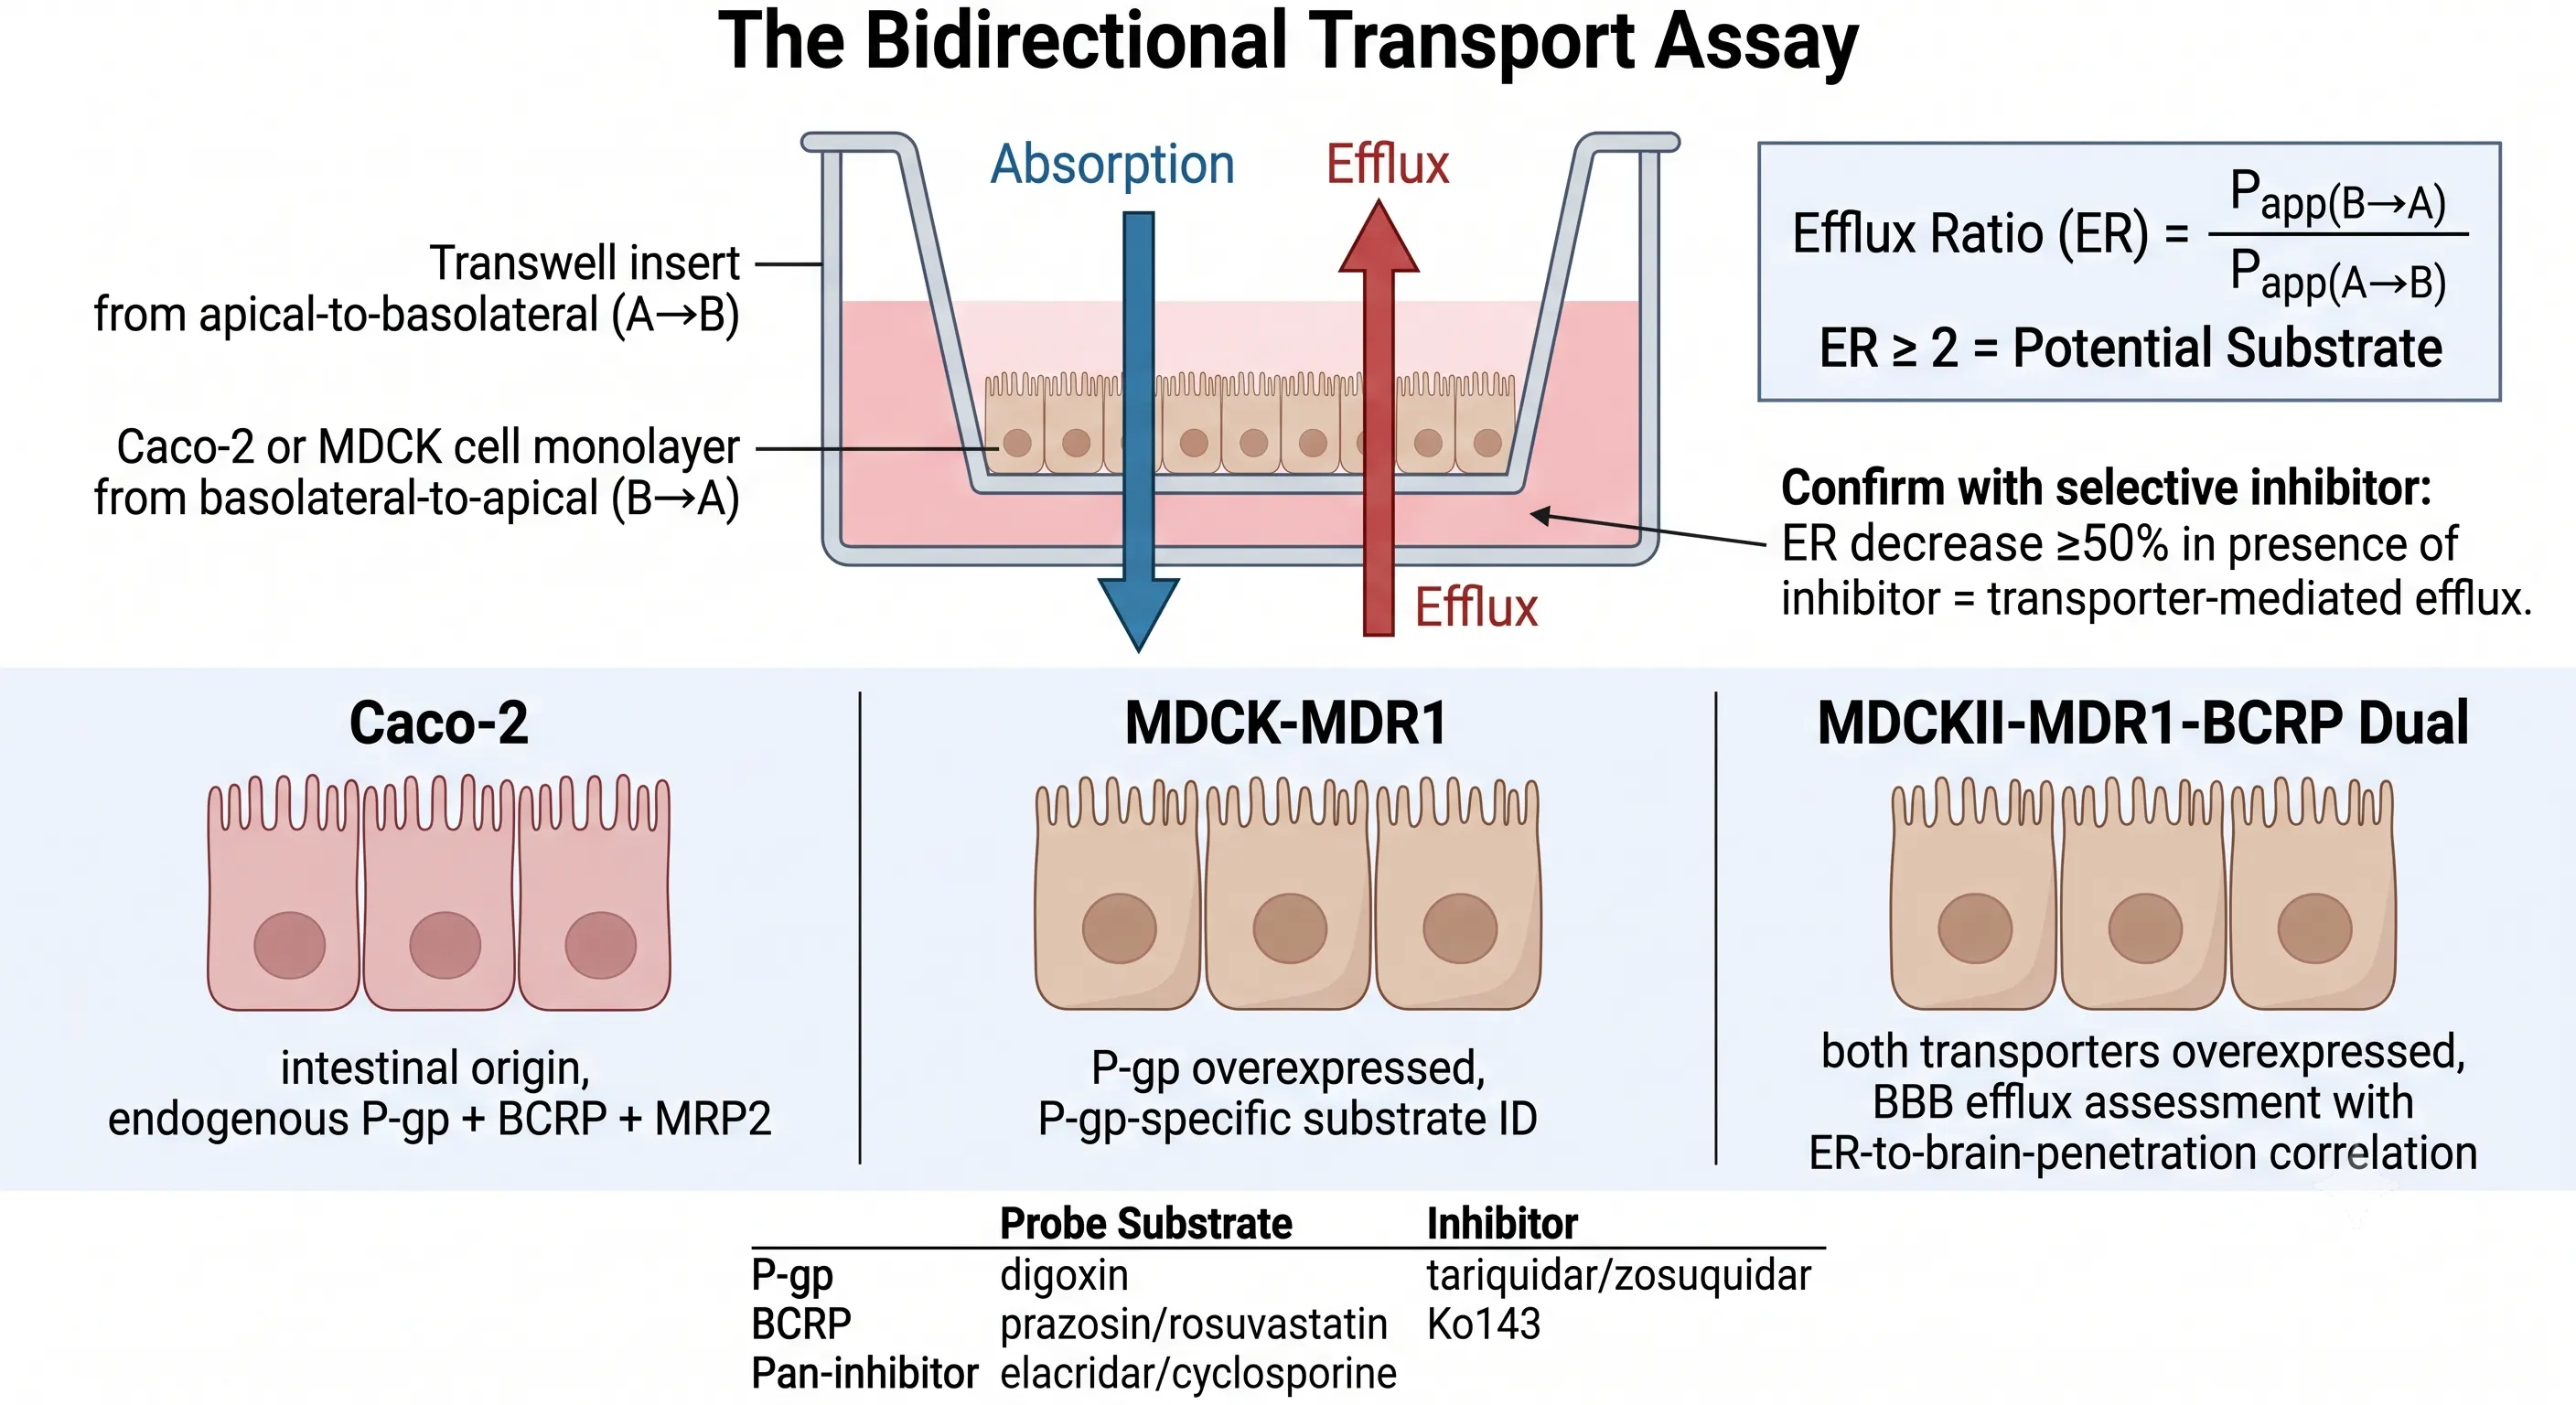 Figure 2: Efflux Transporter Assays — P-gp (ABCB1) and BCRP (ABCG2) Bidirectional Permeability Models
The bidirectional permeability assay is the workhorse of P-gp and BCRP assessment. A monolayer of Caco-2 cells (which endogenously express P-gp, BCRP, and MRP2) or MDCK cells engineered to overexpress individual human transporters is grown on a permeable Transwell membrane to confluence, forming a polarized epithelium with tight junctions (TEER > 350 Ω·cm²). The test compound is added to the donor compartment — apical (A) for the A→B direction, basolateral (B) for the B→A direction — and its appearance in the receiver compartment is measured over 2 hours at 37°C. The apparent permeability (Papp) in each direction is calculated from the linear rate of compound appearance in the receiver compartment, and the efflux ratio is ER = Papp(B→A) / Papp(A→B). An ER ≥ 2 flags the compound as a potential efflux transporter substrate.
However, an ER ≥ 2 alone is not sufficient to conclude substrate status — it must be corroborated by an inhibitor experiment. Compounds with high passive permeability and low solubility can produce artificially elevated ERs due to non-specific binding or concentration gradient effects that are not transporter-mediated. The confirmatory test repeats the bidirectional assay in the presence of a selective inhibitor at a concentration that blocks the transporter without affecting monolayer integrity. For P-gp, the preferred inhibitors are tariquidar (0.5 µM) or zosuquidar (LY335979, 3 µM), which are third-generation P-gp inhibitors with high selectivity at the concentrations used. For BCRP, Ko143 (1 µM) is the gold-standard selective inhibitor. A ≥50% reduction in ER in the presence of the inhibitor confirms that the efflux is transporter-mediated. If the ER remains elevated in the presence of both P-gp and BCRP inhibitors, other efflux transporters (MRP2, MDR3) or non-specific mechanisms may be responsible.
The cell model selection depends on the question being asked. Caco-2 cells, derived from human colon adenocarcinoma, express the full complement of endogenous intestinal transporters and most closely recapitulate the intestinal absorption environment — but their mixed transporter expression makes it impossible to attribute an ER to P-gp versus BCRP versus MRP2 without selective inhibitor deconvolution. MDCK-MDR1 and MDCK-BCRP single-transporter lines provide unambiguous isoform-specific substrate identification. The 2024 dual-transporter MDCKII-MDR1-BCRP cell line (Colclough et al., DMD 2024) simultaneously overexpresses both human P-gp and BCRP at physiologically relevant levels and has been validated against in vivo rat brain penetration data: compounds with Kp,uu ≥ 0.3 (high brain penetration) show ER ≤ 2 in this model, while compounds with Kp,uu ≤ 0.05 (BBB-excluded) show ER ≥ 20. This dual model provides a practical single-assay screen for both major BBB efflux transporters and is particularly valuable for CNS drug discovery programs.
Hepatic Uptake Transporters: OATP1B1, OATP1B3, and the Statin DDI Paradigm
OATP1B1 and OATP1B3 are the most clinically consequential drug transporters because they control the hepatic first-pass extraction of a remarkably broad range of widely prescribed drugs — and their inhibition produces some of the largest-magnitude DDIs in clinical pharmacology. Unlike P-gp and BCRP, which are efflux transporters, OATP1B1/1B3 are uptake transporters: they extract drugs from the portal blood into the hepatocyte, where the drug can then be metabolized by CYPs and excreted into bile. When OATP1B1 is inhibited, the drug cannot enter the hepatocyte efficiently. Metabolism and biliary excretion decrease not because the CYP enzyme is inhibited, but because the drug never reaches the CYP enzyme in the first place. The systemic plasma concentration rises, and the drug is redistributed to peripheral tissues — including muscle, in the case of statins — where it can produce concentration-dependent toxicity.
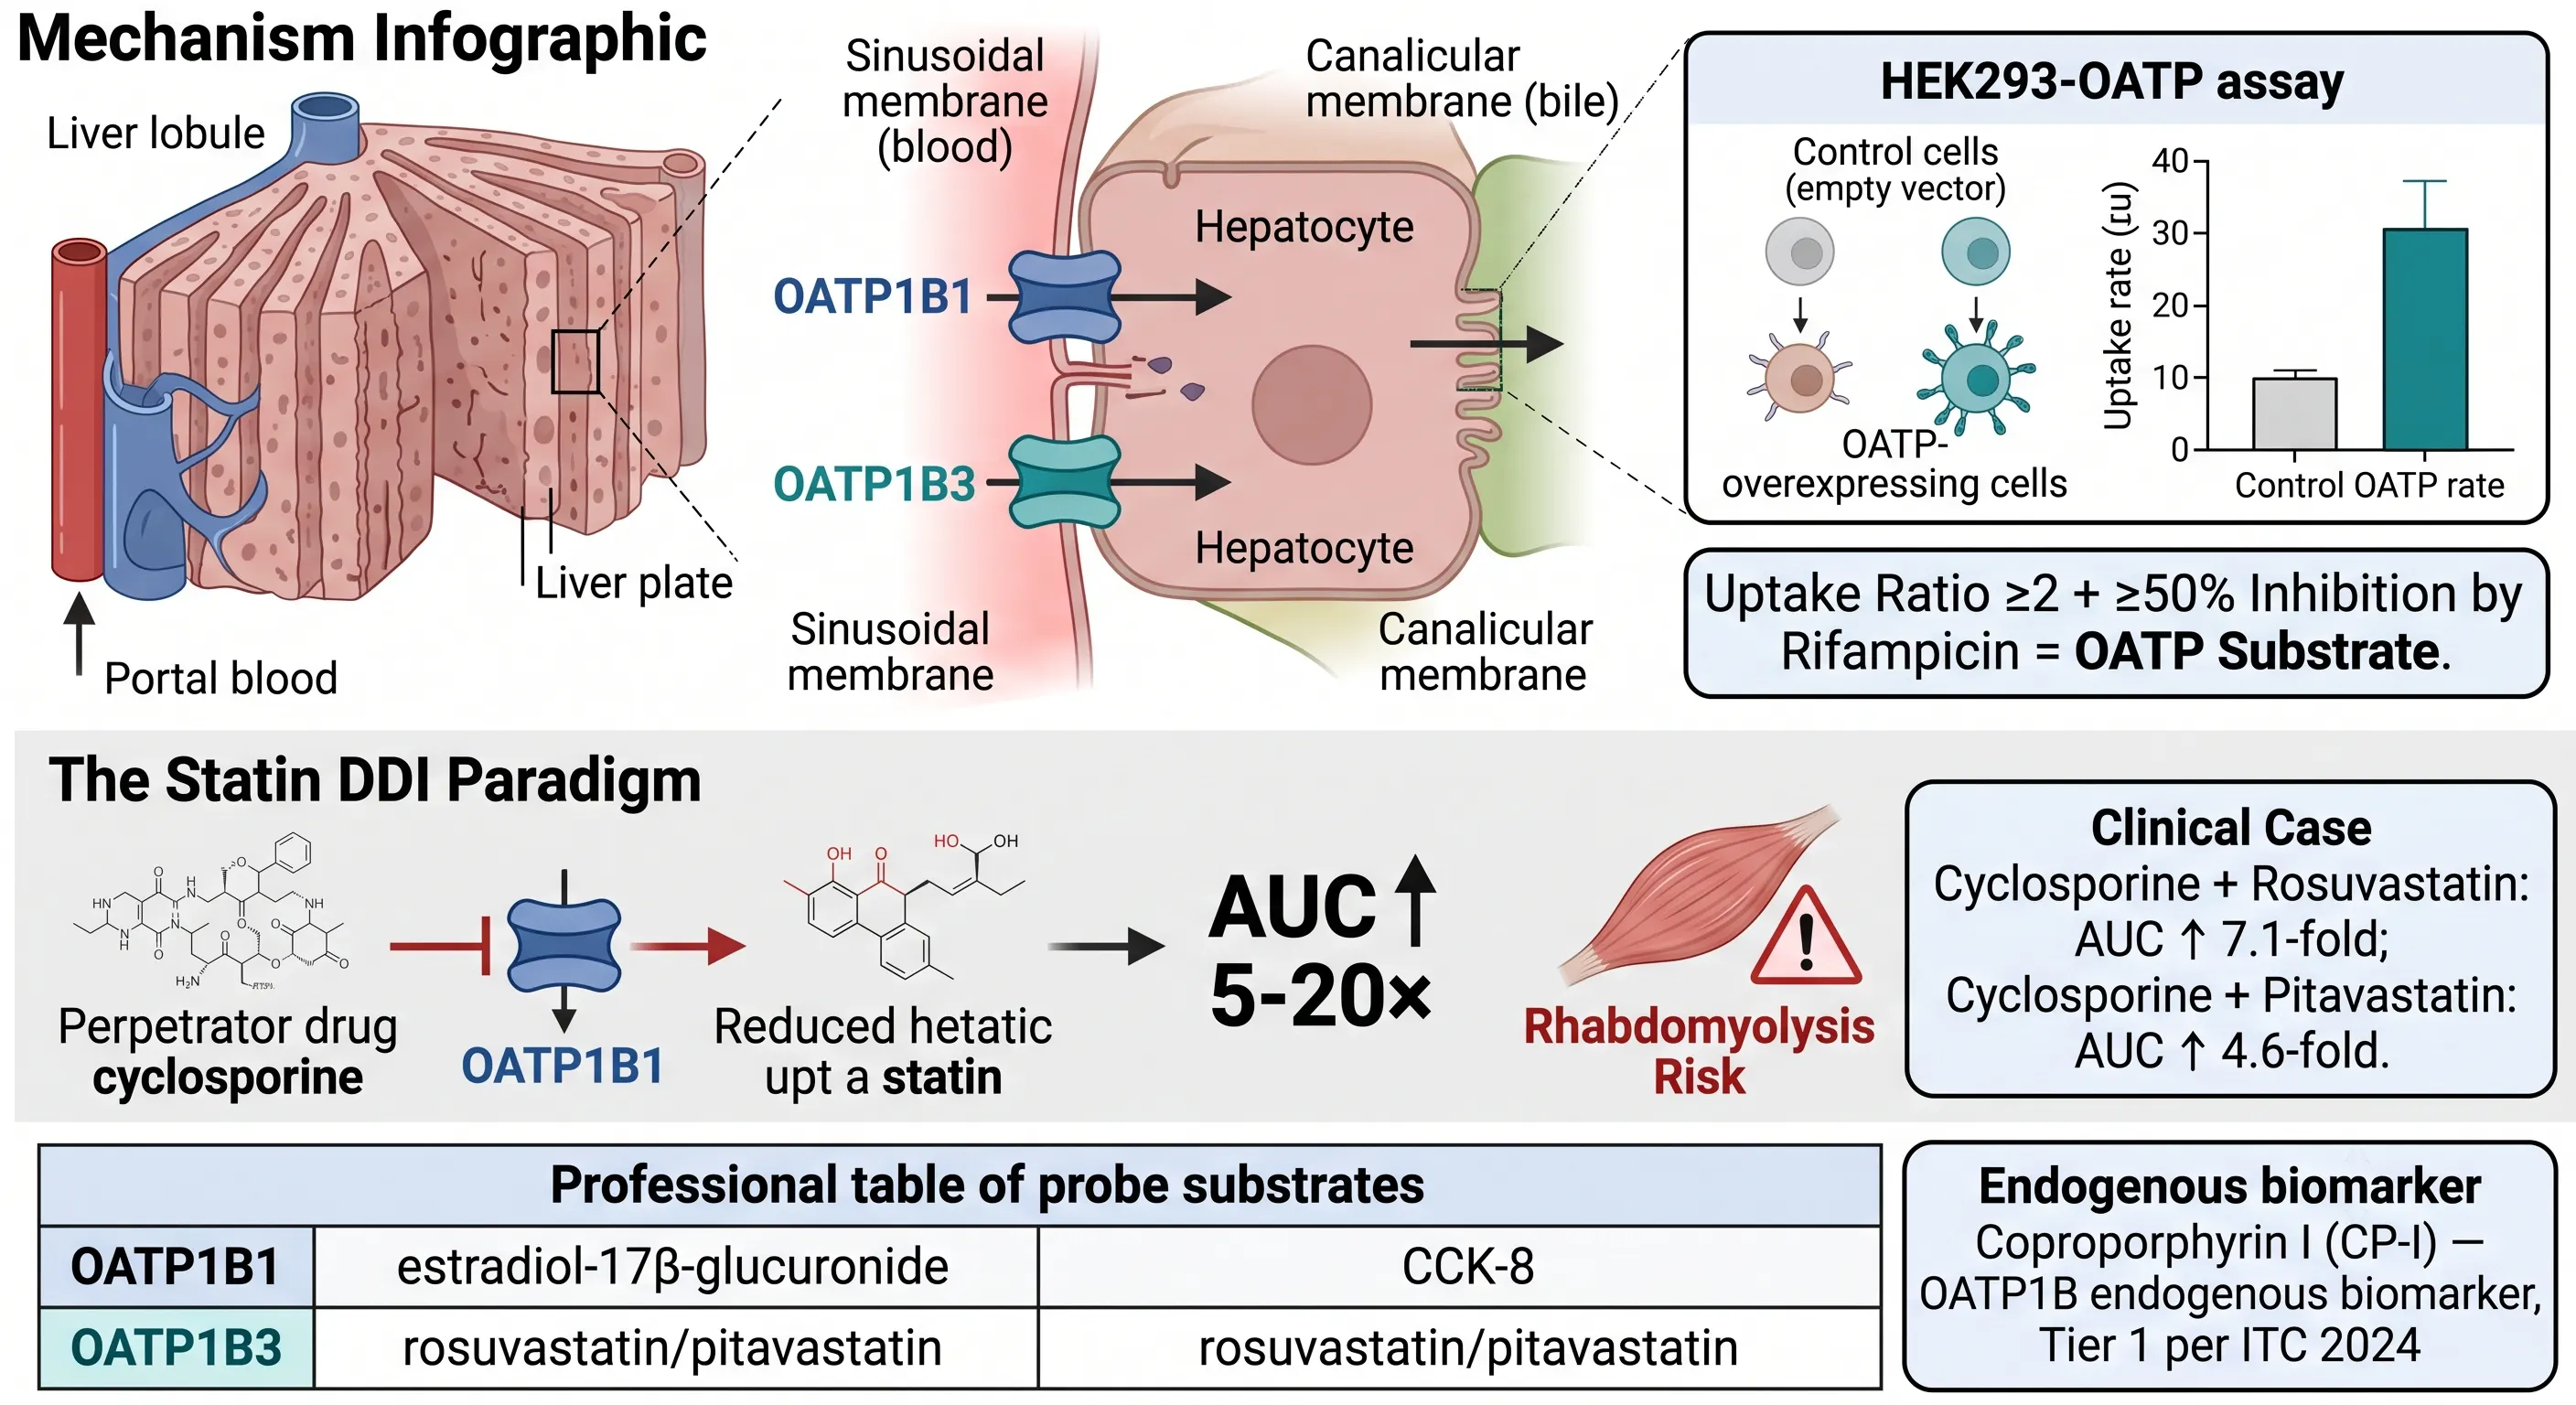 Figure 3: Hepatic Uptake Transporters — OATP1B1 and OATP1B3, the Statin DDI Paradigm
The in vitro OATP substrate assay uses HEK293 cells stably transfected with human OATP1B1 or OATP1B3 cDNA, compared to empty vector (mock) control cells. The test compound is incubated with both cell lines, and the intracellular accumulation is measured by LC-MS/MS after washing. A transport activity ratio (uptake in OATP cells / uptake in mock cells) ≥ 2, with ≥50% reduction by rifampicin (a dual OATP1B1/1B3 inhibitor at 100 µM), confirms OATP-mediated substrate status. The assay must be conducted at a concentration below the Km of the transporter to avoid saturation, and the incubation time should be within the linear uptake range (typically 2-5 minutes for OATP1B1). A key experimental pitfall is the use of excessive DMSO concentrations (>0.5% v/v), which can non-specifically inhibit OATP-mediated uptake and produce false-negative results.
The cyclosporine-statin interaction is the textbook example of OATP-mediated DDI and illustrates why the Cmax,inlet,u correction matters. Cyclosporine is a potent OATP1B1 inhibitor (IC50 ~0.2-0.5 µM). When cyclosporine (200 mg) is co-administered with rosuvastatin (10 mg), the rosuvastatin AUC increases 7.1-fold and Cmax increases 10.6-fold. The mechanism is almost entirely OATP1B1-mediated: rosuvastatin's CYP metabolism is minimal (~10% of clearance), and its biliary excretion is largely unchanged by cyclosporine. The inhibition occurs at the hepatocyte entry gate, not at the metabolic or excretory exit gates. The practical implication for drug development: a compound identified as an OATP1B1 inhibitor with an IC50 in the low micromolar range should be flagged for a clinical statin DDI study regardless of its CYP inhibition profile, because the OATP interaction alone can produce a clinically significant AUC change.
Endogenous biomarkers for OATP1B function — particularly coproporphyrin I (CP-I) and coproporphyrin III (CP-III) — represent one of the most important advances in transporter DDI assessment. CP-I is a heme biosynthesis intermediate that is selectively transported by OATP1B1 (and to a lesser extent OATP1B3) from blood into hepatocytes. When OATP1B is inhibited, plasma CP-I concentrations rise proportionally to the degree of inhibition, providing a direct readout of OATP1B functional activity without administering an exogenous probe drug. The International Transporter Consortium (ITC) 2024 white paper in Nature Reviews Drug Discovery classifies CP-I as a Tier 1 endogenous biomarker — clinically validated and ready for regulatory use. CP-I can be measured in the same plasma samples collected for pharmacokinetic analysis in Phase I studies, meaning that every single ascending dose study now has the potential to generate preliminary clinical OATP1B DDI data without additional subject burden.
Renal Transporters: OCT2, MATE1/MATE2K, and the Metformin-Cimetidine Model
The renal proximal tubule is a transporter-mediated DDI hotspot because it expresses a coordinated system of basolateral uptake and apical efflux transporters that work in series to actively secrete drugs and metabolites from blood into urine. OCT2 (SLC22A2) on the basolateral membrane extracts cationic drugs from the peritubular capillary blood into the proximal tubule cell. Once inside the cell, MATE1 (SLC47A1) and MATE2K (SLC47A2) on the apical membrane pump these drugs into the tubular lumen for urinary excretion. Inhibiting either step can produce a DDI — but inhibiting MATE is generally more dangerous because it traps the drug inside the cell, causing both intracellular accumulation (nephrotoxicity risk) and reduced renal clearance (increased systemic exposure).
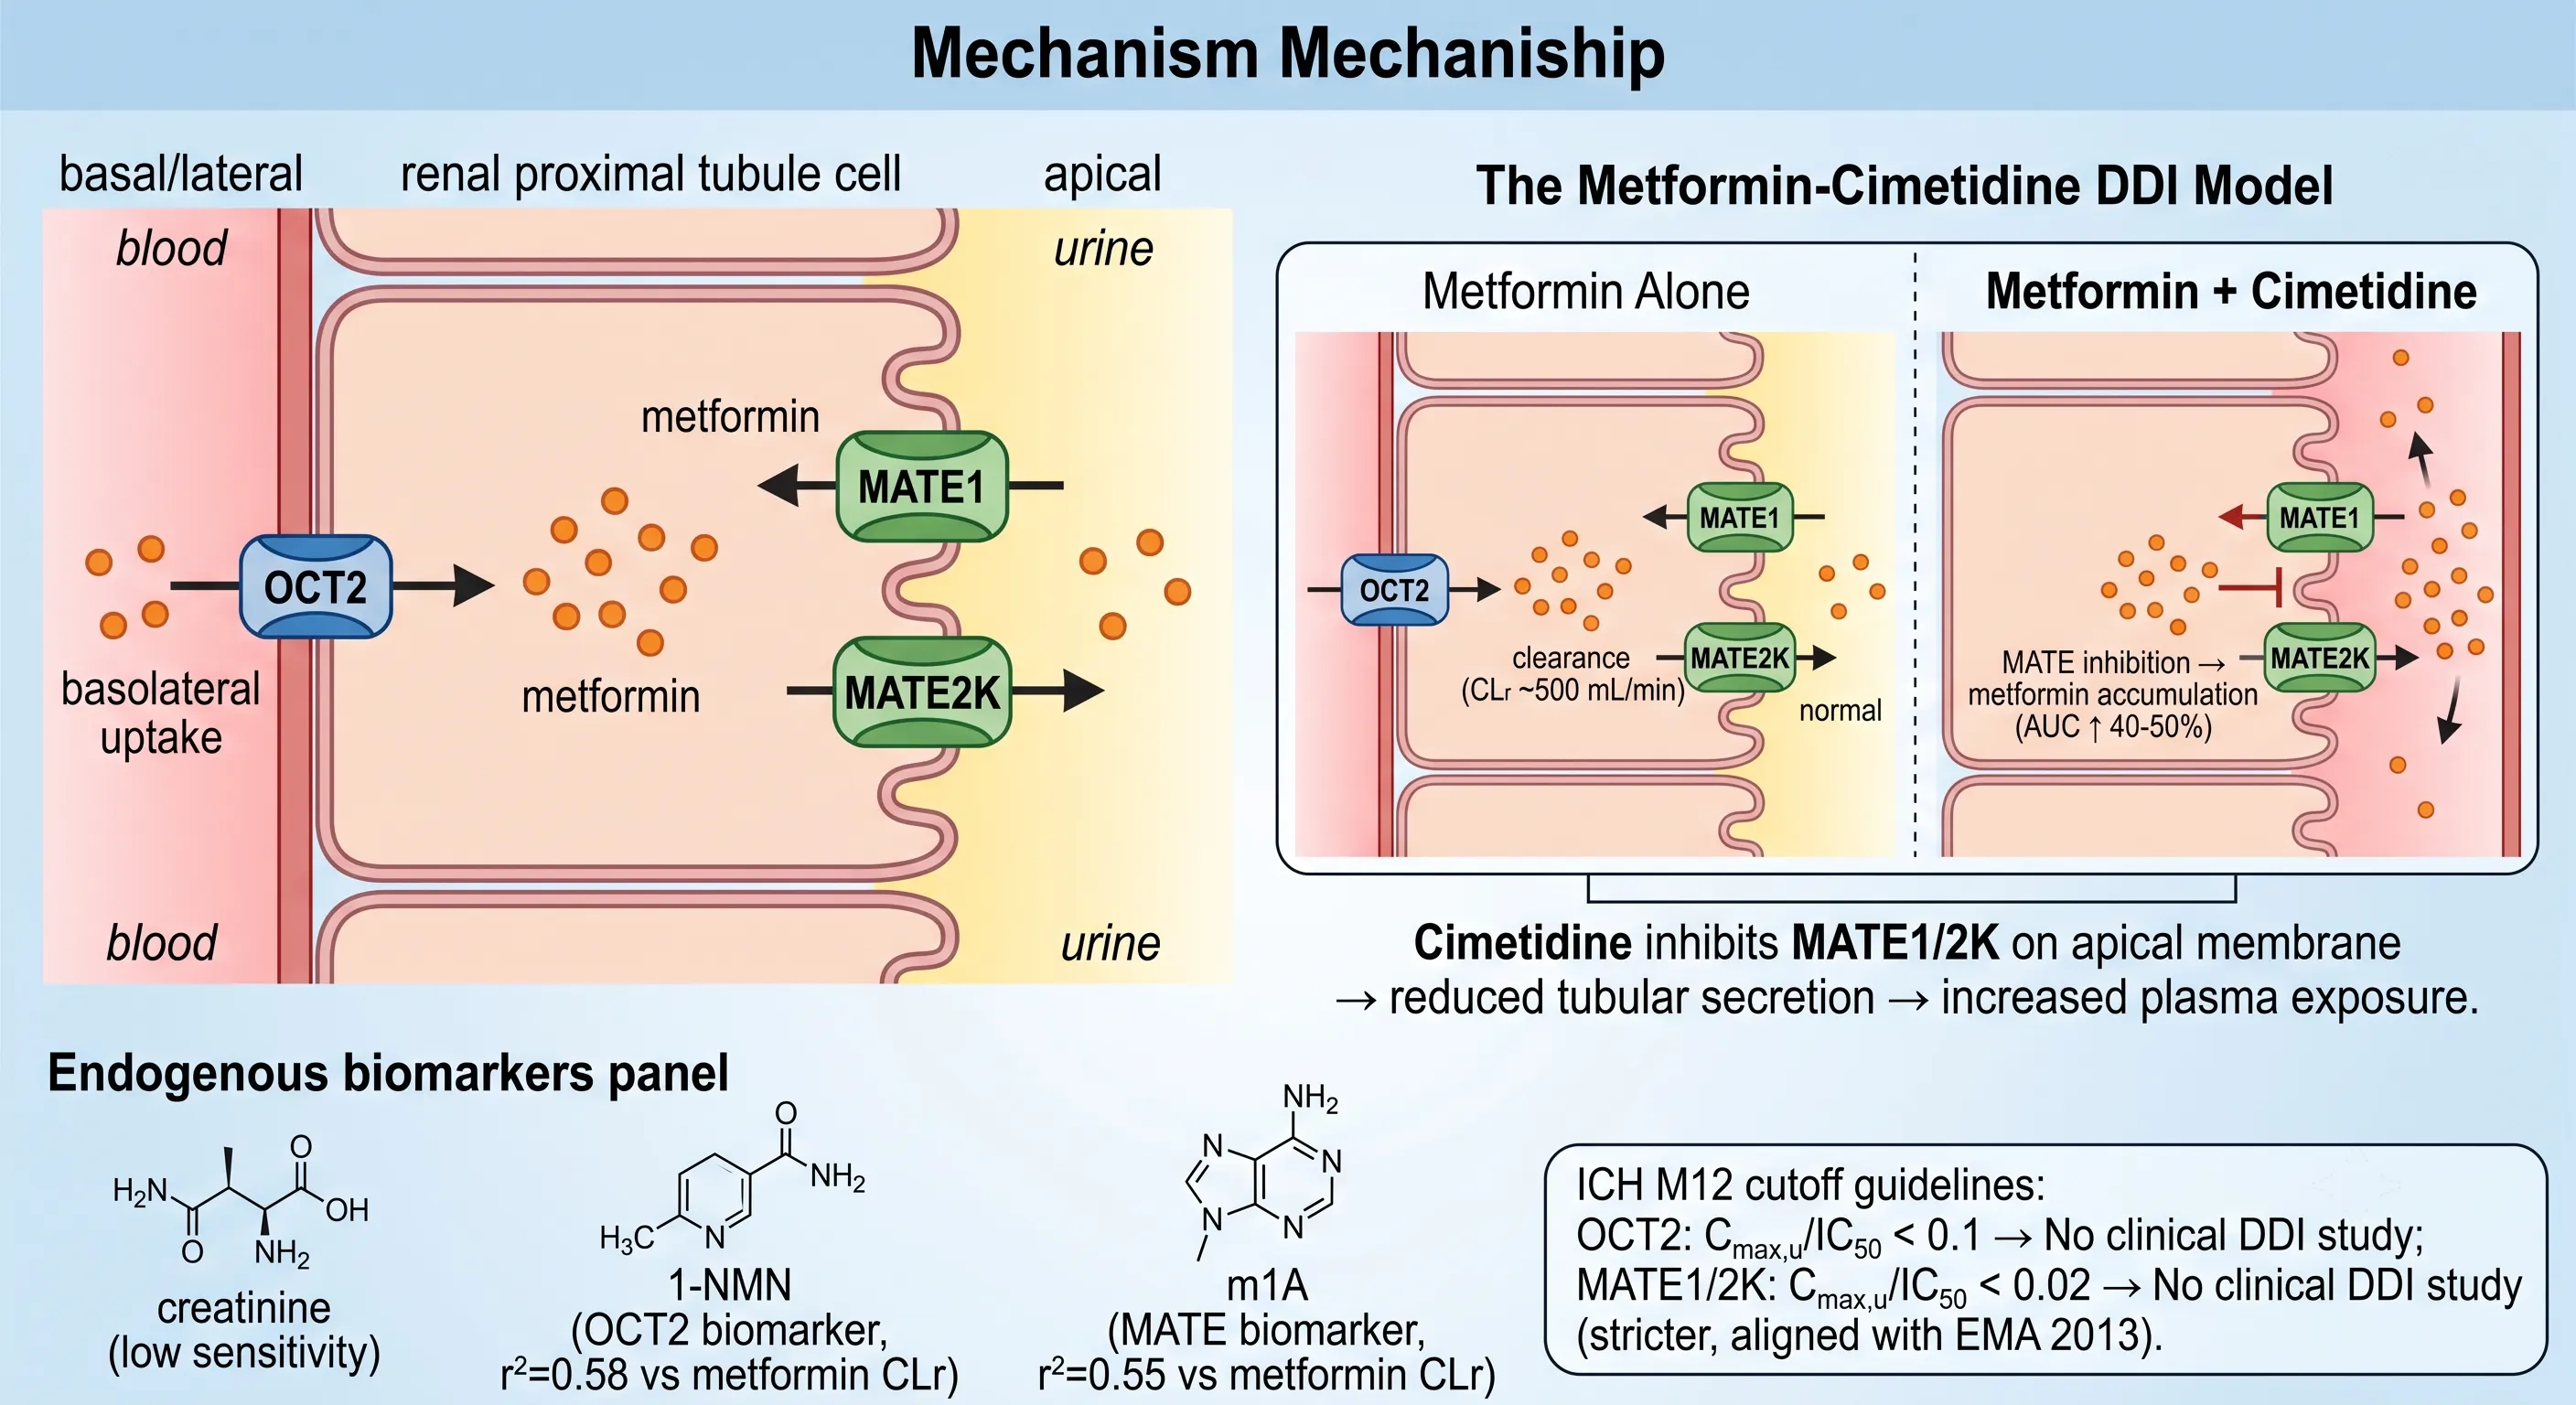 Figure 4: Renal Transporter DDI — OCT2, MATE1/MATE2K, and the Metformin-Cimetidine Model
The prototypical renal transporter DDI is metformin-cimetidine. Metformin is not metabolized — it is excreted unchanged in urine, with a renal clearance (~500 mL/min) that substantially exceeds the glomerular filtration rate (~120 mL/min × fu = ~85 mL/min), confirming extensive net active tubular secretion. OCT2 mediates metformin uptake from blood into the tubule cell; MATE1 and MATE2K mediate metformin efflux into urine. Cimetidine, an H2-receptor antagonist, inhibits MATE1/2K more potently (MATE1 IC50 ~1-7 µM) than OCT2. When cimetidine 400 mg is co-administered with metformin 500 mg, metformin AUC increases 40-50% and renal clearance decreases 25-30% — not because metformin uptake is blocked, but because metformin efflux into urine is impaired, causing the drug to accumulate in the tubule cell and back-diffuse into blood.
The in vitro renal transporter assays use the same principle as OATP assays: transporter-overexpressing cell lines compared to vector controls. For OCT2, HEK293-OCT2 cells are incubated with the test compound, and intracellular accumulation is compared to mock cells — a transport ratio ≥ 2 with ≥50% reduction by a selective OCT2 inhibitor (cimetidine at 100-300 µM, or the more selective decynium-22) confirms substrate status. For MATE1 and MATE2K, the assay direction is inverted: the test compound is pre-loaded into the cells, and efflux into the medium is measured over time, with transporter-expressing cells showing faster efflux than mock cells. MATE inhibition assessment uses the same uptake format as OCT2 but with MATE-overexpressing cells and a MATE substrate (metformin or the fluorescent substrate ASP⁺) whose intracellular accumulation is increased when the test compound blocks MATE-mediated efflux.
The endogenous biomarkers for renal transporters are advancing rapidly but remain Tier 2 per ITC 2024 — clinically promising but not yet fully qualified for regulatory decision-making. 1-NMN (N1-methylnicotinamide) is a selective OCT2 substrate: its renal clearance ratio decreases when OCT2 is inhibited, and it correlates with metformin renal clearance (r² = 0.58). m¹A (N1-methyladenosine) is a MATE substrate: its clearance ratio decreases more with MATE inhibition than OCT2 inhibition. Creatinine is the traditional renal function marker but has limited sensitivity for transporter DDI — only strong MATE inhibitors produce a measurable creatinine clearance change, because creatinine secretion involves multiple transporters (OCT2, OAT2, MATE1/2K) and compensatory pathways can mask inhibition of any single transporter.
Additional Transporters: OAT1/3, BSEP, ENT1/2 — When They Matter
Beyond the core five transporters (P-gp, BCRP, OATP1B1/1B3, OCT2, MATE), ICH M12 acknowledges several additional transporters with narrower but clinically important roles. These are not part of the routine DDI panel — they are evaluated only when the drug's structure, target indication, or disposition profile triggers a specific concern.
OAT1 (SLC22A6) and OAT3 (SLC22A8) — renal basolateral uptake of anionic drugs. These transporters extract organic anions from the peritubular blood into the proximal tubule cell, functioning as the anionic counterparts to OCT2. Clinical substrates include tenofovir (OAT1), furosemide (OAT1/3), cidofovir (OAT1), and β-lactam antibiotics (OAT3). The substrate assay uses the same HEK293-OAT uptake format, and the inhibition cutoff is Cmax,u/IC50 < 0.1. The clinical probe for OAT1/3 is furosemide, though its utility is limited by its mixed transporter specificity. Endogenous biomarkers — pyridoxic acid and homovanillic acid — are under clinical validation as OAT1/3 activity markers but remain Tier 2. OAT1/3 evaluation is triggered when active renal secretion of an anionic drug exceeds 25% of systemic clearance or when nephrotoxicity is a known class liability.
BSEP (ABCB11) — hepatic bile salt efflux, DILI risk marker. BSEP transports bile acids from the hepatocyte into the bile canaliculus, maintaining the enterohepatic bile acid circulation. Unlike the other ICH M12 transporters, BSEP is evaluated primarily for toxicity risk rather than pharmacokinetic DDI. Potent BSEP inhibition (IC50 < 25 µM in membrane vesicle assays) is a red flag for cholestatic DILI — drug-induced bile acid accumulation inside the hepatocyte triggers mitochondrial dysfunction and apoptosis. Bosentan, troglitazone, and cyclosporine are established BSEP inhibitors with varying degrees of clinical hepatotoxicity. The BSEP inhibition assay uses inverted membrane vesicles from BSEP-expressing cells, measuring ATP-dependent uptake of the fluorescent bile acid taurocholate or the radiolabeled probe [³H]-taurocholic acid. ICH M12 recommends evaluating BSEP when the drug is a known hepatotoxin, is concentrated in the liver, or belongs to a chemical class associated with cholestatic DILI.
ENT1 (SLC29A1) and ENT2 (SLC29A2) — nucleoside transporters. These facilitative diffusion transporters mediate the cellular uptake of endogenous nucleosides and nucleoside analog drugs. ENT1 is the primary transporter for gemcitabine, cytarabine, fludarabine, and ribavirin — drugs where cellular uptake is the rate-limiting step for intracellular activation and efficacy. ENT inhibition can reduce the anti-tumor or antiviral efficacy of these drugs without changing their plasma pharmacokinetics, producing a pharmacodynamic DDI that a standard plasma AUC measurement would miss. ENT evaluation is only required for nucleoside analog therapeutics, where the in vitro assay uses ENT1/2-overexpressing cells to measure whether the test compound competes for EN1/2-mediated uptake of a radiolabeled or fluorescent nucleoside probe. ENT-mediated DDIs are a specialized concern in oncology and antiviral drug development and are not part of the standard small-molecule DDI panel.
Transporter Inhibition Cutoffs, Static Models, and Clinical DDI Prediction
The ICH M12 transporter inhibition cutoff framework translates in vitro IC50 values into binary clinical decisions: study or waiver. The cutoff values are not arbitrary — they are empirically calibrated against clinical DDI databases where drugs with known in vitro IC50 values were studied in clinical transporter DDI trials, and the cutoff that best discriminated drugs causing ≥25% change in victim drug AUC from those causing <25% change was selected for each transporter. The result is a set of six cutoffs partitioned by transporter and route of administration.
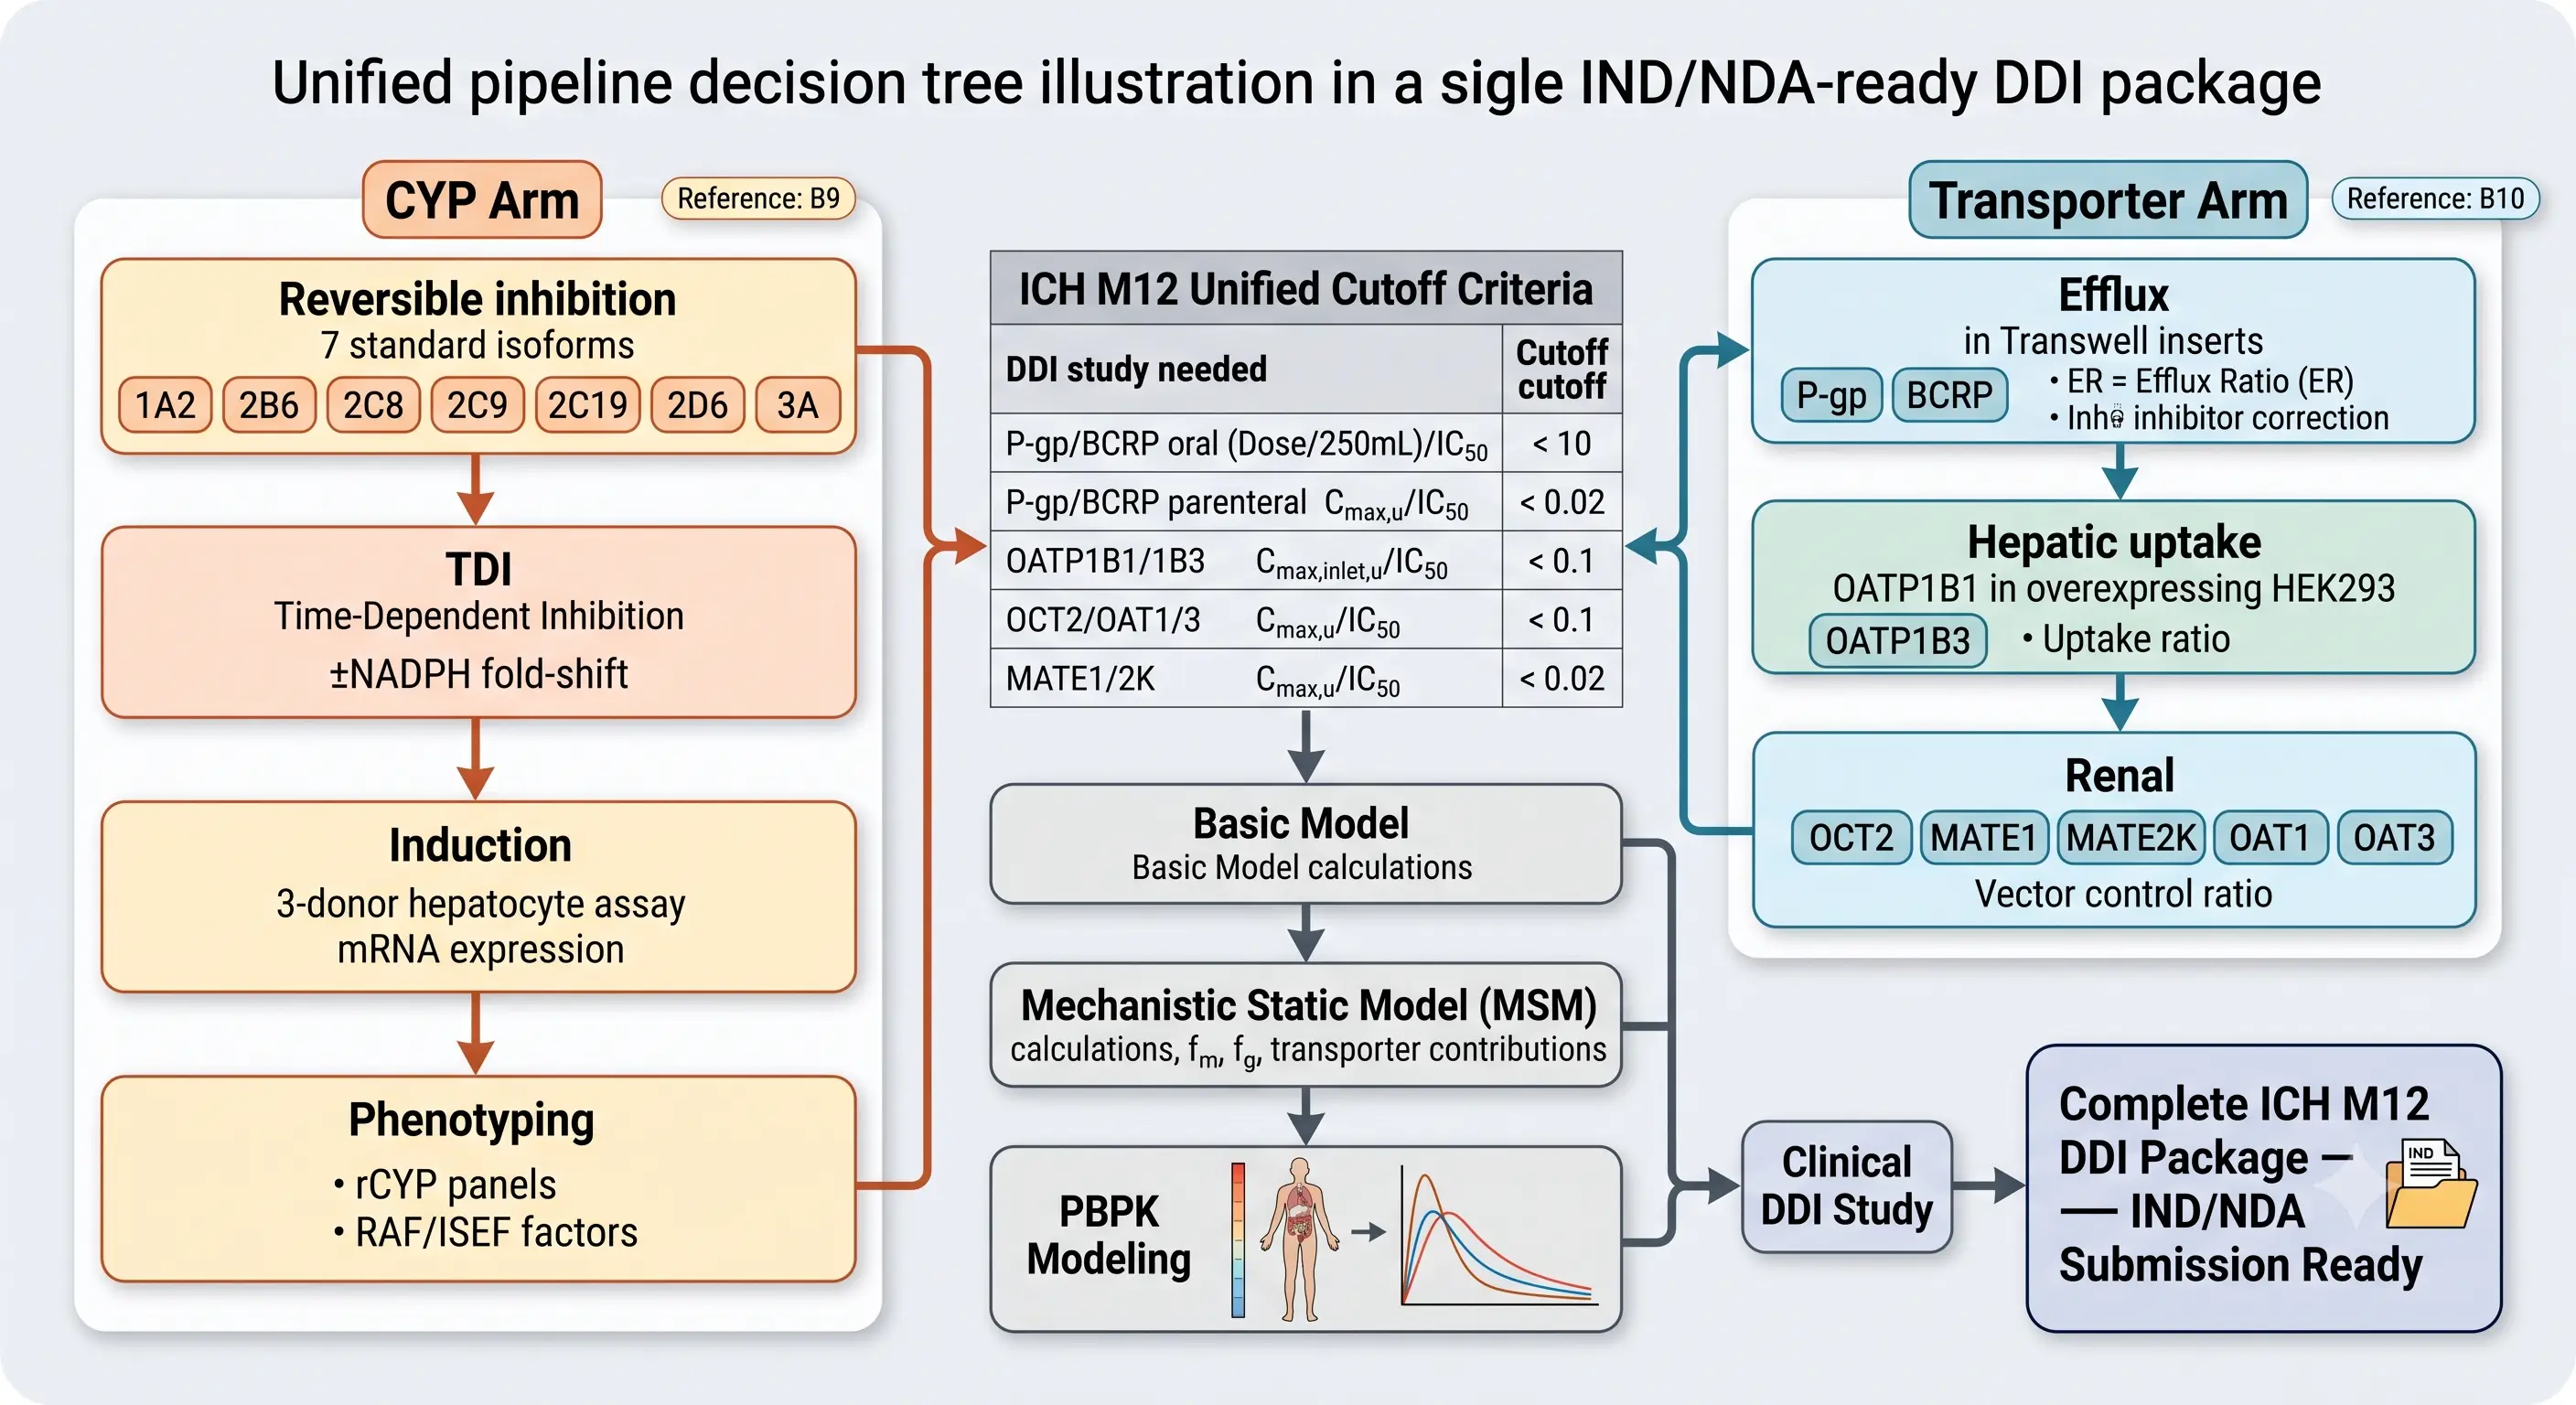 Figure 5: Complete ICH M12 DDI Assessment — CYP + Transporter Integration Workflow
The cutoff values fall into three tiers based on their stringency. The strictest cutoff is 0.02, applied to MATE1/2K (renal) and P-gp/BCRP (parenteral/metabolite) — a compound must have an IC50 > 50 × Cmax,u to waive these studies. The intermediate cutoff is 0.1, applied to OATP1B1/1B3 (hepatic), OAT1/3 (renal), and OCT2 (renal) — requiring IC50 > 10 × the relevant clinical concentration. The most permissive cutoff is 10, applied to P-gp/BCRP for oral drugs using the intestinal lumen concentration surrogate (Dose/250mL) — (Dose/250mL)/IC50 < 10 waives the clinical DDI study. This gradient reflects the differing physiological consequences: MATE inhibition produces intracellular drug accumulation plus systemic exposure increase, OATP/OCT inhibition primarily affects systemic exposure without intracellular trapping, and intestinal P-gp/BCRP inhibition only affects oral absorption of the victim drug without the tissue accumulation concern.
When the Basic Model cutoff is exceeded, the assessment proceeds to the Mechanistic Static Model (MSM), which incorporates the fraction of victim drug clearance mediated by the inhibited transporter (ft), the fraction of the victim drug dose absorbed via the transporter pathway (fa for intestinal transporters), and the specific inhibition kinetics (competitive vs non-competitive). The MSM equation for transporter-mediated DDI is: AUCR = 1 / [ft × (Cmax,u / IC50) + (1 − ft)], analogous to the CYP MSM equation. For intestinal P-gp/BCRP, the relevant parameter is not systemic AUCR but the change in oral absorption — if the victim drug has low intrinsic permeability and its absorption is P-gp/BCRP-limited, P-gp/BCRP inhibition can increase the fraction absorbed (fa) without affecting systemic clearance. If the MSM-predicted AUCR falls outside 0.80-1.25, a clinical DDI study or PBPK modeling is the next step. Tissue-to-plasma ratio Kp data from distribution studies directly inform the PBPK model by providing organ-specific drug concentrations at transporter-expressing tissues, improving the accuracy of transporter-mediated DDI predictions beyond what the MSM can achieve with plasma concentrations alone.
The integration of endogenous biomarkers into the clinical prediction workflow is the most significant methodological advance in transporter DDI assessment. Instead of relying solely on in vitro IC50 data and in silico predictions, a Phase I study can measure plasma CP-I concentrations before and after multiple dosing of the investigational drug. If CP-I increases in a dose-dependent manner, the drug inhibits OATP1B in humans — directly confirming the in vitro prediction and providing a concentration-response relationship for the in vivo inhibition. This approach can eliminate the need for a dedicated clinical statin DDI study if CP-I shows no increase at the highest clinical dose, or it can provide the quantitative in vivo inhibition data needed to parameterize the MSM and PBPK models without requiring a clinical probe substrate study.
Complete ICH M12 DDI Workflow: CYP + Transporter Integration
The ICH M12 DDI package is not two separate assessments — it is a single integrated evaluation where CYP and transporter data converge on the same clinical prediction algorithm. The practical workflow for a drug development team follows a logical sequence: (1) complete the CYP inhibition, TDI, induction, and phenotyping assessment; (2) complete the transporter substrate and inhibition assessment for the transporters triggered by the drug's route, disposition, and structure; (3) feed all in vitro data into the MSM for each pathway where a Basic Model cutoff was exceeded; (4) identify the worst-case predicted AUCR across all pathways — CYP and transporter — which determines the overall DDI risk classification; and (5) design the clinical DDI strategy around the pathways with the highest predicted interaction magnitude.
The integration is methodologically unified by the shared analytical platform. The same LC-MS/MS single drug quantification system that measures probe substrate metabolites in CYP inhibition assays also quantifies the test compound in transporter uptake and bidirectional permeability assays, the endogenous biomarkers for transporter activity (CP-I, 1-NMN, m¹A, creatinine), and the parent drug and metabolite concentrations in clinical samples. This analytical continuity is operationally efficient — one instrument, one method development approach, one set of validation standards — and scientifically coherent, because it eliminates inter-platform variability as a source of apparent inconsistency between CYP and transporter DDI predictions.
The regulatory expectation under ICH M12 is that every IND and NDA submission contains a unified DDI risk assessment table that lists, for each CYP isoform and transporter evaluated: the in vitro parameter (IC50, Ki, kinact/KI, Emax/EC50, ER, uptake ratio), the clinical concentration used ([I] or Cmax,u or Cmax,inlet,u), the calculated ratio, the cutoff, and the conclusion (waiver or clinical study conducted/planned). This table is the first page a regulator turns to when reviewing the DDI section of a submission — gaps in the table (a transporter that should have been evaluated but was not) generate information requests that delay review timelines. The complete ICH M12 DDI package, covering all nine transporters plus the seven CYP isoforms, represents the current global regulatory standard for in vitro DDI assessment.
The integration of metabolite data from drug metabolite identification completes the DDI picture. A circulating metabolite that meets the dual-threshold criteria (≥25% of parent AUC and ≥10% of total drug-related material) must be assessed for both CYP and transporter DDI liability. For transporters specifically, the metabolite uses the parenteral cutoff (0.02 for P-gp/BCRP) rather than the oral cutoff (10), because the metabolite was formed systemically and does not pass through the intestinal lumen at high concentrations. This is a common oversight: a drug development team may correctly determine that the parent drug waives P-gp/BCRP clinical study by the oral cutoff, while a major circulating metabolite — formed after absorption — may require P-gp/BCRP assessment by the parenteral cutoff and trigger a clinical DDI study that was not anticipated from the parent drug data alone.
Frequently Asked Questions
What is the difference between P-gp and BCRP efflux transporters and when must both be evaluated?
P-gp (ABCB1) and BCRP (ABCG2) are the two dominant ATP-binding cassette efflux transporters that limit drug absorption and distribution. Both are expressed at the intestinal epithelium (apical membrane, pumping drugs back into the lumen), the blood-brain barrier (luminal membrane of brain capillary endothelial cells, restricting CNS penetration), and the canalicular membrane of hepatocytes (biliary excretion). Despite overlapping tissue distribution and partially overlapping substrate specificity, ICH M12 requires both transporters to be evaluated independently because their substrate profiles are not identical: P-gp preferentially transports cationic and neutral hydrophobic compounds (digoxin, loperamide, paclitaxel), while BCRP transports a broader range including sulfate and glucuronide conjugates, statins, and some tyrosine kinase inhibitors. A compound that is not a P-gp substrate may still be a BCRP substrate. The standard in vitro approach uses bidirectional permeability assays across Caco-2 or MDCK monolayers overexpressing each transporter individually, with an efflux ratio (Papp B→A / Papp A→B) ≥2 and ≥50% reduction by a selective inhibitor (tariquidar for P-gp, Ko143 for BCRP) confirming transporter-specific substrate liability. For oral drugs, the ICH M12 inhibition cutoff is (Dose/250mL)/IC50 < 10; for parenteral drugs or post-absorption metabolites, the cutoff is Cmax,u/IC50 < 0.02.
Why are OATP1B1 and OATP1B3 considered the most clinically important hepatic uptake transporters?
OATP1B1 and OATP1B3 are the primary gatekeepers of hepatic drug clearance. Located on the sinusoidal (blood-facing) membrane of human hepatocytes, they extract a remarkably broad range of drugs from portal blood into the liver, including statins (rosuvastatin, atorvastatin, pitavastatin, fluvastatin), sartans (valsartan, olmesartan), glinides (repaglinide), rifampicin, methotrexate, and numerous tyrosine kinase inhibitors. When a perpetrator drug inhibits OATP1B1/1B3, the hepatic extraction of the victim drug is reduced, causing systemic exposure to rise — the cyclosporine-statin interaction is the clinical paradigm, with cyclosporine increasing rosuvastatin AUC by 7.1-fold and pitavastatin AUC by 4.6-fold via OATP1B1 inhibition. ICH M12 requires OATP1B1/1B3 substrate evaluation when hepatic metabolism or biliary excretion accounts for ≥25% of total drug elimination. The in vitro assay uses HEK293 cells overexpressing OATP1B1 or OATP1B3 compared to empty vector control cells, measuring the uptake rate ratio of the test compound. The inhibition cutoff for OATP1B1/1B3 is Cmax,inlet,u/IC50 < 0.1 — where Cmax,inlet,u incorporates the contribution of oral absorption to the hepatic portal concentration. Endogenous biomarkers coproporphyrin I and III (CP-I, CP-III) are emerging as Tier 1 clinical biomarkers per the International Transporter Consortium (2024) to directly measure OATP1B functional activity in humans without administering an exogenous probe drug.
What is the ICH M12 cutoff difference between OCT2 and MATE transporter inhibition and why does it matter?
ICH M12 applies different clinical DDI waiver cutoffs to OCT2 (basolateral uptake) and MATE1/MATE2K (apical efflux) despite both transporters operating in series in the renal proximal tubule. OCT2 has a cutoff of Cmax,u/IC50 < 0.1, while MATE1/2K has a stricter cutoff of Cmax,u/IC50 < 0.02 — meaning a compound is five times more likely to trigger a clinical MATE DDI study than an OCT2 DDI study at the same IC50. This asymmetry reflects the physiological consequence of inhibiting each transporter. OCT2 inhibition reduces cellular uptake of the victim drug, which can decrease renal clearance but is partially compensated by reduced intracellular substrate availability for MATE-mediated efflux — the net effect on plasma exposure is attenuated. MATE inhibition, in contrast, traps the victim drug inside the proximal tubule cell after OCT2-mediated uptake, causing intracellular accumulation that can damage the kidney and, for substrates that also undergo hepatic clearance, increasing systemic exposure because the renal secretory pathway is blocked. The metformin-cimetidine DDI exemplifies this: cimetidine inhibits MATE1/2K more potently than OCT2, and metformin AUC increases 40-50% with cimetidine co-administration. The MATE cutoff of 0.02 represents the most notable ICH M12 harmonization decision — aligning with the EMA 2013 stricter standard rather than the FDA 2020 cutoff of 0.1, making MATE the most conservatively regulated transporter in the ICH M12 framework.
When must metabolite-mediated transporter DDI be evaluated per ICH M12?
ICH M12 requires a metabolite to be evaluated as a potential perpetrator of transporter-mediated DDI when it meets two criteria simultaneously: metabolite AUC ≥25% of parent drug AUC AND metabolite AUC ≥10% of total drug-related material (parent + all metabolites) in human plasma. However, there is an important distinction from CYP-mediated DDI: for P-gp and BCRP specifically, a metabolite that circulates in plasma at concentrations exceeding the parent drug must use the more conservative parenteral cutoff (Cmax,u/IC50 < 0.02) rather than the oral cutoff ((Dose/250mL)/IC50 < 10). This is because the metabolite was formed post-absorption and does not pass through the intestinal lumen, so the intestinal concentration surrogate (Dose/250mL) is not applicable. Additionally, some metabolites are more potent transporter inhibitors than the parent drug: gemfibrozil glucuronide is a far more potent OATP1B1 inhibitor than gemfibrozil, and N-desmethyl-imatinib inhibits BCRP with comparable potency to imatinib. If the metabolite is chemically unstable, not commercially available, or cannot be synthesized in sufficient quantity, a waiver may be justified — but the scientific justification must explain why the metabolite's structural features suggest lower transporter inhibition risk than the parent. The practical consequence is that metabolite profiling and identification in human plasma must be completed before the transporter DDI strategy is finalized.
What are endogenous biomarkers for transporter DDI assessment and which ones are clinically validated?
Endogenous biomarkers are naturally occurring metabolites in human plasma and urine whose concentrations reflect the functional activity of specific drug transporters — they eliminate the need to administer an exogenous probe drug in a clinical DDI study. Per the International Transporter Consortium (ITC) 2024 classification: Tier 1 (clinically validated, ready for regulatory use) includes coproporphyrin I (CP-I) and coproporphyrin III (CP-III) for OATP1B1/1B3 activity — elevated plasma CP-I reliably indicates OATP1B inhibition and correlates with statin AUC changes. Tier 2 (promising, requires additional clinical validation) includes: 1-NMN (N1-methylnicotinamide) for OCT2 activity (renal clearance ratio correlates with metformin CLr with r² = 0.58); m¹A (N1-methyladenosine) for MATE1/2K activity (correlates with metformin CLr with r² = 0.55); creatinine for OCT2/MATE activity (weaker sensitivity, significant changes only with strong inhibitors); pyridoxic acid and homovanillic acid for OAT1/3 activity; and hexadecanedioate and tetradecanedioate for OATP1B. The ICH M12 guideline explicitly endorses the use of endogenous biomarkers in clinical DDI studies, and the 2024 ITC white paper in Nature Reviews Drug Discovery provides a comprehensive evaluation framework. The key advantage is operational: a Phase I single ascending dose study can simultaneously measure plasma CP-I to assess whether the investigational drug inhibits OATP1B in humans, providing early clinical DDI information without requiring a dedicated clinical DDI study with a probe substrate.
How do ICH M12 transporter cutoff criteria differ from the previous FDA 2020 guidance?
ICH M12 (2024) harmonizes FDA 2020, EMA 2013, and PMDA 2018 transporter DDI guidances, adopting different elements from each. The four key differences from FDA 2020 are: (1) MATE1/2K cutoff tightened from Cmax,u/IC50 < 0.1 to < 0.02 — ICH M12 adopted the stricter EMA standard, meaning more drugs will trigger clinical MATE DDI studies; (2) OATP1B1/1B3 cutoff harmonized at Cmax,inlet,u/IC50 < 0.1 — relaxed from EMA's 0.04 but identical to FDA 2020; (3) OAT1/3 and OCT2 cutoffs harmonized at Cmax,u/IC50 < 0.1 — relaxed from EMA's 0.02 for renal uptake transporters but identical to FDA 2020; (4) ICH M12 explicitly incorporates the protein binding update — experimentally measured fu,p below 0.01 is now accepted (previously capped at 0.01 in FDA 2010 guidance), which directly affects the unbound drug concentration used in all cutoff calculations. Additional harmonization gains include: standardized endogenous biomarker guidance (not present in FDA 2020), explicit metabolite DDI evaluation criteria for transporters (previously enzyme-focused), and a unified decision tree that integrates CYP and transporter assessment into a single DDI package. For global drug development programs, the most impactful change is the MATE cutoff — compounds previously waivable under FDA 2020 may now require clinical MATE DDI studies under ICH M12.
References
- ICH M12: Drug Interaction Studies. International Council for Harmonisation; 2024. https://database.ich.org/sites/default/files/ICH_M12_Step4_Guideline_2024_0521.pdf
- U.S. Food and Drug Administration. In Vitro Drug Interaction Studies — Cytochrome P450 Enzyme- and Transporter-Mediated Drug Interactions: Guidance for Industry. FDA; 2020. https://www.fda.gov/media/134582/download
- International Transporter Consortium. Membrane transporters in drug development and as determinants of precision medicine. Nat Rev Drug Discov. 2024;23(4):255-280. DOI: 10.1038/s41573-023-00877-1
- Colclough N, Alluri RV, Tucker JW, et al. Utilizing a dual human transporter MDCKII-MDR1-BCRP cell line to assess efflux at the blood brain barrier. Drug Metab Dispos. 2024;52(2):95-105. DOI: 10.1124/dmd.123.001476
- Zamek-Gliszczynski MJ, Taub ME, Chothe PP, et al. Transporters in drug development: 2018 ITC recommendations for transporters of emerging clinical importance. Clin Pharmacol Ther. 2018;104(5):890-899. DOI: 10.1002/cpt.1112
- Chu X, Liao M, Shen H, et al. Clinical probes and endogenous biomarkers as substrates for transporter drug-drug interaction evaluation: perspectives from the International Transporter Consortium. Clin Pharmacol Ther. 2018;104(5):836-864. DOI: 10.1002/cpt.1216
- Koishikawa T, Fujiwara K, Taskar K, et al. Effects of cimetidine and dolutegravir on the endogenous drug-drug interaction biomarkers for organic cation transporter 2 and multidrug and toxin extrusion protein 1 in healthy volunteers. Clin Pharmacol Ther. 2025;117(2):523-533. DOI: 10.1002/cpt.3482
- Volpe DA. Knockout transporter cell lines to assess substrate potential towards efflux transporters. AAPS J. 2024;26(4):79. DOI: 10.1208/s12248-024-00950-6
- Giacomini KM, Huang SM, Tweedie DJ, et al. Membrane transporters in drug development. Nat Rev Drug Discov. 2010;9(3):215-236. DOI: 10.1038/nrd3028
Related Services


