Plasma drug concentration is the number at the center of every pharmacokinetic decision in drug development. Whether a compound advances from discovery to preclinical, whether a dosing regimen is safe, whether a generic is bioequivalent — all of it traces back to concentration data measured in plasma. This article explains what plasma drug concentration means, how it is measured by LC-MS/MS, and what the key PK parameters tell you about a drug's behavior in the body.
How Plasma Drug Concentration Is Measured
The measurement workflow has remained conceptually stable for decades because the logic is sound. What has changed is the sensitivity, speed, and specificity of the analytical technology.
Blood is drawn from a study subject — venous, typically 2-5 mL per time point — into an anticoagulant tube. K2EDTA is the default for small-molecule drugs because it chelates calcium without introducing lithium adducts or gel barrier interferences that can sequester lipophilic compounds. The tube is centrifuged, usually at 1500-2000 g for 10-15 minutes at 4°C, to separate plasma from cellular components. Plasma is the supernatant — roughly 55% of whole blood volume. Serum requires an additional 30-60 minute clotting step at room temperature before centrifugation; the clot traps some drug, and for certain compounds the difference between plasma and serum concentration can exceed 20%. Plasma avoids this variable.
The plasma sample undergoes sample preparation — most commonly protein precipitation (PPT) with acetonitrile or methanol, sometimes liquid-liquid extraction (LLE) or solid-phase extraction (SPE) for cleaner extracts. The choice of extraction technique directly affects method sensitivity, matrix effect magnitude, and throughput — PPT is fastest but leaves 60-80% of phospholipids in the extract; LLE is cleaner but limited to non-polar analytes; SPE offers the best balance of cleanliness and recovery at higher cost and development time. Our sample preparation method development services cover PPT, LLE, and SPE optimization with matrix-specific protocols for plasma, serum, urine, and tissue homogenates. The prepared sample is injected into an LC-MS/MS system. The liquid chromatography column separates the drug from remaining matrix components; the triple quadrupole mass spectrometer detects it by two sequential mass filters (MRM transition) that provide compound-specific detection. The peak area from the analyte is compared against a calibration curve constructed from known concentrations in blank matrix, and a concentration in ng/mL is reported.
This workflow — blood draw to reported concentration — can be completed in under 30 minutes per sample for a validated method running in batch mode with 96-well plates. Building this workflow from scratch for a new chemical entity involves column screening, mobile phase optimization, extraction protocol development, IS selection, and full ICH M10 validation — a 4-6 week process when done systematically. Our bioanalytical method development and validation services cover the complete workflow from analyte optimization through regulatory-ready validation. For a full guide to the LC-MS/MS quantification workflow, see our comprehensive guide on single-drug quantification by LC-MS/MS.
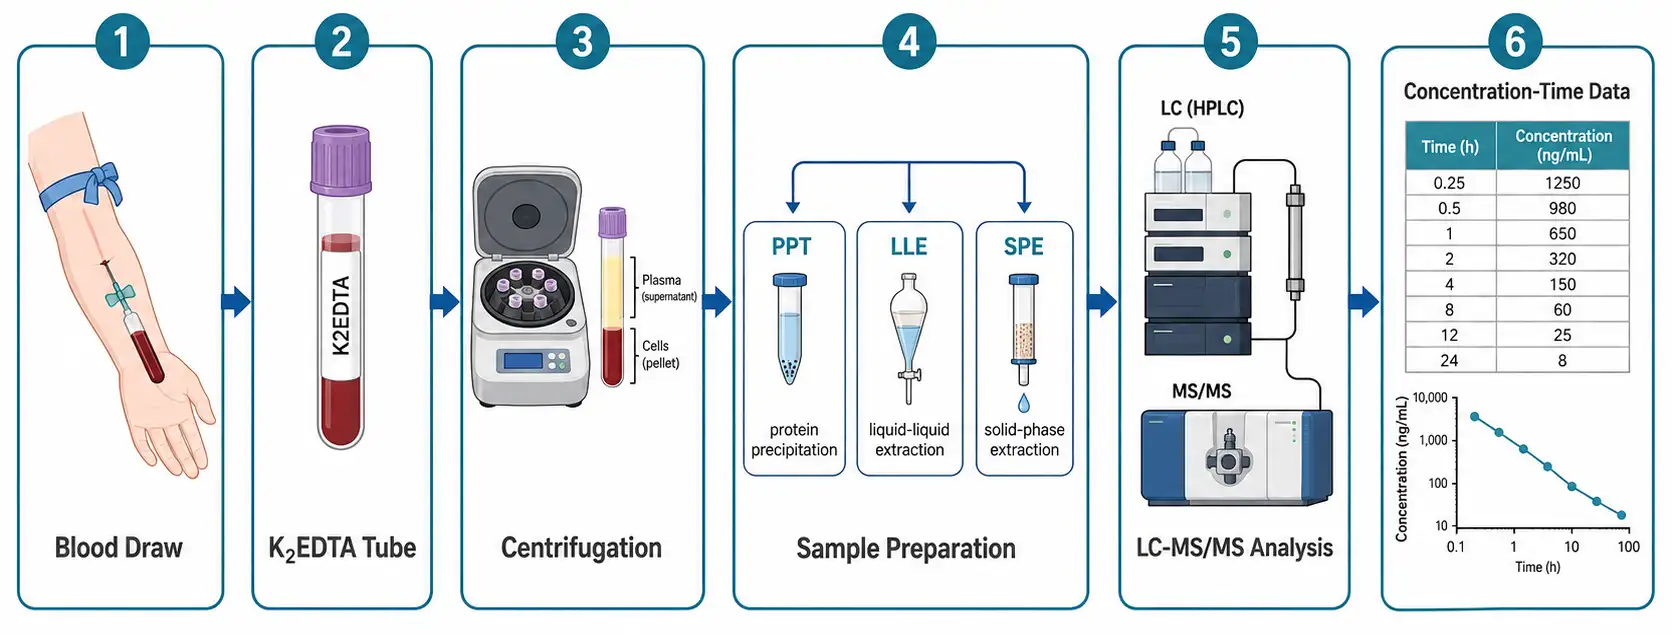 Figure 1: Plasma Drug Concentration Measurement Workflow — Blood Draw to Anticoagulant Tube to Centrifugation to Sample Preparation (PPT/LLE/SPE) to LC-MS/MS Analysis to Concentration-Time Data Table
The Six Core PK Parameters
Every plasma concentration-time dataset reduces to a handful of parameters. Each answers one specific question about how the drug behaves.
Cmax — Maximum Plasma Concentration
Cmax is the highest concentration the drug reaches in plasma after dosing. For oral drugs, it's the peak of the absorption phase — the moment when the rate of drug entering plasma equals the rate leaving it. Cmax is read directly from the concentration-time data: the highest observed value, no calculation required.
What Cmax tells you: whether the drug reaches concentrations needed for efficacy (above the minimum effective concentration) and whether it approaches concentrations associated with toxicity. A narrow therapeutic window means Cmax must be tightly controlled. For drugs with Cmax-driven toxicity, formulation strategies that blunt the peak without reducing total exposure — extended-release formulations, for example — can widen the safety margin.
Cmax is the most sampling-schedule-dependent parameter. If the true peak occurs at 1.5 hours but blood is drawn at 1.0 and 2.0 hours, the observed Cmax will be lower than the true Cmax. Adequate sampling density around the expected Tmax is essential — at minimum two and ideally three points bracketing the expected peak.
Tmax — Time to Maximum Concentration
Tmax is the time at which Cmax occurs. Like Cmax, it is read directly from the data. For oral drugs, Tmax reflects the rate of absorption — a shorter Tmax means faster absorption. Gastric emptying, fed/fasted state, formulation (immediate vs extended release), and transporter-mediated uptake all shift Tmax.
What Tmax tells you: how quickly the drug reaches effective concentrations. For acute indications — pain relief, migraine, anxiety — a short Tmax is clinically important. For chronic maintenance therapy, Tmax matters less than steady-state average concentration.
Unlike Cmax or AUC, Tmax has no formal acceptance range in bioequivalence testing beyond the general expectation that formulations should not differ substantially in absorption rate.
AUC — Area Under the Concentration-Time Curve
AUC is total systemic exposure — the integrated drug concentration over time. It is calculated from the concentration-time data using the trapezoidal rule: the area of each time interval (average concentration × time difference) summed across all intervals, with extrapolation from the last measured concentration to infinity using the terminal elimination rate constant.
AUC₀→last is the area from time zero to the last measurable concentration. AUC₀→∞ is AUC₀→last plus the extrapolated tail — the tail should contribute less than 20% of total AUC for the extrapolation to be considered reliable. AUC₀→τ is exposure over one dosing interval at steady state.
What AUC tells you: how much drug the body sees in total. This is the single most important parameter for determining bioavailability (F = AUC_oral / AUC_IV × Dose_IV / Dose_oral) and for establishing bioequivalence between test and reference formulations. AUC is directly proportional to dose in drugs with linear pharmacokinetics. When clearance changes — renal impairment, hepatic impairment, drug-drug interaction — AUC changes in the opposite direction.
For bioanalytical labs, AUC is the parameter most sensitive to an inaccurate LLOQ. If the LLOQ is too high, the terminal portion of the curve is truncated and AUC is underestimated. Industry practice and regulatory expectation is that the LLOQ should be no higher than 5% of Cmax for this reason — an LLOQ above this threshold risks missing a significant fraction of total exposure. For methods requiring validated quantification across the full concentration range, our LC-MS/MS single drug quantification services include full ICH M10 validation with calibration ranges tailored to expected study concentrations.
Half-Life — t½
Half-life is the time required for the plasma concentration to decrease by 50% during the elimination phase. It is calculated from the terminal slope of the log-linear concentration-time plot: t½ = ln(2) / kel, where kel is the elimination rate constant — the slope of the terminal phase on a natural log scale.
What half-life tells you: dosing frequency and time to steady state. A drug reaches steady state after approximately 4-5 half-lives of repeated dosing at a fixed interval. A drug with a 24-hour half-life takes 4-5 days to reach steady state. A drug with a 4-hour half-life reaches steady state in less than a day. Half-life also determines the washout period needed between treatments in crossover studies — typically ≥5 half-lives.
A common error: half-life determines dosing frequency, not dose size. A short half-life means more frequent dosing, not a larger dose. Dose size is driven by clearance and target concentration. For methods that must support PK studies across the full half-life range — from ultra-short (t½ < 2 h, requiring dense early sampling and low LLOQ) to very long (t½ > 72 h, requiring extended stability validation) — our full, partial, and cross-validation services include sampling schedule design input and stability protocols tailored to the expected terminal half-life.
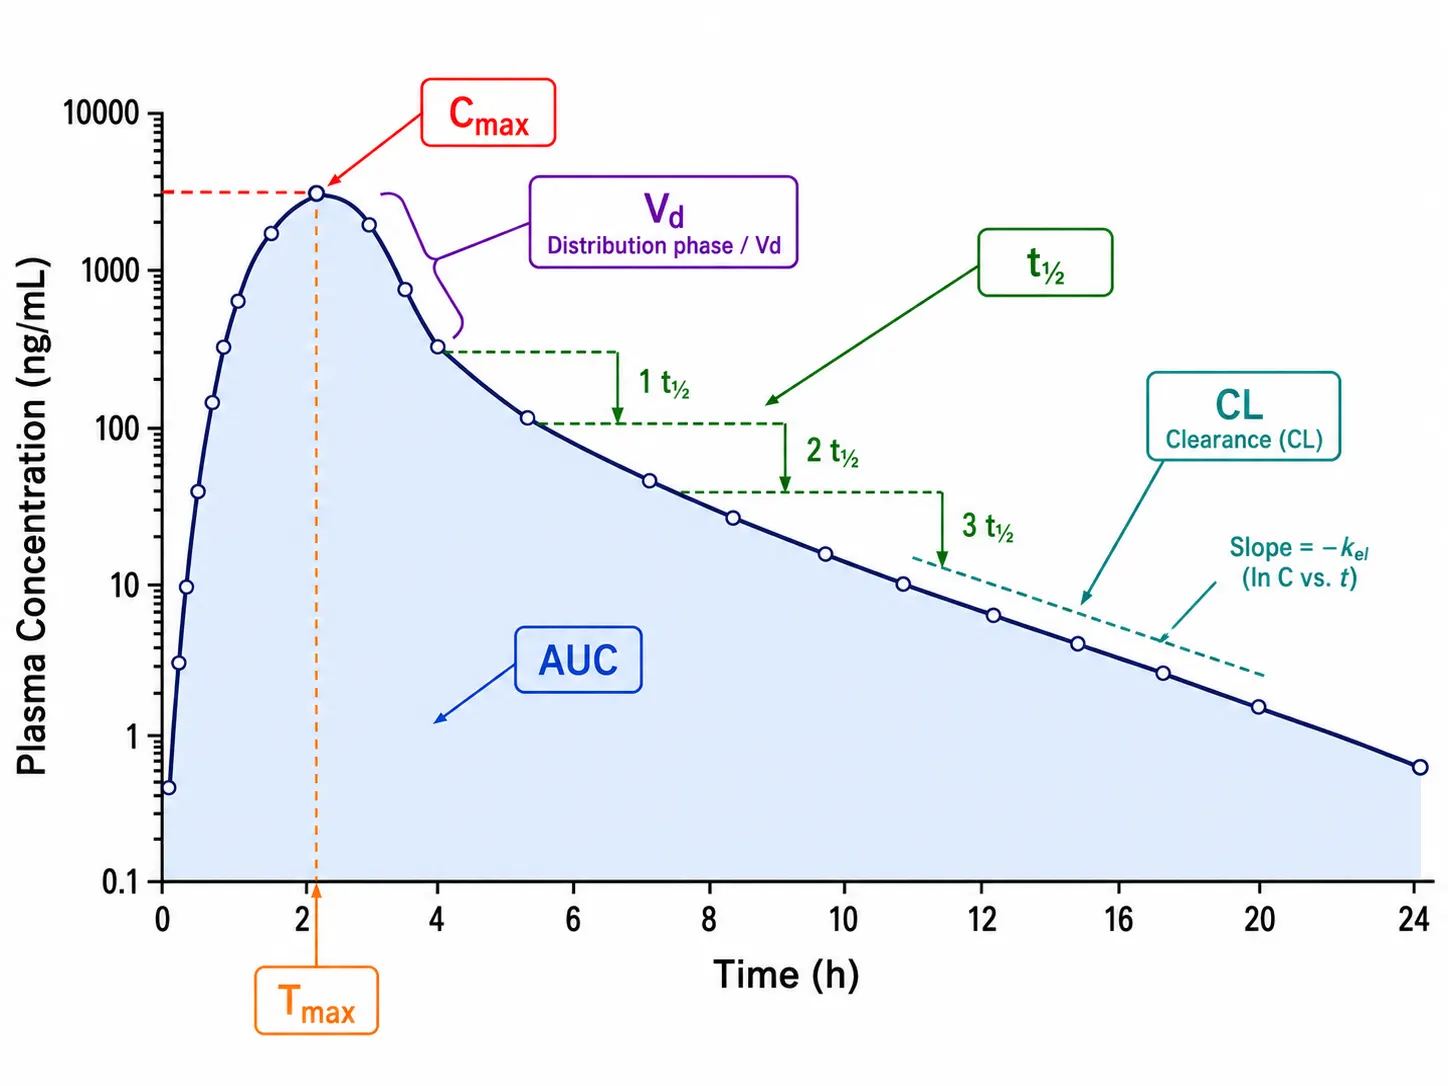 Figure 2: Concentration-Time Curve with Six PK Parameters Labeled — Cmax (peak), Tmax (peak time), AUC (shaded area under curve), t½ (concentration halving intervals on terminal slope), Vd (annotated as distribution phase), CL (annotated as slope of elimination)
Volume of Distribution — Vd
Volume of distribution is a theoretical number — it does not correspond to any real anatomical compartment. Vd relates the amount of drug in the body to the plasma concentration: Vd = Amount in Body / Plasma Concentration. It is calculated after intravenous dosing as Vd = Dose / (kel × AUC₀→∞) or, more commonly, as Vd_ss (volume at steady state) from the product of clearance and mean residence time.
What Vd tells you: where the drug goes — whether it stays in plasma or distributes extensively into tissues. A Vd of 3-5 L (approximately plasma volume) indicates the drug is largely confined to the vascular space, typically due to high plasma protein binding. A Vd of 15-20 L (extracellular fluid volume) indicates distribution into interstitial spaces. A Vd of 40-50 L (total body water) indicates distribution throughout all body water compartments. A Vd of hundreds or thousands of liters indicates extensive tissue binding — the drug concentrates in tissues far more than in plasma. Lipophilic basic drugs routinely show Vd values exceeding 500 L. Plasma protein binding is the dominant modulator of Vd: a drug that is 99% bound to albumin has approximately 100× higher plasma concentration than tissue concentration at equilibrium because only the free fraction distributes.
For the bioanalyst, Vd has a practical consequence: drugs with large Vd often have low plasma concentrations that challenge LLOQ requirements, especially at later time points. A method developed for early time points may lack the sensitivity needed for the terminal phase of a high-Vd drug. When standard methods fail to achieve the required LLOQ for high-Vd compounds, our custom LC-MS/MS method development services provide optimized extraction protocols, column chemistries, and MS parameters to push LLOQ down by 5- to 20-fold relative to generic methods.
Clearance — CL
Clearance is the volume of plasma completely cleared of drug per unit time. It is the single most important PK parameter for determining dose. CL = Dose / AUC₀→∞ after intravenous dosing, or CL/F (apparent clearance) after oral dosing where bioavailability is unknown.
Clearance is additive across elimination pathways: CL_total = CL_renal + CL_hepatic + CL_other. Renal clearance involves glomerular filtration, tubular secretion, and tubular reabsorption. Hepatic clearance depends on liver blood flow, intrinsic metabolic capacity, and plasma protein binding.
What CL tells you: the maintenance dose rate required to achieve a target steady-state concentration. Dosing Rate = C_ss,target × CL / F. If clearance is halved by a drug-drug interaction or organ impairment, the dose must be halved to maintain the same exposure. For drugs with high hepatic extraction ratio (flow-limited clearance), changes in liver blood flow directly change clearance. For drugs with low hepatic extraction (capacity-limited clearance), changes in intrinsic enzyme activity or protein binding are the dominant drivers.
For the bioanalytical lab, clearance determines the concentration range the method must cover. A high-clearance drug produces a wide concentration range (high Cmax, low terminal concentrations), requiring a wide calibration range and low LLOQ. A low-clearance drug with a long half-life produces a narrower concentration range, shifting the analytical challenge from range width to long-term stability and ISR across storage intervals. Clearance is also the parameter most affected by drug-drug interactions and pharmacogenetic variation — when metabolite profiling is needed to interpret unexpected clearance changes, our high-resolution metabolite quantification services provide simultaneous parent-metabolite profiling to distinguish metabolic from non-metabolic clearance pathways.
Why Plasma, Not Whole Blood or Serum?
Plasma is the default matrix for small-molecule PK for two reasons: physiology and practicality.
Physiologically, drug distributes between plasma and blood cells. If a drug partitions into red blood cells — as many lipophilic bases do — whole-blood concentrations will overestimate the pharmacologically relevant concentration because only free drug in plasma water equilibrates across capillary walls to reach the site of action. Plasma is the physiologically relevant compartment for most drugs.
Practically, plasma produces cleaner extracts than whole blood. Red blood cell lysis releases hemoglobin, phospholipids, and intracellular enzymes — all of which degrade the analyte, foul the ion source, and suppress ionization. Removing cells before freezing avoids hemolysis during the freeze-thaw cycle. Whole blood stability is required by ICH M10 only in specific circumstances — when the analytical method cannot separate plasma within 30 minutes of collection, or when the drug binds extensively to red blood cells.
Serum vs Plasma. Serum is obtained by allowing blood to clot before centrifugation. During clotting, platelets release proteins and metabolites, fibrinogen is consumed, and drug can adsorb to or be trapped within the clot. For drugs that bind to fibrinogen or platelets, serum concentrations can differ from plasma concentrations by 10-30%. Plasma with K2EDTA avoids the clotting variable entirely and is preferred in regulatory bioanalysis. The determination of whether plasma vs serum is appropriate for a specific drug involves measuring concentrations from split samples in both matrices from the same donor. For a full discussion of matrix selection, including specific anticoagulant effects on LC-MS/MS quantification, see our guide on matrix effects in LC-MS/MS bioanalysis. Matrix choice also directly impacts internal standard selection — the IS must track the analyte's behavior in the chosen matrix across all sample preparation and ionization conditions. Our internal standard selection and optimization services provide SIL-IS sourcing and matrix-specific feasibility testing for plasma, serum, whole blood, urine, and tissue matrices.
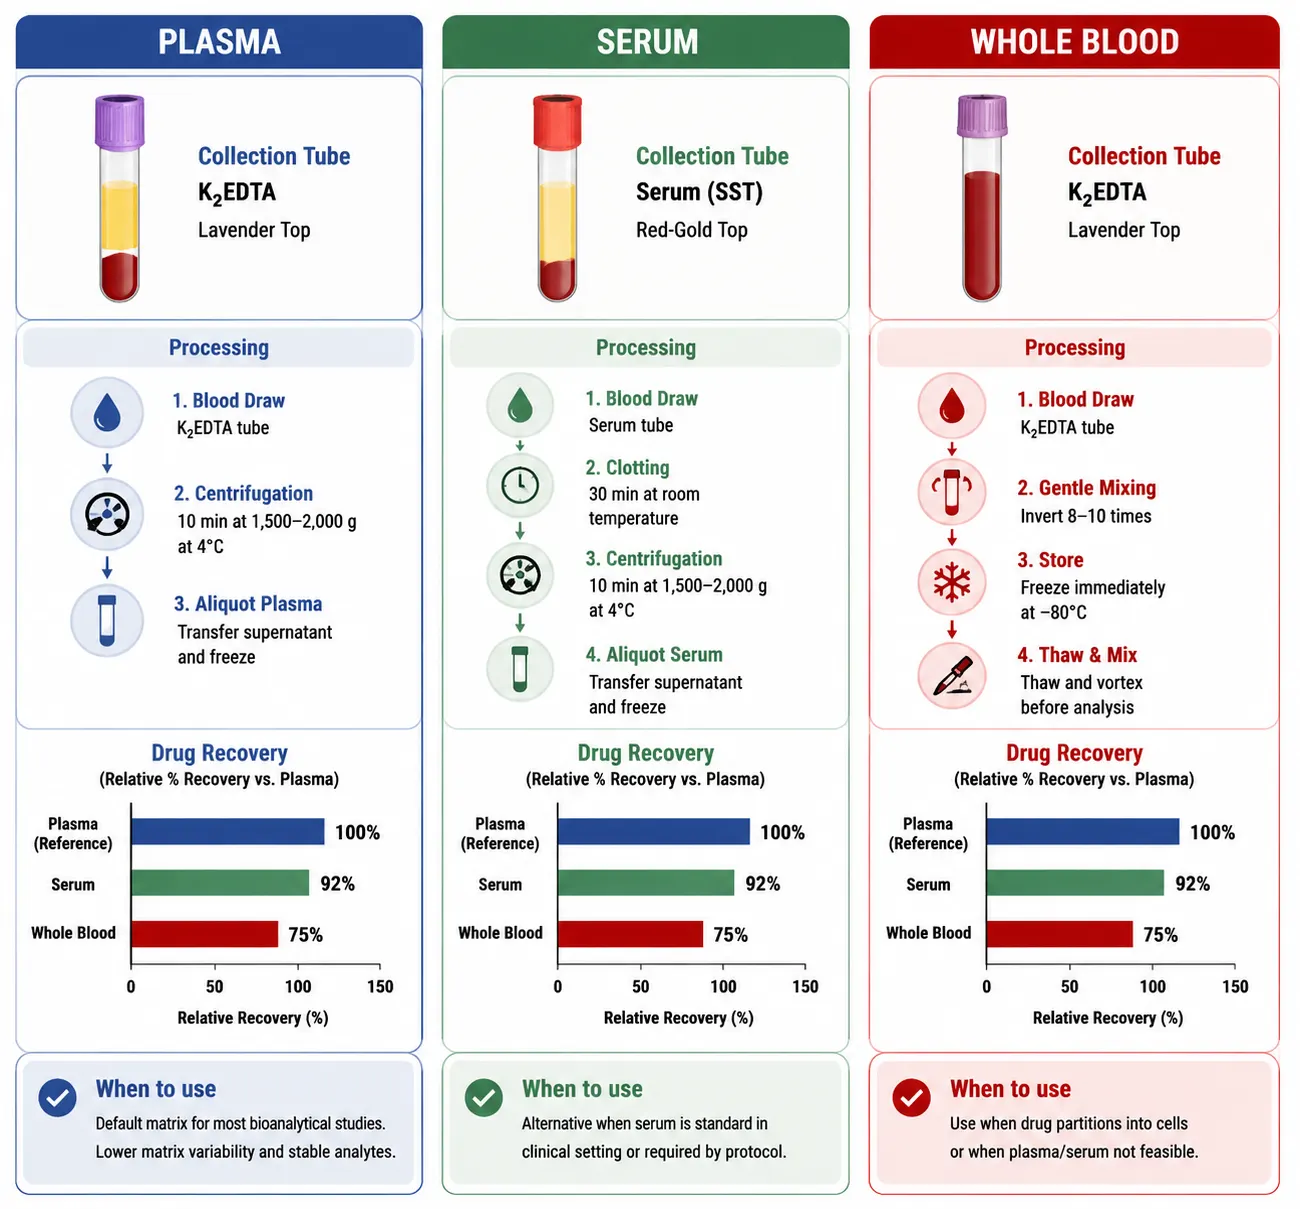 Figure 3: Plasma vs Serum vs Whole Blood Comparison — Collection Tube Types (K2EDTA, Li-Heparin, Serum Clot Activator), Processing Steps, Drug Recovery Differences, and When Each Matrix Is Appropriate
From Raw Data to PK Report: A Real Concentration Table
The LC-MS/MS produces a peak area. The calibration curve converts peak area to concentration. The concentration at each time point goes into a table. The table goes to the PK analyst. Here is what the data actually looks like — a representative concentration-time dataset from a single oral 50 mg dose of a hypothetical small-molecule drug in a healthy volunteer:
| Time (h) |
Plasma Concentration (ng/mL) |
| 0.0 |
0.0 (Below LLOQ) |
| 0.5 |
47.3 |
| 1.0 |
128.6 |
| 1.5 |
189.2 |
| 2.0 |
215.4 ← Cmax |
| 3.0 |
187.1 |
| 4.0 |
145.8 |
| 6.0 |
82.3 |
| 8.0 |
45.6 |
| 12.0 |
22.1 |
| 24.0 |
5.8 |
| 36.0 |
1.2 (Below LLOQ) |
From these 12 data points, the PK analyst calculates: Cmax = 215.4 ng/mL, Tmax = 2.0 h, AUC₀→last = 1857 ng·h/mL (trapezoidal sum), AUC₀→∞ = 1908 ng·h/mL (with terminal extrapolation contributing 2.7%), t½ = 6.1 h, CL/F = 26.2 L/h, Vd/F = 231 L.
Each row in that table represents one blood draw, one centrifugation, one sample preparation, one LC-MS/MS injection. The bioanalytical scientist's job is to ensure that every number in the "Concentration" column is accurate — that no number is biased by matrix effect, carryover, instability, or integration error. A 10% error in the 2.0-hour concentration changes Cmax. A 10% error in each of the last three time points changes the terminal slope differently than a 10% error in the first three — and shifts t½ and AUC_extrapolated.
The concentration table is the foundation. Every PK parameter is downstream of it. The most sophisticated PK model cannot fix inaccurate concentration data. For quantitative plasma and serum analysis supporting PK studies across preclinical and clinical phases, our LC-MS/MS plasma and serum drug quantification services provide validated methods covering calibration ranges from pg/mL to µg/mL with full ICH M10 compliance.
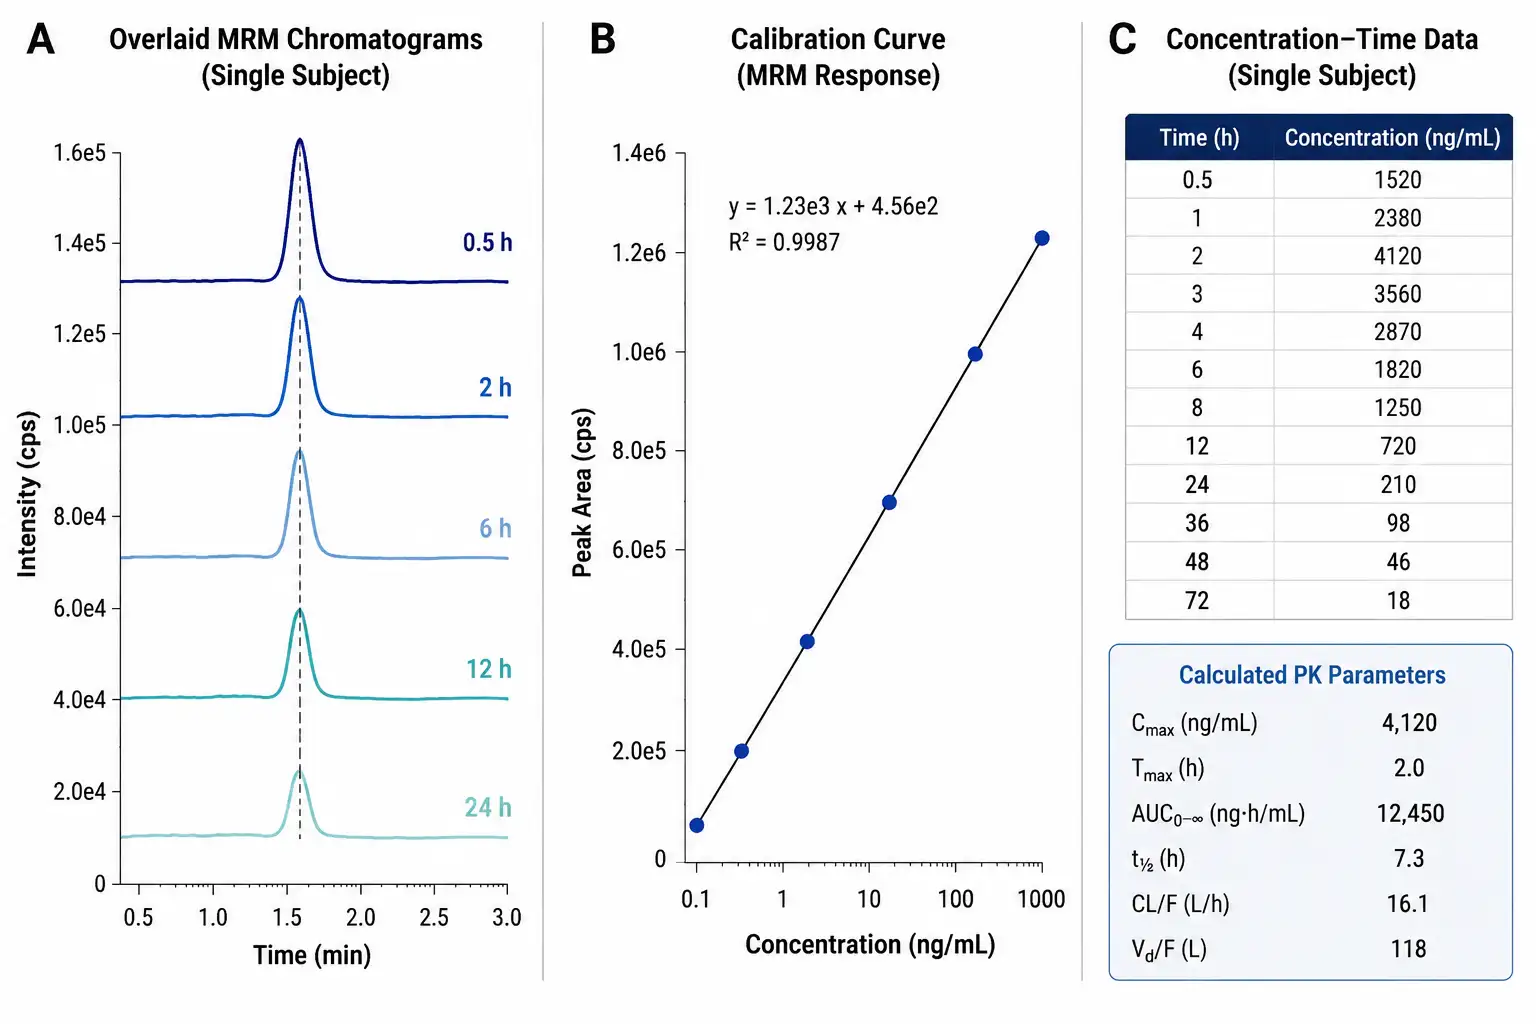 Figure 4: From Raw LC-MS/MS Chromatogram to Concentration Table — Representative MRM chromatograms at 5 time points showing declining peak area, corresponding calibration curve, and the compiled concentration-time table
Frequently Asked Questions
What is the difference between plasma concentration and whole blood concentration?
Plasma concentration measures drug in the liquid fraction of blood after cells have been removed by centrifugation. Whole blood concentration measures drug in both plasma and blood cells. For most small-molecule drugs, plasma concentration is the relevant parameter because only free drug in plasma water equilibrates with tissues. If a drug partitions extensively into red blood cells, whole blood concentration can be 2-10× higher than plasma concentration — but this does not mean more drug is available to tissues, because RBC-bound drug does not cross capillary walls.
Why are PK samples centrifuged at 4°C?
To slow enzymatic degradation. Blood and plasma contain esterases, proteases, and other enzymes that continue to metabolize the drug ex vivo after collection. Cooling to 4°C slows this activity by approximately 2-3× relative to room temperature. For prodrugs and ester-containing compounds that are particularly susceptible to ex vivo hydrolysis, the collection-to-centrifugation interval at 4°C can make the difference between accurate concentrations and a 30-50% negative bias.
What does AUC actually tell you that Cmax doesn't?
Cmax tells you the peak exposure — the highest concentration the body experiences at one moment. AUC tells you total exposure over time — the cumulative drug burden. Two formulations can have the same Cmax but different AUC if one is absorbed more completely or eliminated differently. Conversely, an extended-release formulation deliberately reduces Cmax while maintaining AUC. Bioequivalence requires both parameters to match within the 80-125% confidence interval. For efficacy, AUC is often more predictive than Cmax because drug effect usually depends on total exposure, not peak level. For safety, Cmax is often more predictive because toxicity frequently relates to peak concentration exceeding a threshold.
Why does half-life determine dosing frequency?
Because half-life determines how much drug remains at the end of each dosing interval. After one half-life, 50% remains. After two half-lives, 25%. After three, 12.5%. After four, 6.25%. If a drug is dosed once every half-life, the trough concentration is 50% of the peak concentration — a 2:1 peak-to-trough ratio, which is within acceptable fluctuation for most drugs. If dosed every two half-lives, the ratio is 4:1. If dosed every four half-lives, the ratio is 16:1 — potentially falling below the minimum effective concentration before the next dose. Dosing at intervals approximating the half-life maintains concentrations within a therapeutically useful range.
My compound showed a Vd of 800 L — is that an error?
Not necessarily. Vd values of hundreds or even thousands of liters are common for lipophilic basic drugs that bind extensively to tissue membranes and phospholipids. Amiodarone has a Vd of approximately 5000 L; chloroquine approximately 15000 L. These values are not errors — they reflect the physicochemical reality that at equilibrium, 99.9%+ of the drug in the body is in tissues, not plasma. A Vd of 800 L simply means that if you were to extract all drug from the body at a given moment and dissolve it in a single compartment at the prevailing plasma concentration, you would need an 800 L tank. That is the definition of an "apparent" volume — it is a proportionality constant, not a physical space.
Can I use the same calibration curve for plasma and urine samples?
No. Plasma and urine have fundamentally different matrix compositions — urine has high salt, variable pH, and vastly lower protein content. The matrix effect profile is different. ICH M10 requires separate matrix effect evaluation for each matrix type. At minimum, validate a separate calibration curve in urine with urine-specific QCs. If the analyte concentration in urine is expected to be 50-200× higher than plasma, a separate dilution QC validation is required as well. For the complete method validation requirements across different biological matrices, see our guide on ICH M10 bioanalytical method validation.
References
- Benet LZ, Zia-Amirhosseini P. Basic principles of pharmacokinetics. Toxicologic Pathology. 1995;23(2):115-123. (Updated NCBI Bookshelf version.)
- Krishna R, Yu R. An ABC of PK/PD. Open Education Alberta. 2023. CC BY 4.0.
- Benet LZ, Sodhi JK. Simplifying pharmacokinetics, applying it to drug and dosage form development, and making drug dosage decisions in clinical medicine: the adaptation of Kirchhoff's laws from physics. The AAPS Journal. 2025;27:53. CC BY 4.0.
- U.S. Food and Drug Administration. Bioavailability and Bioequivalence Studies Submitted in NDAs or INDs — General Considerations. FDA Guidance for Industry; 2019.
- European Medicines Agency. ICH Guideline M10 on Bioanalytical Method Validation and Study Sample Analysis. EMA/CHMP/ICH/172948/2019; 2022.
- Bacila CI, Macavei BM, Cornea M, et al. UHPLC-MS/MS for antipsychotic drug monitoring: a systematic review of clinical and analytical performance. Journal of Clinical Medicine. 2025;14(21):7544. CC BY 4.0.
- Cai H, Xing X, Su Y, Yang C. Innovative applications and future perspectives of chromatography-mass spectrometry in drug research. Frontiers in Pharmacology. 2025;16:1529468. CC BY 4.0.
- Myler H, Evans C, Garofolo F, et al. ICH M10 Bioanalytical Method Validation Guideline — 1 Year Later. The AAPS Journal. 2024;26:103. CC BY 4.0.
Disclaimer: All services and resources mentioned on this site are for research use only (RUO) and are not intended for diagnostic, therapeutic, or clinical applications.
Related Services


