Every bioanalytical method starts with a decision that most method development protocols treat as a given: plasma or serum? The choice of blood-derived matrix — and the anticoagulant, collection tube, and handling protocol that follow from it — determines which drug concentrations you measure and how reliably you measure them. A method that performs flawlessly with EDTA plasma from one collection tube brand can produce systematically biased results with heparin plasma, serum from gel separator tubes, or the same EDTA plasma collected in tubes from a different manufacturer. This article covers the chemistry behind anticoagulant-specific ion source effects, the pre-analytical variables between venipuncture and autosampler injection, and how to build a stability protocol that withstands regulatory scrutiny.
Plasma or Serum? The First Decision in Bioanalytical Method Design
Plasma and serum are not interchangeable matrices. Plasma is the liquid fraction of anticoagulated whole blood after centrifugation — clotting factors remain intact, fibrinogen is present, and the protein composition closely mirrors circulating blood. Serum is the liquid remaining after whole blood has clotted, a process that requires 30-60 minutes at room temperature. During clotting, platelets degranulate and release intracellular contents, the coagulation cascade consumes fibrinogen, and proteases activated during the clotting cascade can degrade peptide analytes. For foundational concepts in plasma drug concentration measurement, see our article on plasma drug concentration fundamentals.
For most small-molecule LC-MS/MS assays in drug development, plasma is the default choice for three reasons. First, plasma processing is faster — centrifuge immediately after collection, no clotting wait required. This shorter processing window preserves labile analytes and reduces ex vivo metabolism. Second, plasma drug concentrations more closely represent the in vivo circulating drug profile because the sample has not undergone the enzymatic and cellular changes inherent to clotting. Third, the Human Proteome Organization (HUPO) formally recommends plasma (specifically EDTA plasma) over serum for quantitative proteomic and metabolomic studies, a recommendation that has influenced bioanalytical practice across the pharmaceutical industry.
When might serum be acceptable? Three scenarios: biobank archives where only serum is available and recollection is impossible, analytes proven stable through the clotting process with formal validation data, and certain clinical chemistry analytes with established serum reference ranges. Even in these cases, plasma and serum concentrations cannot be assumed equivalent. Brown (2024, Biomedical Chromatography) demonstrated that transitioning between plasma/serum and low-protein matrices causes inconsistent analyte recovery that can be mistaken for signal suppression or drug instability. Protein content differences between matrices mean that a calibration curve prepared in plasma may not accurately quantify serum samples — and vice versa. If your method was validated in plasma and you later need to analyze serum samples, a partial validation including matrix comparison is required under ICH M10. For methods requiring cross-validation between plasma and serum matrices, our bioanalytical method development and validation services include systematic matrix comparison and cross-validation per ICH M10 requirements.
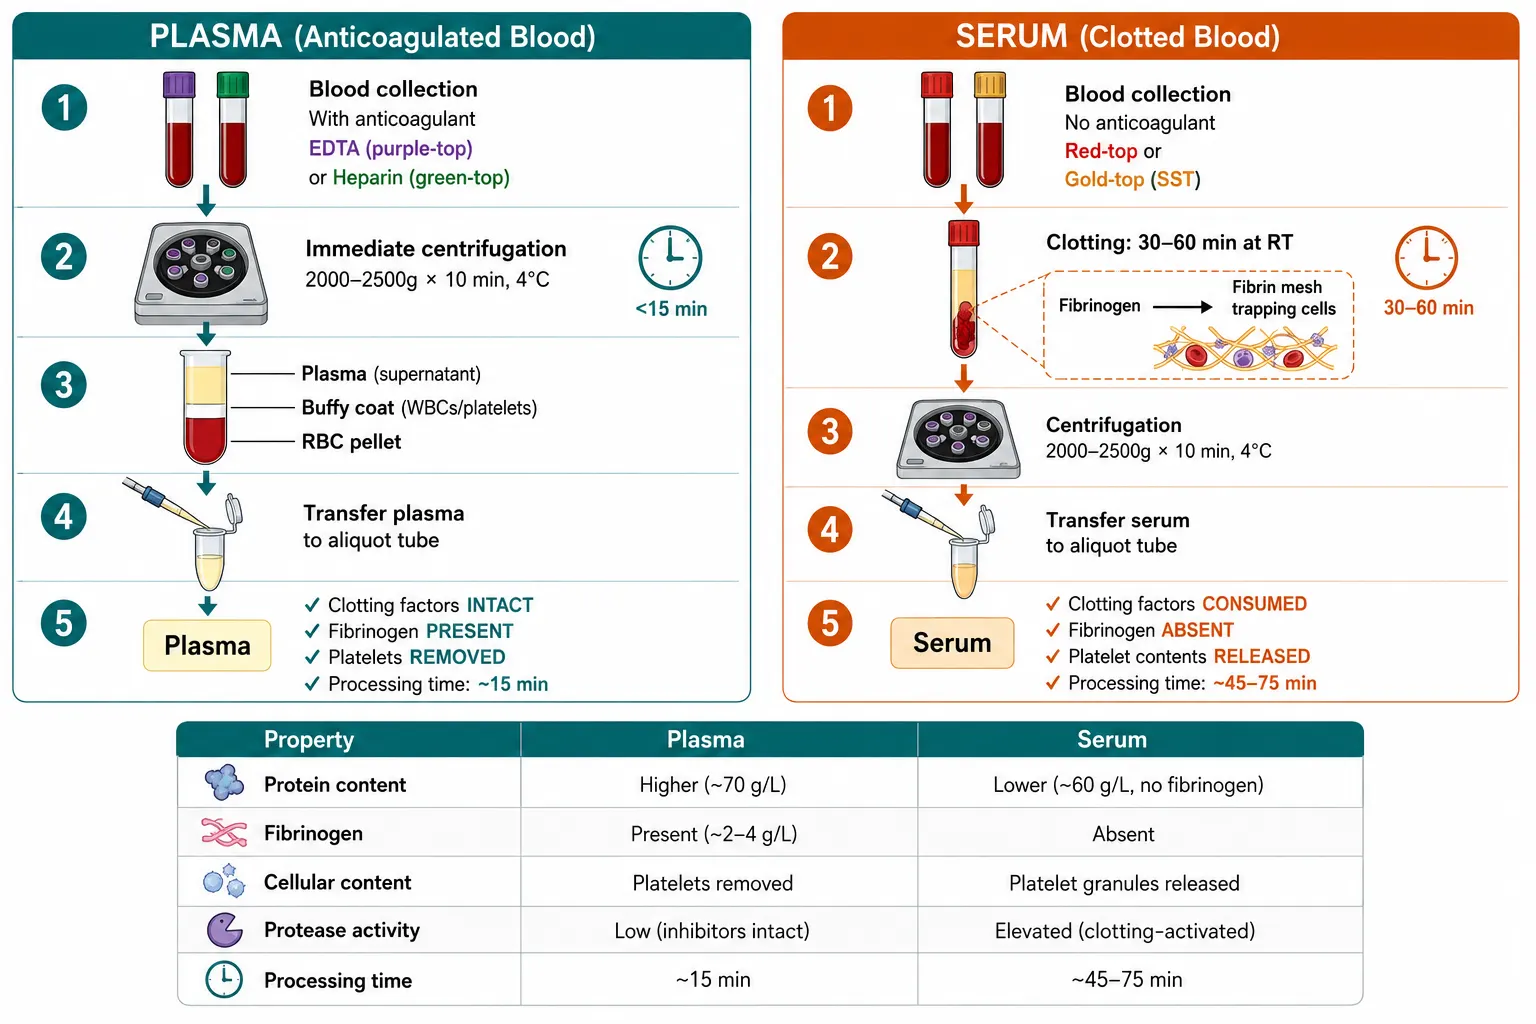 Figure 1: Plasma vs serum collection workflow comparison. Two parallel vertical flow diagrams: (A) Plasma pathway — blood drawn into anticoagulant tube (EDTA/heparin/citrate), immediate centrifugation (2000-2500g × 10 min, 4°C), plasma supernatant harvested, clotting factors intact, fibrinogen present, platelets removed; (B) Serum pathway — blood drawn into serum tube (with or without clot activator), 30-60 min clotting at RT, centrifugation, serum supernatant harvested, clotting factors consumed, fibrinogen absent, platelet contents released. An inset table compares protein composition, cellular content, processing time, and typical applications for each matrix.
Anticoagulant Chemistry: How EDTA, Heparin, and Citrate Affect Your LC-MS/MS Assay
The choice of anticoagulant is the single most consequential pre-analytical decision for LC-MS/MS bioanalysis — yet most method development reports treat it as a trivial detail. Each anticoagulant introduces distinct chemical species that interact with the electrospray ionization (ESI) source in predictable, mechanistically specific ways. Understanding these mechanisms allows you to anticipate problems before they appear in your chromatograms.
EDTA (K₂/K₃)
EDTA chelates Ca²⁺ ions to prevent coagulation. The bioanalytical consequence is not the chelation itself but the counter-ion: potassium. When the mobile phase contains 0.1% formic acid — the most common additive for reversed-phase LC-MS/MS of small molecules — formate ions (HCOO⁻) combine with K⁺ from the EDTA tube to form potassium formate ion clusters ([HCOOK+HCOO]⁻). These clusters compete for surface charge at the ESI droplet during the ion evaporation process, causing broad-spectrum ion suppression that disproportionately affects polar analytes eluting in the early retention time window. If your analyte elutes early (high aqueous mobile phase), EDTA-related suppression is a bigger concern than if it elutes in the organic-rich region. When EDTA-related ion suppression compromises early-eluting analyte sensitivity, our sample preparation optimization services can reduce matrix effects through tailored extraction protocols.
Heparin (Li/Na)
Heparin inhibits thrombin via antithrombin III activation. It is a highly sulfated glycosaminoglycan that — counterintuitively — produces the least matrix effect for hydrophilic compounds among the three anticoagulants. Barri and Dragsted (2013, Analytica Chimica Acta) demonstrated in untargeted UPLC-ESI-QTOF/MS profiling that heparin plasma showed minimal interferences for polar metabolites, recommending it as the preferred anticoagulant for LC-ESI/MS-based metabolomics of hydrophilic compounds. However, heparin enhances ionization of endogenous phospholipids and triglycerides, potentially creating isobaric interference in the lipophilic retention window. This lipid enhancement is not a suppression problem — it can produce false-positive signal at the analyte MRM transition if a co-eluting lipid shares the same precursor→product ion pair. For assays where lipid interference cannot be resolved chromatographically, our internal standard selection services provide stable isotope-labeled analogs that track analyte-specific matrix effects.
Citrate
Citrate reversibly chelates Ca²⁺ and is supplied as a liquid solution (typically 3.2% or 3.8% sodium citrate). Two problems compound: first, Na⁺ from the citrate solution forms sodium formate clusters in the ESI source analogous to the potassium formate clusters from EDTA, but with a larger ion population because citrate tubes contain more Na⁺ than EDTA tubes contain K⁺. Second, the liquid citrate solution dilutes the blood sample by approximately 10% — a systematic negative bias in measured drug concentration unless the dilution factor is explicitly corrected. For quantitative drug analysis, citrate is not recommended.
The magnitude of these anticoagulant effects is not subtle. Gonzalez-Covarrubias et al. (2013, Metabolomics) profiled 80 endogenous plasma lipids across EDTA, heparin, and citrate anticoagulants: 70 of 80 lipid species showed statistically significant peak area differences between anticoagulant types. Only 10 lipid species produced comparable results across all three. Correction by structurally matched internal standards only partially eliminated the differences (ANOVA p < 0.001). The practical implication is clear: calibrators and quality control samples must be prepared in the same anticoagulant matrix as study samples. When developing methods intended for multiple anticoagulant types, our custom LC-MS/MS method development services include systematic anticoagulant cross-validation.
The ICH M10 Counter-Ion Rule
The European Bioanalysis Forum (EBF) multi-company study by Sennbro et al. (2011, Bioanalysis) evaluated 42 LC-MS/MS assays across 15 companies and 34 analytes. The finding: changing the counter-ion while keeping the same anticoagulant — K₂EDTA to K₃EDTA, or Na-heparin to Li-heparin — produced no statistically significant impact on assay precision or accuracy. The mean difference in precision for EDTA counter-ion changes was −0.7% (p = 0.06). The EBF recommendation, now codified in ICH M10: plasma samples with different counter-ions but the same anticoagulant are considered the same matrix — no partial validation required. But changing the anticoagulant itself — EDTA to heparin, heparin to citrate — requires partial or full validation. This specific, actionable regulatory detail is absent from virtually all competing CRO content on this topic. For bioanalytical methods that must accommodate multiple anticoagulant matrices, our LC-MS/MS plasma and serum drug quantification services include matrix-specific method development with anticoagulant cross-validation per ICH M10 requirements.
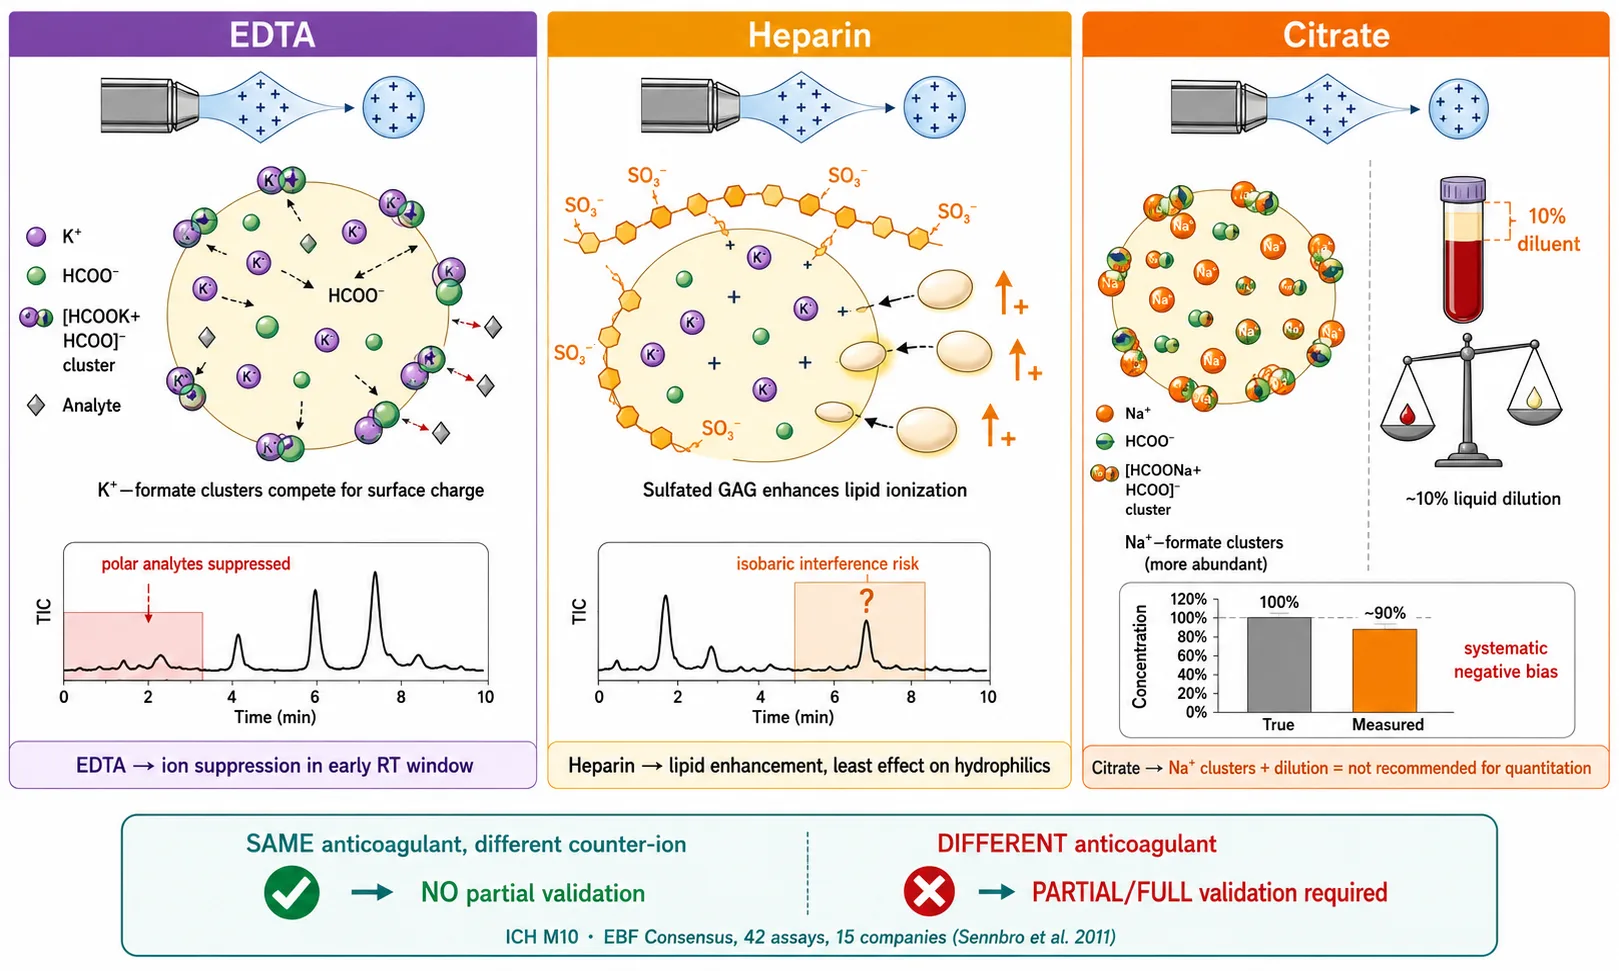 Figure 2: Three-panel anticoagulant mechanism at the ESI source. Panel A (EDTA/K⁺): a schematic ESI droplet showing K⁺ ions combining with formate (HCOO⁻) from the mobile phase → [HCOOK+HCOO]⁻ clusters competing for surface charge → broad-spectrum ion suppression affecting polar analytes. Panel B (Heparin): sulfated glycosaminoglycan chains enhancing phospholipid/triglyceride ionization → lipid-related isobaric interference in the lipophilic retention window. Panel C (Citrate/Na⁺): Na⁺ formate clusters (more abundant than K⁺ clusters) + 10% liquid dilution → systematic negative bias. Each panel includes the counter-ion rule callout: same anticoagulant, different counter-ion = no partial validation; different anticoagulant = partial/full validation required.
The Tube Matters: How Collection Hardware Silently Corrupts Results
The collection tube is not an inert container. It is a chemically active environment that can adsorb your analyte, leach interfering polymers into your sample, and introduce tube-to-tube variability that masquerades as analytical imprecision.
Gel Separator Tubes — The Lipophilic Drug Trap
Serum separator tubes (SST, gold/tiger-top) and plasma separator tubes (PST, green-top with gel) contain a silicone gel barrier that facilitates automated clinical laboratory workflows. For lipophilic drugs (logP > 3), this gel is a concentration sink. Steuer et al. (2016, Clinica Chimica Acta) systematically demonstrated that lipophilic drugs with logP > 3 are efficiently and rapidly absorbed by the silicone gel, with concentration losses reaching 20-50% within 2 hours of gel contact. Drug loss was predictable from logP, polar surface area, and protein binding — molecular descriptors routinely available during drug development. Posaconazole, sertraline, and citalopram showed clinically relevant concentration drops. Hydrophilic drugs (low logP) were unaffected. If your drug candidate is lipophilic, gel separator tubes should be excluded from the collection protocol — full stop. For lipophilic drug candidates requiring specialized collection and handling protocols, our sample preparation services include tube compatibility and anti-adsorption assessment.
Plastic Tube Polymer Leachates
Mei et al. (2003, Rapid Communications in Mass Spectrometry) documented a finding that remains underappreciated two decades later: polypropylene microcentrifuge tubes, cryogenic vials, and blood collection tubes leach polymer additives that appear as systematic LC-MS/MS interference. Phthalate plasticizers produce diagnostic ions at m/z 149 and 279. Polyethylene glycol (PEG) oligomers generate a characteristic m/z 44 repeat pattern in full-scan background spectra. These leachates co-elute in reversed-phase LC and cause ion suppression or enhancement that differs between tube brands. The diagnostic test is straightforward: extract a blank tube (add water or blank matrix, process identically to samples), run a full scan, and look for the telltale PEG or phthalate signatures. During method development, our custom LC-MS/MS method development includes systematic tube brand screening and leachate profiling to identify low-interference collection consumables.
A related problem is nonspecific binding — hydrophobic drugs (logP > 3) adsorb to polypropylene tube surfaces, especially at low concentrations near the LLOQ. Loss can exceed 50% without anti-adsorption measures. Our single drug quantification services include nonspecific binding evaluation at the LLOQ as part of routine method development. Pretreatment with bovine serum albumin (BSA), non-ionic surfactants (Tween-80, CHAPS), or use of low-binding (siliconized) tubes mitigates this loss.
The practical checklist: (a) no gel separator tubes for lipophilic drugs, (b) use the same tube brand, type, and manufacturer lot for all study samples and calibrators, (c) document manufacturer and lot number, (d) test for leachate peaks during method development with blank tube extracts, (e) evaluate nonspecific binding at the LLOQ during method development.
Pre-Analytical Variables: What Happens Between the Arm and the Autosampler
The pre-analytical phase — from venipuncture to the moment the extracted sample enters the autosampler — is where most bioanalytical errors originate and where the fewest controls are documented. Each step introduces variables that can systematically shift measured drug concentrations.
The Collection-to-Centrifugation Window
Whole blood is metabolically active. Erythrocytes continue glycolysis, leukocytes continue enzymatic activity, and analytes can be degraded, metabolized, or redistributed between plasma and cells. The blood-to-plasma concentration ratio determines the direction and magnitude of this temperature-dependent redistribution — see our article on blood-to-plasma ratio and its PK implications for a detailed treatment. Zhou et al. (2024, Clinical Chemistry and Laboratory Medicine) evaluated the stability of 65 biochemistry analytes under delayed centrifugation: glucose decreased (ongoing glycolysis), potassium increased (leakage from erythrocytes), and AST, ammonia, and LDH showed significant instability within 8 hours at room temperature. The rule of thumb: centrifuge within 2 hours of collection, keep samples at 4°C if any delay is unavoidable, and document the actual collection-to-centrifugation interval for every sample.
For drug bioanalysis specifically, Magreault et al. (2024, Therapeutic Drug Monitoring) evaluated the pre-analytical stability of 29 anti-infective agents in whole blood and plasma. All compounds were stable in whole blood for 24 hours at room temperature except meropenem and isoniazid (6 hours only). At 4°C, all compounds were stable in whole blood for 24 hours. In plasma, all compounds were stable for 6 hours at RT and 24 hours at 4°C except isoniazid. Long-term storage at −80°C preserved all compounds for 6 months. The key message: compound-specific stability data should inform your collection-to-centrifugation protocol — blanket assumptions about stability are unsafe.
Centrifugation Parameters
The standard protocol — 2000-2500g for 10 minutes at 4°C — is widely used, but consistency matters more than the absolute values. Changing the g-force, spin time, or temperature mid-study introduces systematic bias because these parameters affect the degree of platelet removal, residual cellular contamination, and temperature-dependent drug redistribution between plasma and RBCs. Document the exact centrifugation protocol and apply it uniformly to every sample in a study.
Freeze-Thaw Stability
ICH M10 requires freeze-thaw stability validation using at least three cycles at low and high QC concentrations. But the 2024 literature demonstrates that analyte-dependent degradation can begin at 1-2 cycles for labile compounds — ACTH shows approximately 12% bias after a single freeze-thaw cycle. The most impactful variable is not the number of cycles but the thaw method. Bench-top thaw at room temperature, ice-bath thaw, and overnight thaw at 4°C produce different degradation profiles for labile analytes. Define the thaw method precisely in the protocol and validate it. The simplest mitigation is to aliquot samples into single-use volumes immediately after first thaw, eliminating repeat freeze-thaw cycles entirely.
Long-Term Storage
−20°C is inadequate for many analytes. Beta-lactam antibiotics show significant degradation after 1 month at −20°C (Magreault et al., 2024). −70°C to −80°C is the accepted standard for long-term storage of plasma samples intended for quantitative drug analysis. ICH M10 requires long-term stability testing that brackets the entire study duration, from first sample collection to last sample analysis.
Whole Blood Stability — The Most Overlooked Validation Parameter
Plasma bench-top stability does not equal whole blood stability. If the collection-to-centrifugation delay exceeds the validated whole blood stability window, every concentration from those samples is analytically indefensible. ICH M10 explicitly requires whole blood stability testing when there is any delay between collection and processing. This test is frequently omitted during method validation and only catches attention during regulatory inspection.
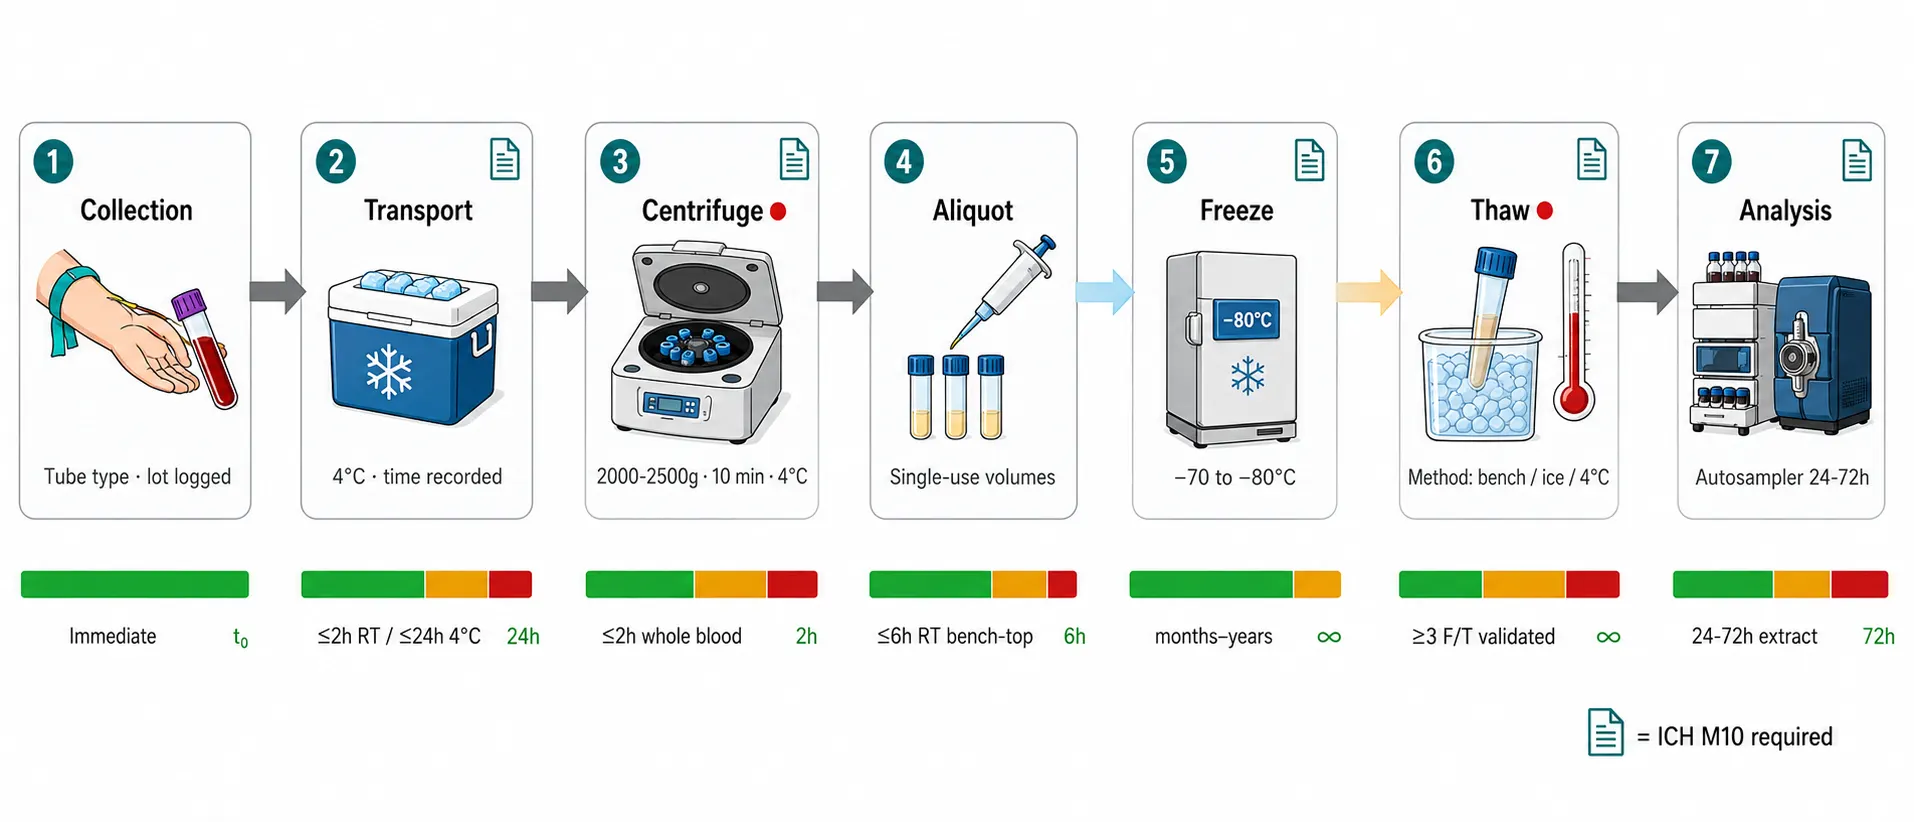 Figure 3: Pre-analytical timeline infographic. A horizontal timeline from left (venipuncture) to right (data), with seven stages connected by arrows: (1) Collection — tube type, anticoagulant, manufacturer/lot documented; (2) Transport — 4°C, time from collection recorded; (3) Centrifugation — 2000-2500g × 10 min, 4°C, time/temp logged; (4) Aliquot — single-use volumes, tube type documented; (5) Freeze — −70°C to −80°C, date/time recorded; (6) Thaw — method defined (bench/ice bath/4°C overnight), single-use preferred; (7) Analysis — autosampler stability validated. Below each stage, a stability gate shows the validated window (e.g., whole blood stability 2h at RT, plasma bench-top 6h at RT, freeze-thaw ≥3 cycles, long-term bracketing study duration). ICH M10 icons mark the required validation parameters at each gate.
Hemolyzed and Lipemic Plasma: The Worst-Case Matrices
Two visibly abnormal plasma types — hemolyzed (pink/red) and lipemic (milky/opaque) — present analytical challenges that go beyond cosmetic appearance. They introduce systematic interference mechanisms that can invalidate concentration data if not recognized and managed.
Hemolyzed Plasma
Hemolysis occurs when erythrocytes rupture during collection or processing, releasing hemoglobin at approximately 150 mg/mL intracellular concentration into the plasma. The interference is twofold. First, iron-porphyrin (heme) can produce direct MRM interference if its fragment ions coincide with the analyte transition — this is compound-specific and must be checked during method development. Second, and more broadly, the massive protein load from released hemoglobin competes for surface charge at the ESI droplet, causing broad-spectrum ion suppression that can affect analytes across the chromatographic run. Visual detection is possible at approximately 0.2-0.5 g/L free hemoglobin (faint pink tint), but interference can occur below visual detection thresholds.
ICH M10 requires evaluation of hemolyzed matrix (≥2% v/v hemolysis, at least one lot) during selectivity and matrix effect assessment. The strategy for hemolyzed samples: (a) don't reject samples outright unless severely hemolyzed, (b) note the hemolysis grade (slight/moderate/gross) in the analytical report, (c) if interference at the analyte retention time exceeds 20% of the LLOQ response, the sample is non-reportable for that analyte, (d) HybridSPE phospholipid removal plates or additional SPE cleanup can salvage moderately hemolyzed samples.
Lipemic Plasma
Lipemia results from elevated triglycerides and chylomicrons in postprandial samples, certain disease states, or patients receiving lipid emulsions (e.g., propofol, parenteral nutrition). The interference mechanism is distinct from hemolysis: lipid microdroplets form in the ESI spray, causing sporadic and unpredictable ion suppression that does not manifest consistently in standard matrix effect testing — which typically uses fasted, normolipidemic plasma lots. This is the reason ICH M10 separately requires evaluation of hyperlipidemic matrix (at least one lot) in addition to normal matrix lots.
For visibly lipemic samples, protein precipitation is insufficient because lipids co-precipitate incompletely. Liquid-liquid extraction (LLE) with hexane or methyl tert-butyl ether removes lipids effectively. Solid-phase extraction with a strong organic wash (≥60% methanol or acetonitrile) can also reduce lipid load. For lipemic samples requiring specialized lipid-depletion workflows, our complex biological matrices analysis services provide validated extraction protocols that eliminate lipid-induced ion suppression. If a drug concentration appears unexpectedly low in a lipemic sample relative to surrounding time points, suspect lipid-induced ion suppression before suspecting a PK anomaly. Distinguishing analytical artifacts from true pharmacokinetic events requires careful curve examination — see our article on plasma concentration-time curve interpretation for a systematic approach.
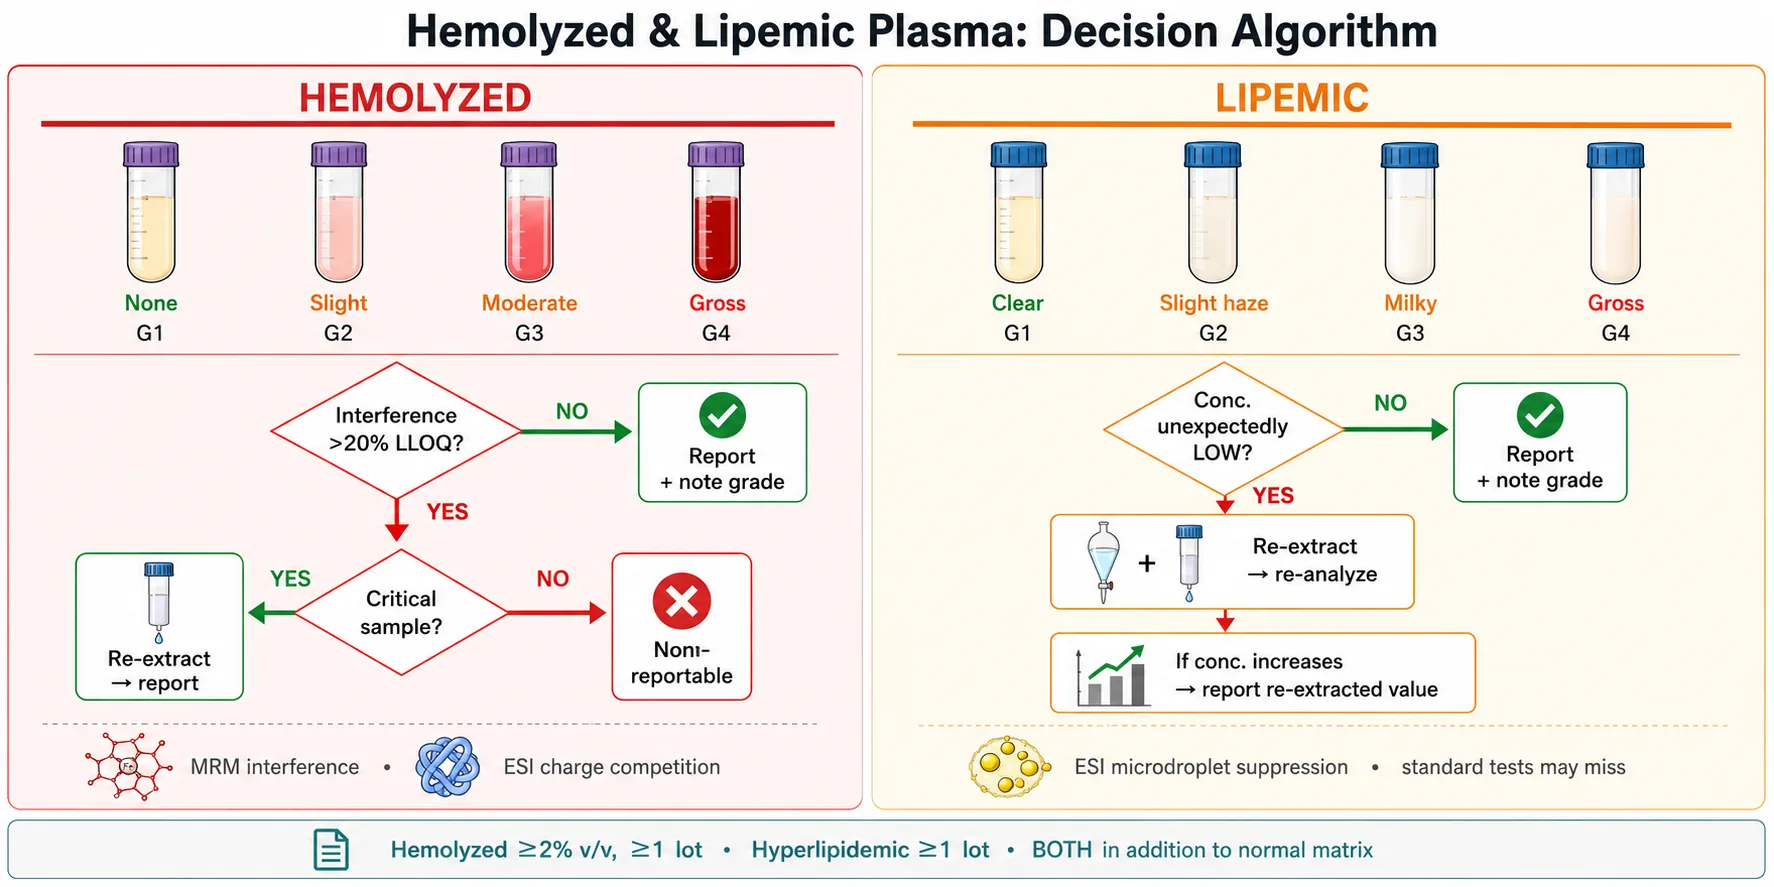 Figure 4: Hemolysis and lipemia decision flowchart. A two-branch decision tree: Left branch (Hemolyzed) — visual grade (none/slight/moderate/gross) → MRM interference check (response at analyte RT vs blank) → if interference <20% LLOQ, report with note; if >20% LLOQ, retreat with HybridSPE or flag as non-reportable. Right branch (Lipemic) — visual grade (clear/slightly milky/opaque) → check if concentration is unexpectedly low vs adjacent time points → if low, suspect lipid suppression → LLE or SPE re-extraction → re-analyze. Decision boxes use amber/red color coding for increasing severity.
Building a Stability Protocol That Survives Audit
A stability protocol that satisfies ICH M10 is not a one-size-fits-all checklist. It must be tailored to the specific analyte, matrix, anticipated study logistics, and regulatory context.
The full ICH M10 stability suite includes: (1) stock and working solution stability — covers the entire duration from preparation to last use; (2) whole blood stability — required if any delay between collection and centrifugation, tested at the anticoagulant and temperature used in the study; (3) bench-top (matrix) stability — tested in the matrix at room temperature and at the processing temperature (typically 4°C), covering the maximum time samples sit on the bench during processing; (4) freeze-thaw stability — at least three cycles, low and high QC concentrations, using the defined thaw method; (5) long-term storage stability — at the intended storage temperature (−70°C to −80°C), duration bracketing the entire study, tested at low and high QCs; (6) autosampler/processed extract stability — covering the maximum time extracted samples reside in the autosampler (typically 24-72 hours for large batches), tested at low and high QCs; (7) reinjection reproducibility — ICH M10 requires testing reinjection of low, medium, and high QCs (not just low and high) to cover the entire calibration range.
Each stability test must use freshly prepared comparator QCs at each time point — comparing degraded samples against a stored calibration curve is circular logic. At minimum, test at low and high QC concentrations. Three to five replicates per level per time point is standard. Testing only at high QC is a critical deficiency that will be noted in regulatory review.
Stability transfer across facilities is permitted under ICH M10: if stability has been established at one facility, it does not need to be repeated at another facility for the same method. This provision is frequently unknown to sponsors and can save weeks of redundant validation work. For stability protocol development and execution under ICH M10, our method validation services cover the full stability suite including whole blood stability, freeze-thaw validation, and long-term storage bracketing.
The pre-study checklist: (a) Has whole blood stability been tested under the exact conditions (anticoagulant, temperature, time) that will be used in the study? (b) Are collection tubes documented by manufacturer, product code, and lot number? (c) Is the centrifugation protocol documented (g-force, time, temperature) and consistent? (d) Are aliquots prepared as single-use volumes? (e) Has autosampler stability been tested at the worst-case batch duration plus requeue delay? (f) Has freeze-thaw stability been tested using the exact thaw method specified in the protocol?
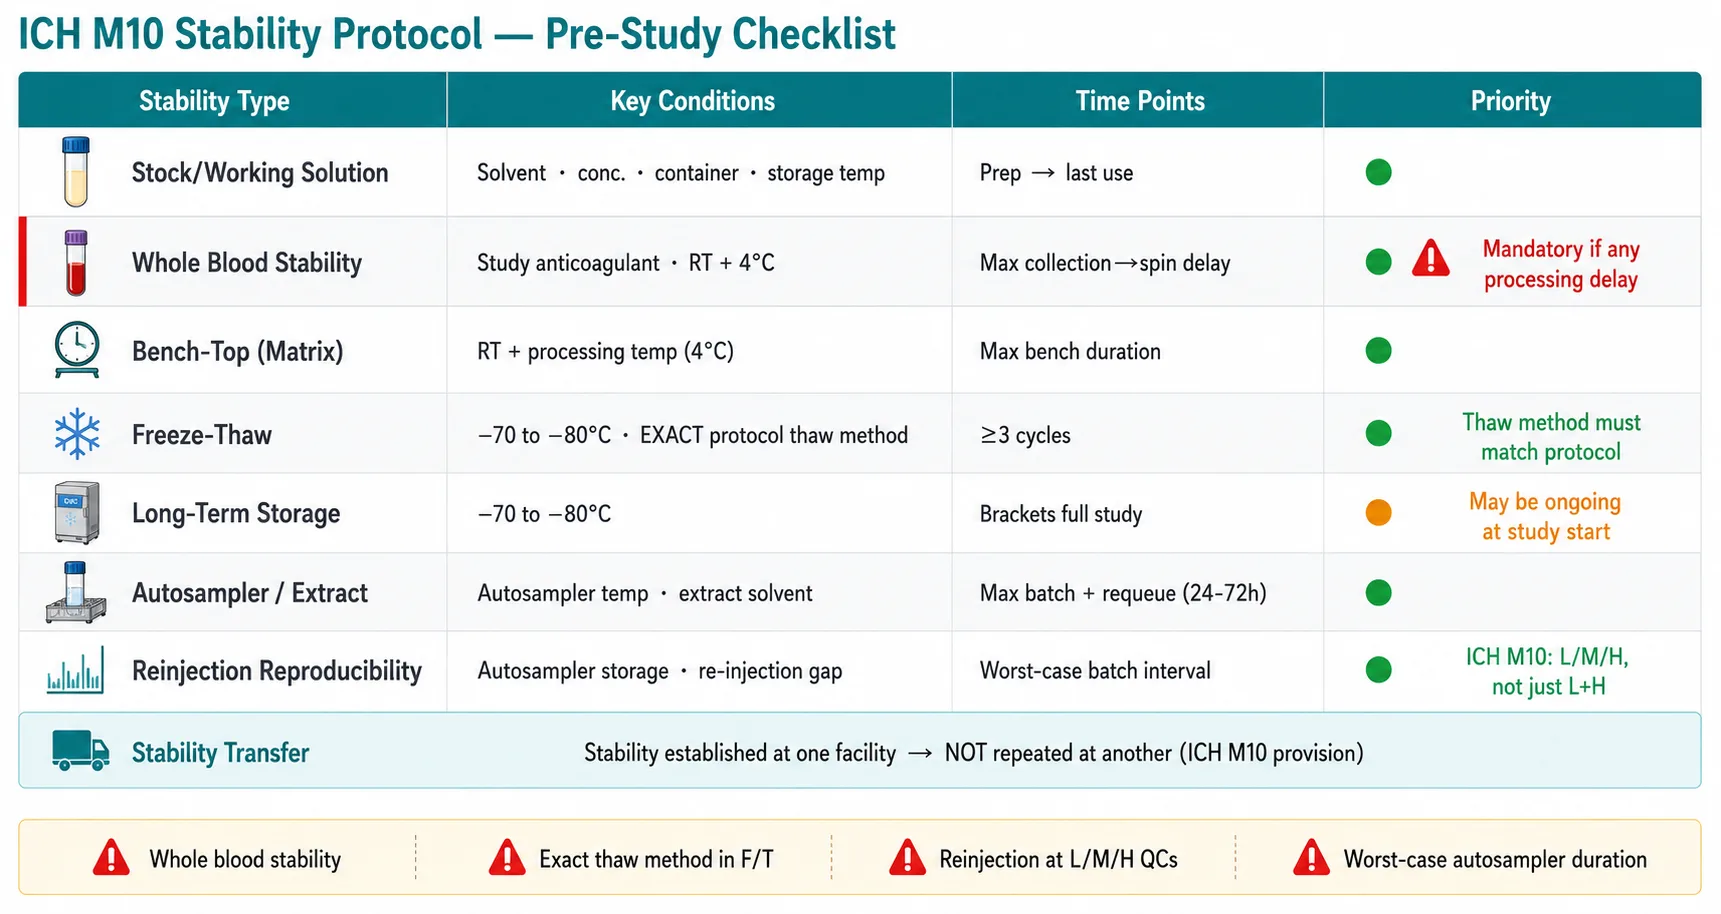 Figure 5: Stability protocol checklist diagram. A master checklist organized into 7 rows (stock solution, whole blood, bench-top, freeze-thaw, long-term, autosampler, reinjection) × 5 columns (test condition, QC levels, time points, replicates, acceptance criteria). Each row is color-coded: green = must be tested before study start, amber = may be tested concurrently, red = commonly overlooked. ICH M10 section references in a narrow right-hand column. A "commonly missed" callout box highlights: whole blood stability, freeze-thaw using exact protocol thaw method, reinjection at L/M/H QCs, and autosampler stability at worst-case duration.
Frequently Asked Questions
Can I use the same validated LC-MS/MS method for plasma and serum without re-validation?
No. Plasma and serum have different protein compositions — serum lacks fibrinogen (∼2-4 g/L in plasma) and contains platelet-derived components released during clotting. Brown (2024) demonstrated that matrix protein content differences cause inconsistent analyte recovery when transitioning between matrices. Under ICH M10, introducing a new matrix requires at minimum a partial validation including calibration curve assessment, precision and accuracy runs, and matrix effect evaluation in the new matrix. If you anticipate analyzing both matrices, validate the method in both from the start.
What is the difference between K₂EDTA and K₃EDTA — and does switching between them require partial validation?
K₂EDTA and K₃EDTA differ only in the counter-ion stoichiometry — K₂EDTA has two potassium ions per EDTA molecule, K₃EDTA has three. Both chelate calcium via the same EDTA anion. The EBF multi-company study (Sennbro et al., 2011) evaluated 42 assays and found no significant difference: the mean precision difference was −0.7% (p = 0.06). ICH M10, based on this evidence, does not require partial validation when switching between counter-ions of the same anticoagulant.
My plasma sample is visibly hemolyzed — should I reject it or analyze it?
Neither — evaluate before deciding. Grade the hemolysis (slight pink/moderate red/gross dark red). During method development, you should have tested hemolyzed matrix (≥2% v/v) for interference at your analyte retention time. If the interference at the analyte RT is less than 20% of the LLOQ response, the sample can be analyzed and reported with a notation of the hemolysis grade. If interference exceeds 20% of LLOQ, the sample concentration is non-reportable for that analyte. Note that hemolysis effects are compound-specific — a sample that is non-reportable for one analyte in a multi-analyte panel may be reportable for another.
How do I know if my collection tubes are leaching polymers into my samples?
Perform a blank tube extraction during method development. Add water or analyte-free matrix to the tube, process it through your full sample preparation procedure (including any evaporation/reconstitution steps), and analyze the extract by full-scan LC-MS. Look for the diagnostic signatures: m/z 44 repeat spacing (PEG oligomers), m/z 149 and 279 ions (phthalate plasticizers). Compare extracts from different tube brands. If you observe systematic peaks, switch to a low-leachate tube brand. This test should be part of every method development when a new collection tube type or brand is introduced.
Can I thaw my plasma samples on the bench, or do I need to use an ice bath?
The thaw method matters — define it in the protocol and validate it. Bench-top thaw at room temperature is the most common approach and is acceptable if validated. Ice-bath thaw (samples immersed in ice-water) is gentler and preferred for labile analytes. Overnight thaw at 4°C is the gentlest but the slowest. The critical requirement is not which method you choose but that you validate the exact method you use and apply it consistently. Freeze-thaw stability testing during method validation must use the same thaw method specified in the study protocol. Switching thaw methods mid-study without supporting stability data is a protocol deviation.
How long can extracted plasma samples sit in the autosampler before I need to worry about degradation?
This is compound-specific and must be experimentally determined. Test processed sample stability at the concentration and solvent composition of your final extract, at the autosampler temperature (typically 4-10°C), for a duration that covers the longest possible analytical batch plus the time required for a requeue injection in the event of instrument failure. ICH M10 requires autosampler stability testing at low and high QC concentrations. A typical starting point is 24-72 hours, but volatile solvents (high acetonitrile or methanol content) may evaporate over extended periods, concentrating the analyte and producing falsely high results. Use tightly sealed vials or well-plate seals verified for extended storage.
If I collected samples in heparin but my calibration standards were prepared in EDTA plasma — can I still get valid results?
Generally no. Gonzalez-Covarrubias et al. (2013) demonstrated that 70 of 80 endogenous lipids showed significant peak area differences between anticoagulants, and IS correction only partially eliminated the differences (ANOVA p < 0.001). Calibrators and QCs must be prepared in the same anticoagulant matrix as study samples. If heparin-collected samples need to be analyzed against EDTA-based calibrators — a situation that sometimes arises when comparing data across studies — a cross-validation experiment comparing the two anticoagulants at multiple concentrations is the minimum requirement. The safest approach is to prepare two calibration curves and two sets of QCs: one in EDTA plasma and one in heparin plasma, then analyze each sample set against its matrix-matched curve.
References
- Sennbro CJ, Knutsson M, van Amsterdam P, Timmerman P. Anticoagulant counter ion impact on bioanalytical LC-MS/MS assays: results from discussions and experiments within the European Bioanalysis Forum. Bioanalysis. 2011;3(21):2393-2399. CC BY 4.0.
- Barri T, Dragsted LO. UPLC-ESI-QTOF/MS and multivariate data analysis for blood plasma and serum metabolomics: Effect of experimental artefacts and anticoagulant. Analytica Chimica Acta. 2013;768:118-128. CC BY 4.0.
- Steuer C, Huber AR, Bernasconi L. Where clinical chemistry meets medicinal chemistry. Systematic analysis of physico-chemical properties predicts stability of common used drugs in gel separator serum tubes. Clinica Chimica Acta. 2016;462:23-27. CC BY 4.0.
- Mei H, Hsieh Y, Nardo C, Xu X, Wang S, Ng K, Korfmacher WA. Investigation of matrix effects in bioanalytical high-performance liquid chromatography/tandem mass spectrometric assays: application to drug discovery. Rapid Communications in Mass Spectrometry. 2003;17(1):97-103. CC BY 4.0.
- Gonzalez-Covarrubias V, Dane A, Hankemeier T, Vreeken RJ. The influence of citrate, EDTA, and heparin anticoagulants to human plasma LC-MS lipidomic profiling. Metabolomics. 2013;9(2):337-348. CC BY 4.0.
- Brown SD. Impact of introducing a new biological matrix into a validated bioanalytical method: Focus on matrix protein content. Biomedical Chromatography. 2024;38(7):e5884. CC BY 4.0.
- Zhou J, Fabros A, Lam SJ, Coro A, Selvaratnam R, Brinc D, Di Meo A. The stability of 65 biochemistry analytes in plasma, serum, and whole blood. Clinical Chemistry and Laboratory Medicine. 2024;62(8):1557-1569. CC BY 4.0.
- Magreault S, Pierredon D, Akinotcho-Relouzat J, Méchaï F, Lamy B, Jaureguy F, Jullien V. From Bed to Bench: Pre-analytical Stability of 29 Anti-infective Agents in Plasma and Whole Blood to Improve Accuracy of Therapeutic Drug Monitoring. Therapeutic Drug Monitoring. 2024;46(6):725-734. CC BY 4.0.
Disclaimer: All services and resources mentioned on this site are for research use only (RUO) and are not intended for diagnostic, therapeutic, or clinical applications.
Related Services


