Why Sample Handling Stability Matters: The Hidden Source of Bioanalytical Variability
When a bioanalytical method reports a plasma concentration of 47.3 ng/mL, the number conveys an illusion of precision that obscures a chain of assumptions about sample integrity. Every step between the phlebotomist's needle and the mass spectrometer's detector — the anticoagulant mixed with the blood, the minutes spent on the clinical site bench before centrifugation, the hours on the laboratory bench during aliquot preparation, the organic solvent shock of protein precipitation, the days the extract sits in the autosampler tray waiting for injection — is a potential source of analyte loss or transformation. Sample handling stability is the experimental proof that none of these steps introduced a systematic bias. It is required by ICH M10 and the FDA Bioanalytical Method Validation (BMV) guidance, yet it remains the most under-documented segment of the bioanalytical validation package — typically reduced to a single-line entry in a stability summary table with no narrative connecting the stages into a coherent workflow.
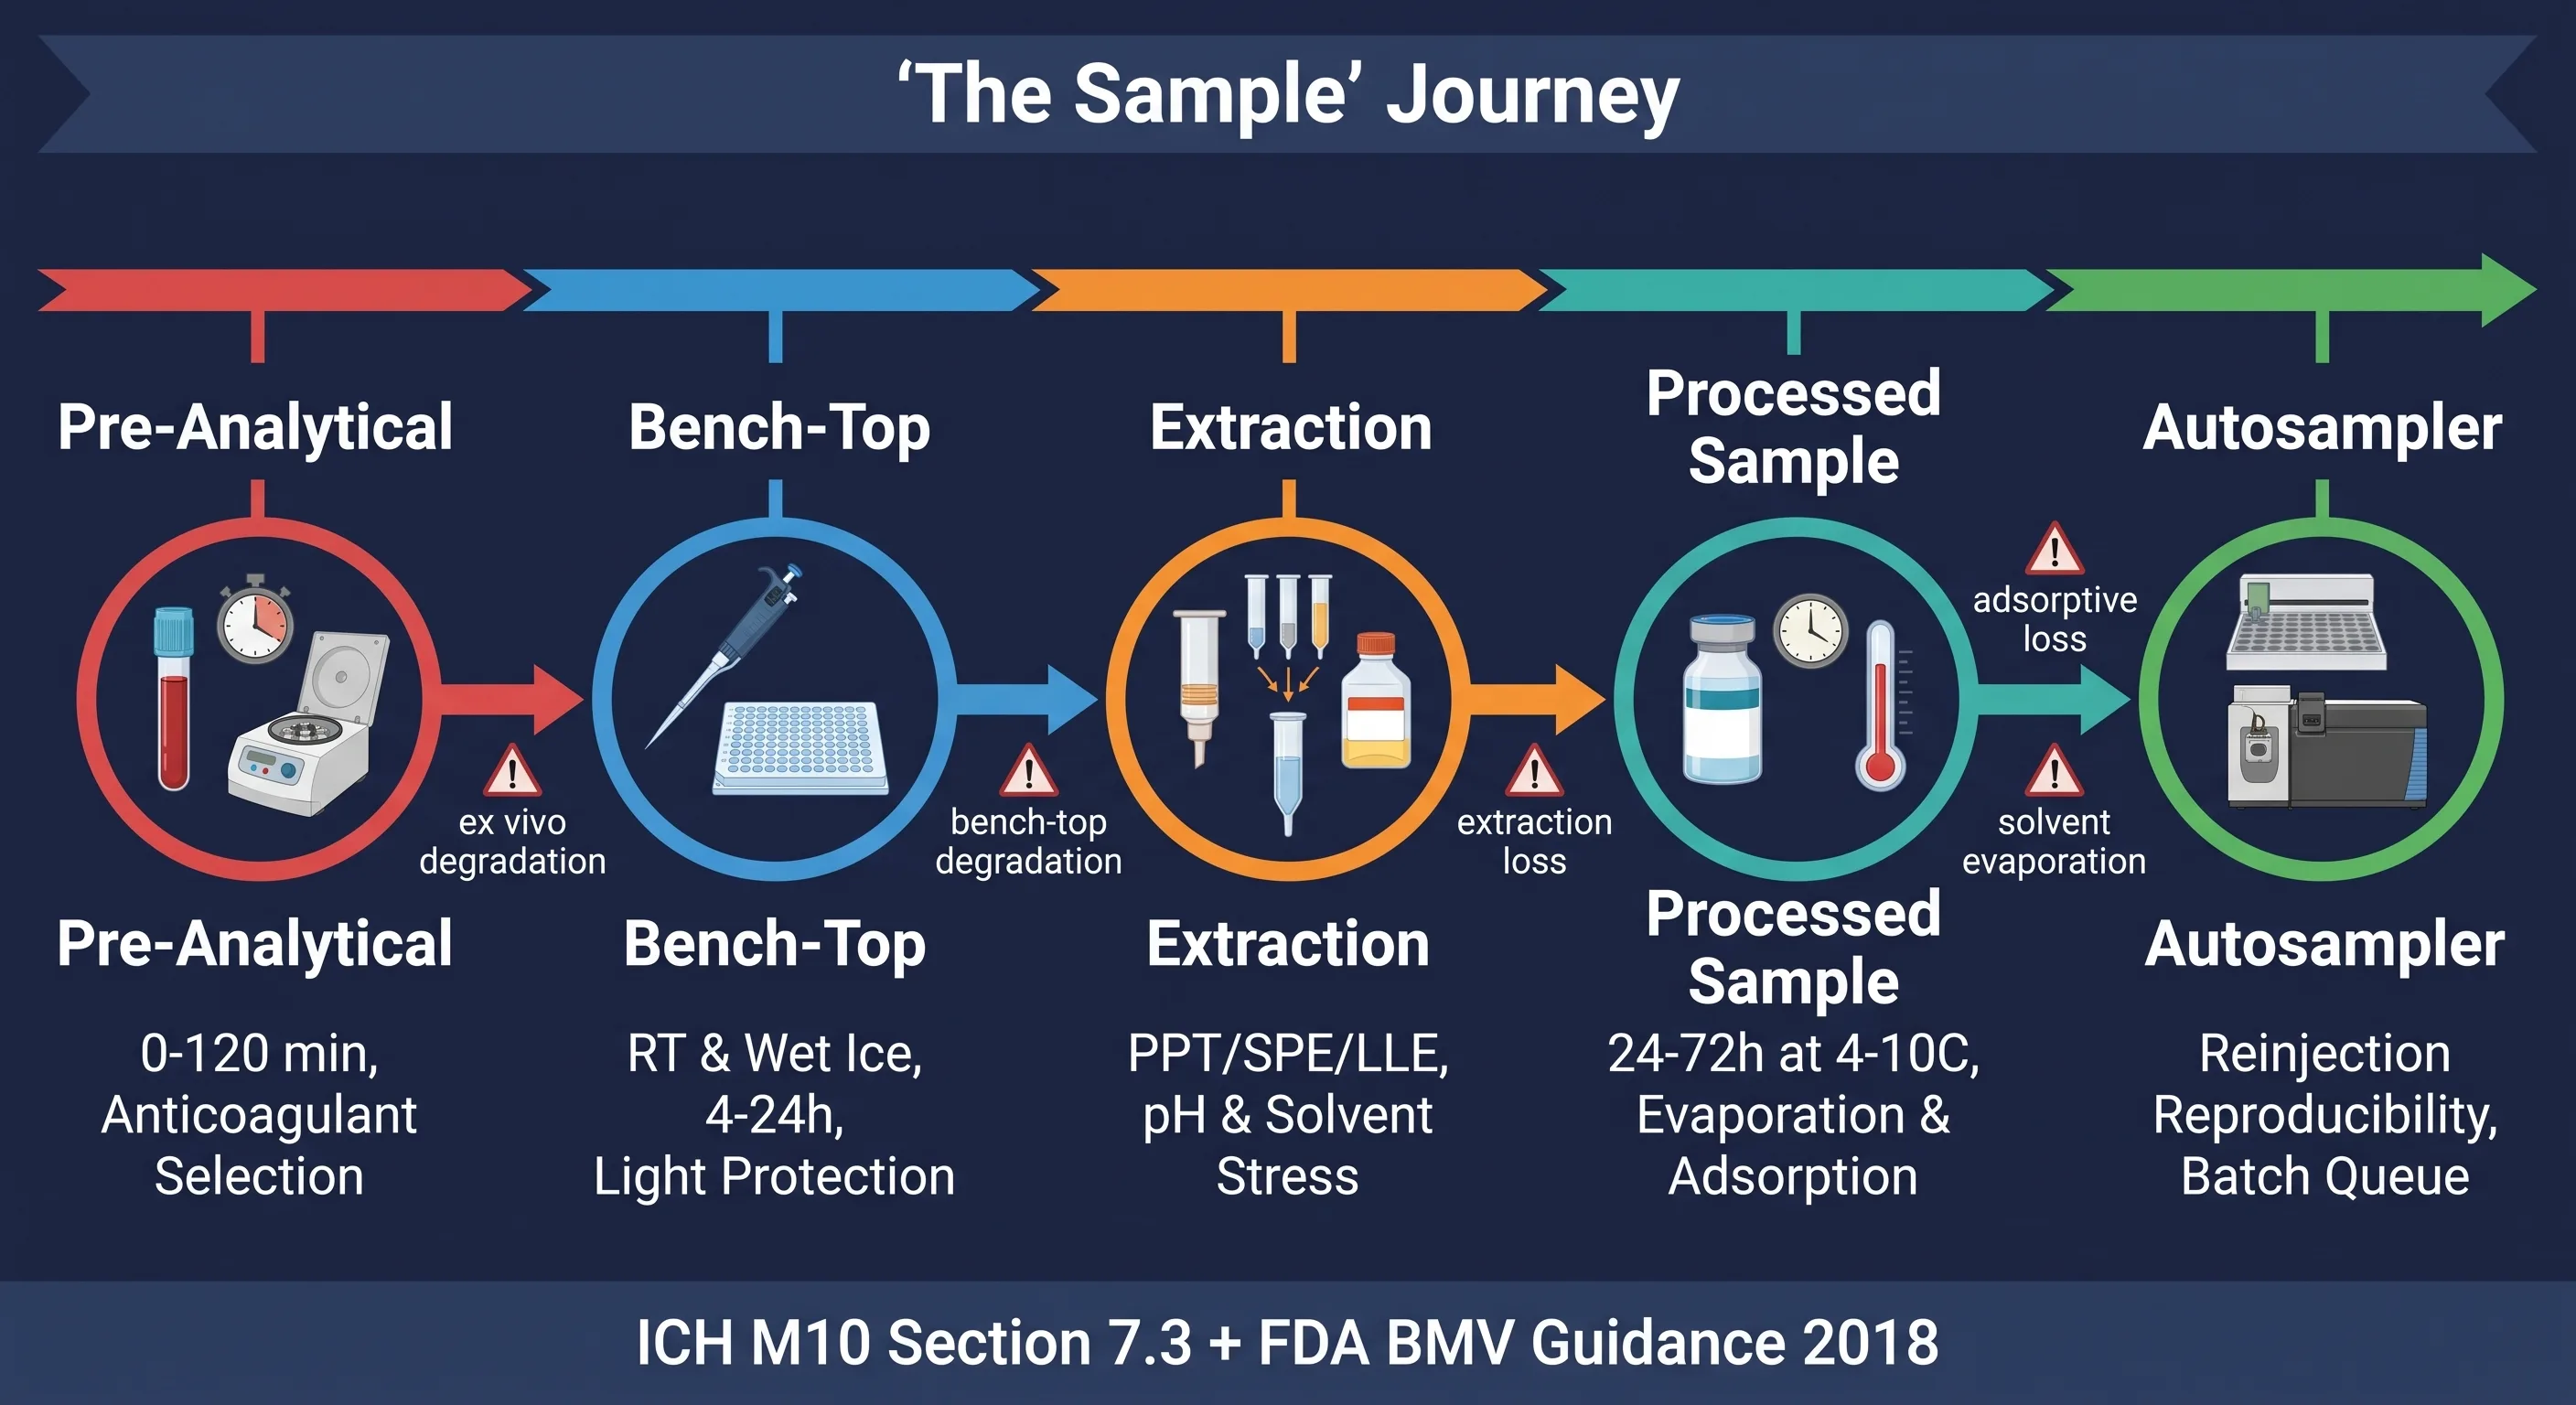 Figure 1: The Sample Handling Stability Chronological Workflow — From Blood Draw to LC-MS/MS Injection
The distinction between sample handling stability and the broader category of bioanalytical matrix stability testing is one of scope. Matrix stability encompasses all six ICH M10 stability types as an integrated package — freeze-thaw, long-term frozen storage, stock solution stability, and the three handling-focused types (bench-top, processed sample, and autosampler). Sample handling stability is the subset of those six that follows the sample's chronological journey through the laboratory workflow. Where freeze-thaw and long-term storage address the question "does the sample survive the freezer?", sample handling stability addresses the question "does the sample survive the workday?" The two are complementary: freeze-thaw stability testing validates the storage dimension, while sample handling stability validates the processing dimension. Together, they form the complete evidentiary chain that connects the concentration in the patient's circulation to the concentration reported on the bioanalytical data sheet.
Pre-Analytical Stability: Blood Draw, Anticoagulants, and the Race to the Centrifuge
The stability clock starts the moment blood enters the collection tube — not when the tube arrives at the bioanalytical laboratory. During the interval between phlebotomy and plasma separation, the analyte remains in contact with whole blood: a metabolically active matrix containing esterases, proteases, phosphatases, oxidoreductases, and red blood cell uptake transporters. For ester prodrugs — tenofovir disoproxil fumarate, dabigatran etexilate, oseltamivir — whole blood esterase activity can hydrolyze 50-90% of the parent prodrug within 15-30 minutes at room temperature if the collection tube does not contain an effective esterase inhibitor. The Niwa et al. (2022) Japan Bioanalysis Forum survey identified ester prodrugs as the single most problematic analyte class for ex vivo stability, with 78% of surveyed laboratories reporting at least one stability failure attributable to inadequate pre-analytical stabilization.
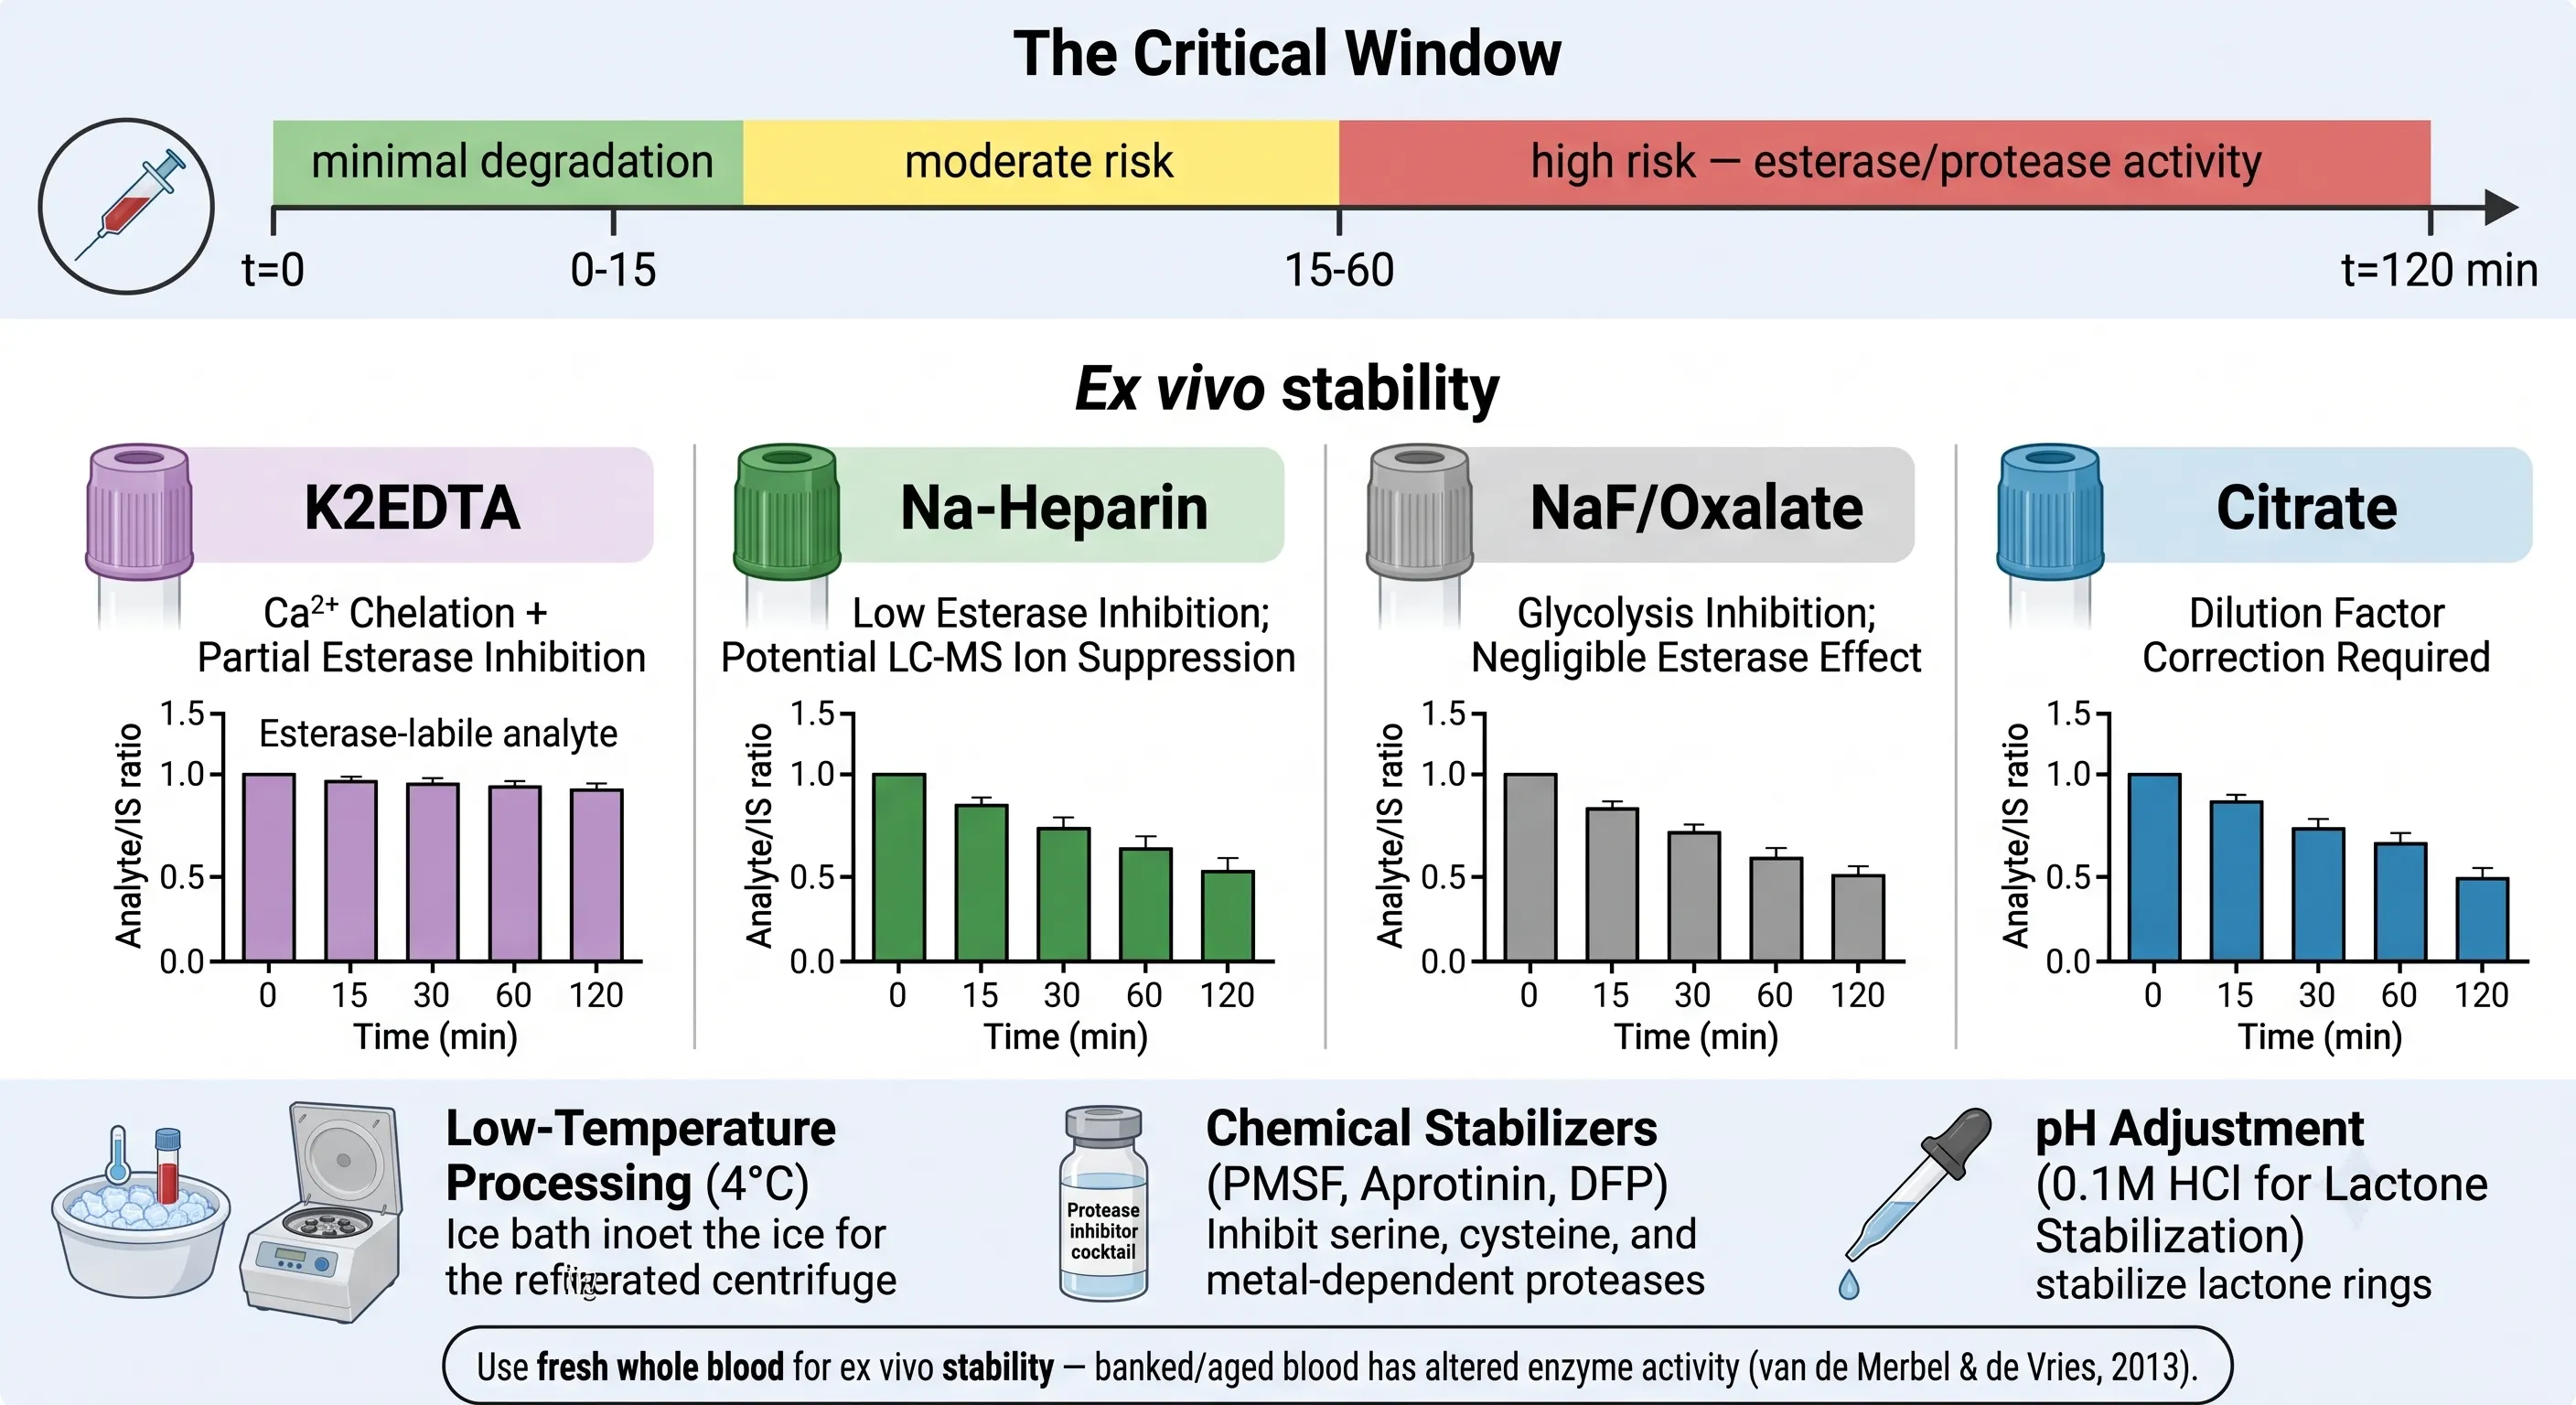 Figure 2: Pre-Analytical Stability — Blood Draw, Anticoagulants, and the Race to Centrifuge
The choice of anticoagulant is the first and most consequential pre-analytical decision. K₂EDTA is the default anticoagulant for small-molecule bioanalysis — it chelates Ca²⁺ and Mg²⁺, inhibiting metalloproteases and calcium-dependent esterases, and it introduces minimal LC-MS ion suppression compared to heparin. Na-heparin, while acceptable for many analytes, carries a risk of ion suppression in electrospray ionization and provides negligible esterase inhibition. NaF/oxalate (grey-top) tubes inhibit enolase and preserve glucose but have no meaningful effect on esterases, CYP enzymes, or UGT enzymes — enzymatic degradation of the analyte continues in NaF-preserved blood regardless of glycolytic arrest. Sodium citrate tubes introduce a systematic negative bias (approximately 10-15%) due to the liquid citrate solution diluting the blood sample, and this dilution factor must be accounted for if citrate plasma concentrations are compared to EDTA or heparin plasma values.
For analytes with documented ex vivo lability, the pre-analytical strategy extends beyond anticoagulant selection to active stabilization. Low-temperature processing — placing the collection tube in an ice bath immediately after draw and centrifuging at 4°C within 30 minutes — reduces enzymatic activity by approximately 50-75% compared to room temperature. Chemical stabilizers added at the point of collection can target specific degradation pathways: dichlorvos and paraoxon for serine esterase inhibition, PMSF for serine protease inhibition, aprotinin for broad-spectrum protease inhibition, and ascorbic acid or sodium metabisulfite for oxidation-prone catecholamines. The tradeoff of chemical stabilization is that the stabilizer must itself be validated for LC-MS compatibility — a stabilizer that prevents analyte degradation but causes 50% ion suppression exchanges one bioanalytical problem for another.
A critical but often-overlooked requirement is that ex vivo blood stability must be evaluated using fresh whole blood, not banked or aged blood. van de Merbel and de Vries (2013) demonstrated that stored whole blood can exhibit substantially different enzyme activity than fresh blood due to red blood cell lysis and release of intracellular enzymes during storage. A stability experiment conducted in aged blood that shows acceptable recovery may be non-predictive of actual clinical sample behavior — the aged blood has depleted enzyme activity that would be active in a freshly drawn patient sample. The regulatory expectation is that the ex vivo stability experiment brackets the maximum time and temperature conditions that any clinical sample will experience between collection and centrifugation, using fresh blood from at least 3-6 individual donors.
Bench-Top Stability: Room Temperature, Wet Ice, and Light Protection Strategy
Once plasma is separated and frozen, the next stability question is: can the analyte survive thawing and a full working day on the laboratory bench? Bench-top (short-term matrix) stability is the most operationally proximate stability experiment — it simulates the sample's experience from removal from the freezer through thawing, aliquot preparation, and the extraction procedure itself. ICH M10 requires that bench-top stability be evaluated at room temperature and, where appropriate, on wet ice (0-4°C), for a duration that brackets the maximum anticipated sample handling time — typically 4 to 24 hours. QC samples at low and high concentration levels (minimum 3 replicates each) are prepared in the target matrix, held under the test condition for the specified period, then extracted and analyzed against a freshly prepared calibration curve.
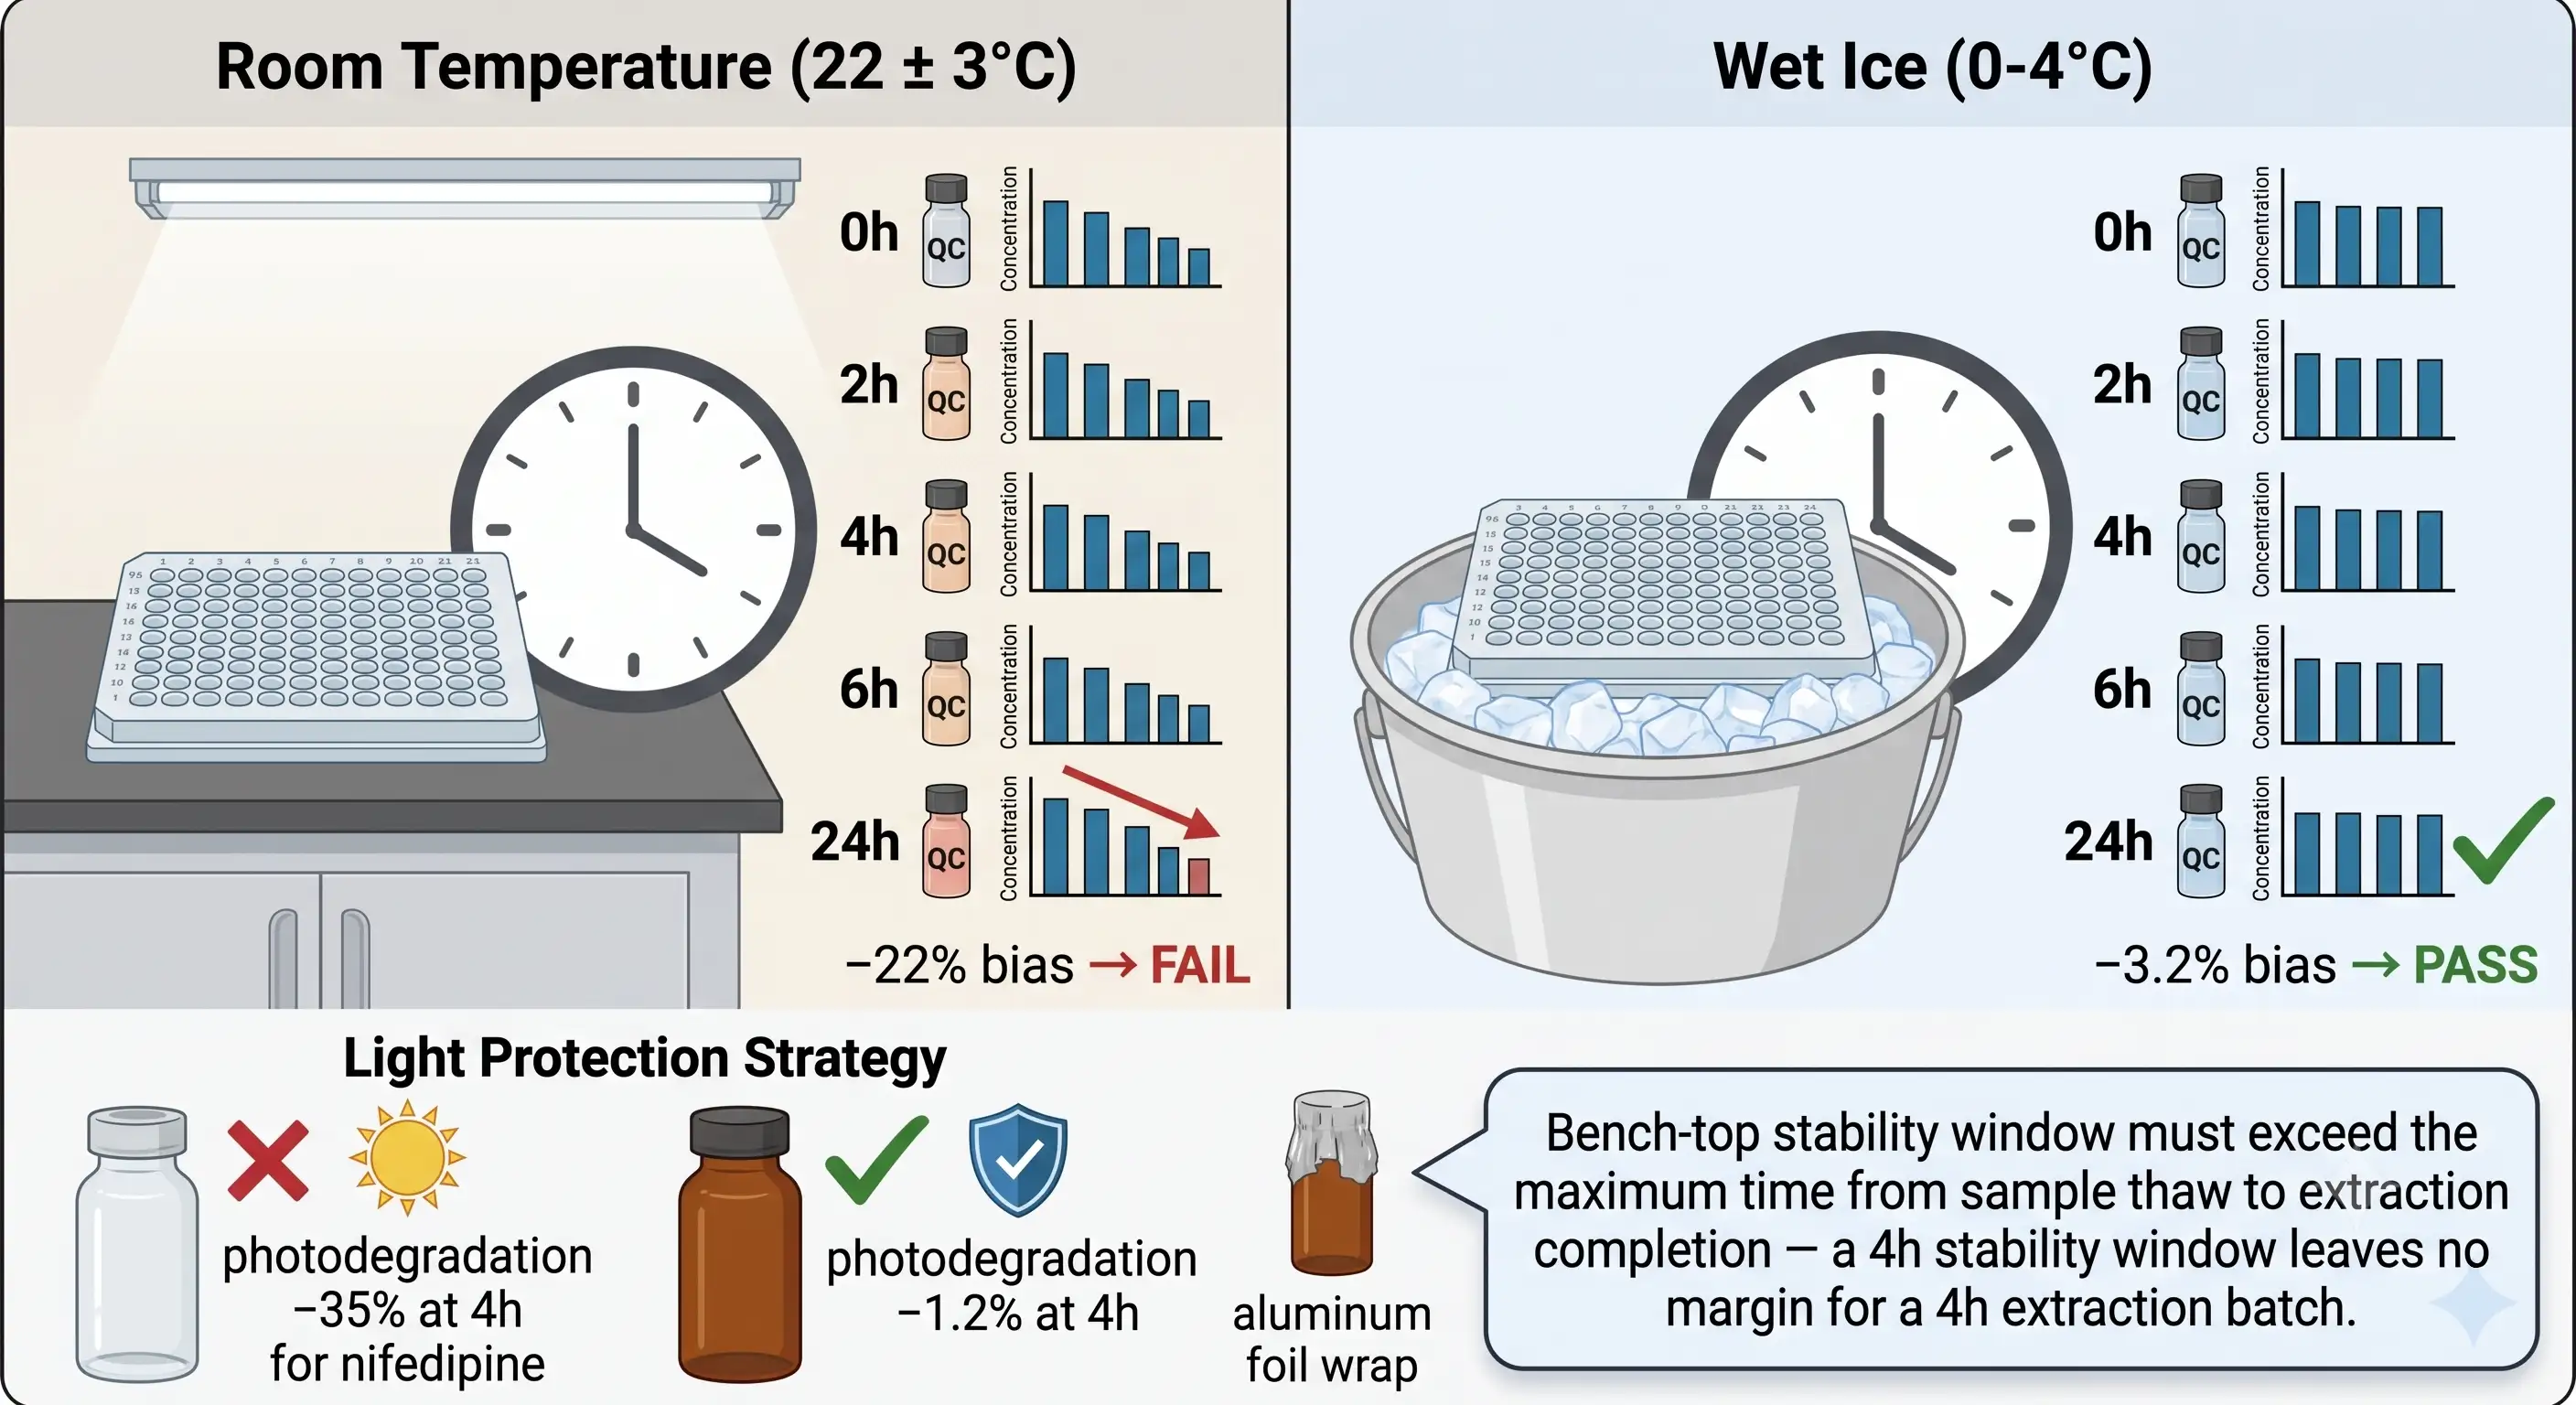 Figure 3: Bench-Top Stability — Room Temperature vs Wet Ice Experiment Design
The operational parameter that matters most in bench-top stability design is the margin between the validated stability window and the actual extraction batch duration. A method validated with 4-hour bench-top stability, used in a laboratory where a 96-well plate extraction takes 4 hours from thaw to dry-down, has zero operational margin — there is no buffer for an analyst who takes a 15-minute break or a centrifuge that runs 10 minutes longer than expected. A 6-hour bench-top stability window provides a comfortable 2-hour margin over a 4-hour extraction and withstands regulatory scrutiny. The corollary: if the clinical protocol permits sample shipment on wet ice with a 24-hour transit time, the bench-top stability evaluation must cover 24 hours on wet ice — not 4 hours — regardless of how quickly the receiving laboratory processes samples upon arrival.
For light-sensitive analytes, bench-top stability must include a light exposure assessment. Compounds with photolabile functional groups — 1,4-dihydropyridines (nifedipine, amlodipine), camptothecin analogs, riboflavin, nitroprusside, and amphotericin B — can undergo rapid photodegradation under standard laboratory fluorescent lighting. The assessment compares analyte stability under normal laboratory light versus light-protected conditions (amber vials, aluminum foil wrap, or low-actinic lighting). Njambe Ediage et al. (2018) demonstrated that coproporphyrin-I in transparent glass tubes under direct window light lost 72.3% within 24 hours, while amber polypropylene tubes under the same conditions showed only 7.8% loss. A finding of acceptable stability under light-protected conditions with significant degradation under normal light is not a method failure — it is a manageable result that requires a procedural control (protect samples from light) without invalidating the method.
The matrix itself influences bench-top stability behavior. Whole blood at room temperature is enzymatically active; plasma at room temperature has reduced but not eliminated enzyme activity (residual soluble esterases and proteases); urine at room temperature can support bacterial growth that metabolizes the analyte unless a preservative (boric acid, sodium azide) is added; and tissue homogenates are among the most enzymatically aggressive matrices due to released intracellular enzymes. Bench-top stability must be evaluated in the exact matrix that clinical samples will be collected in — demonstrating bench-top stability in plasma does not cover whole blood, and vice versa.
Extraction Stability: Analyte Integrity During PPT, SPE, and LLE
The extraction step is a chemically aggressive environment. The analyte is exposed to organic solvents (acetonitrile, methanol, methyl tert-butyl ether, ethyl acetate), pH extremes (formic acid-modified precipitation solvent at pH ~2-3, alkaline LLE conditions at pH 9-11), vortex mixing, centrifugation, evaporation under heated nitrogen, and reconstitution in a solvent mixture that may differ substantially from the original biological matrix. Each of these substeps is a potential degradation stress, and the cumulative exposure time across all substeps defines the extraction stability window.
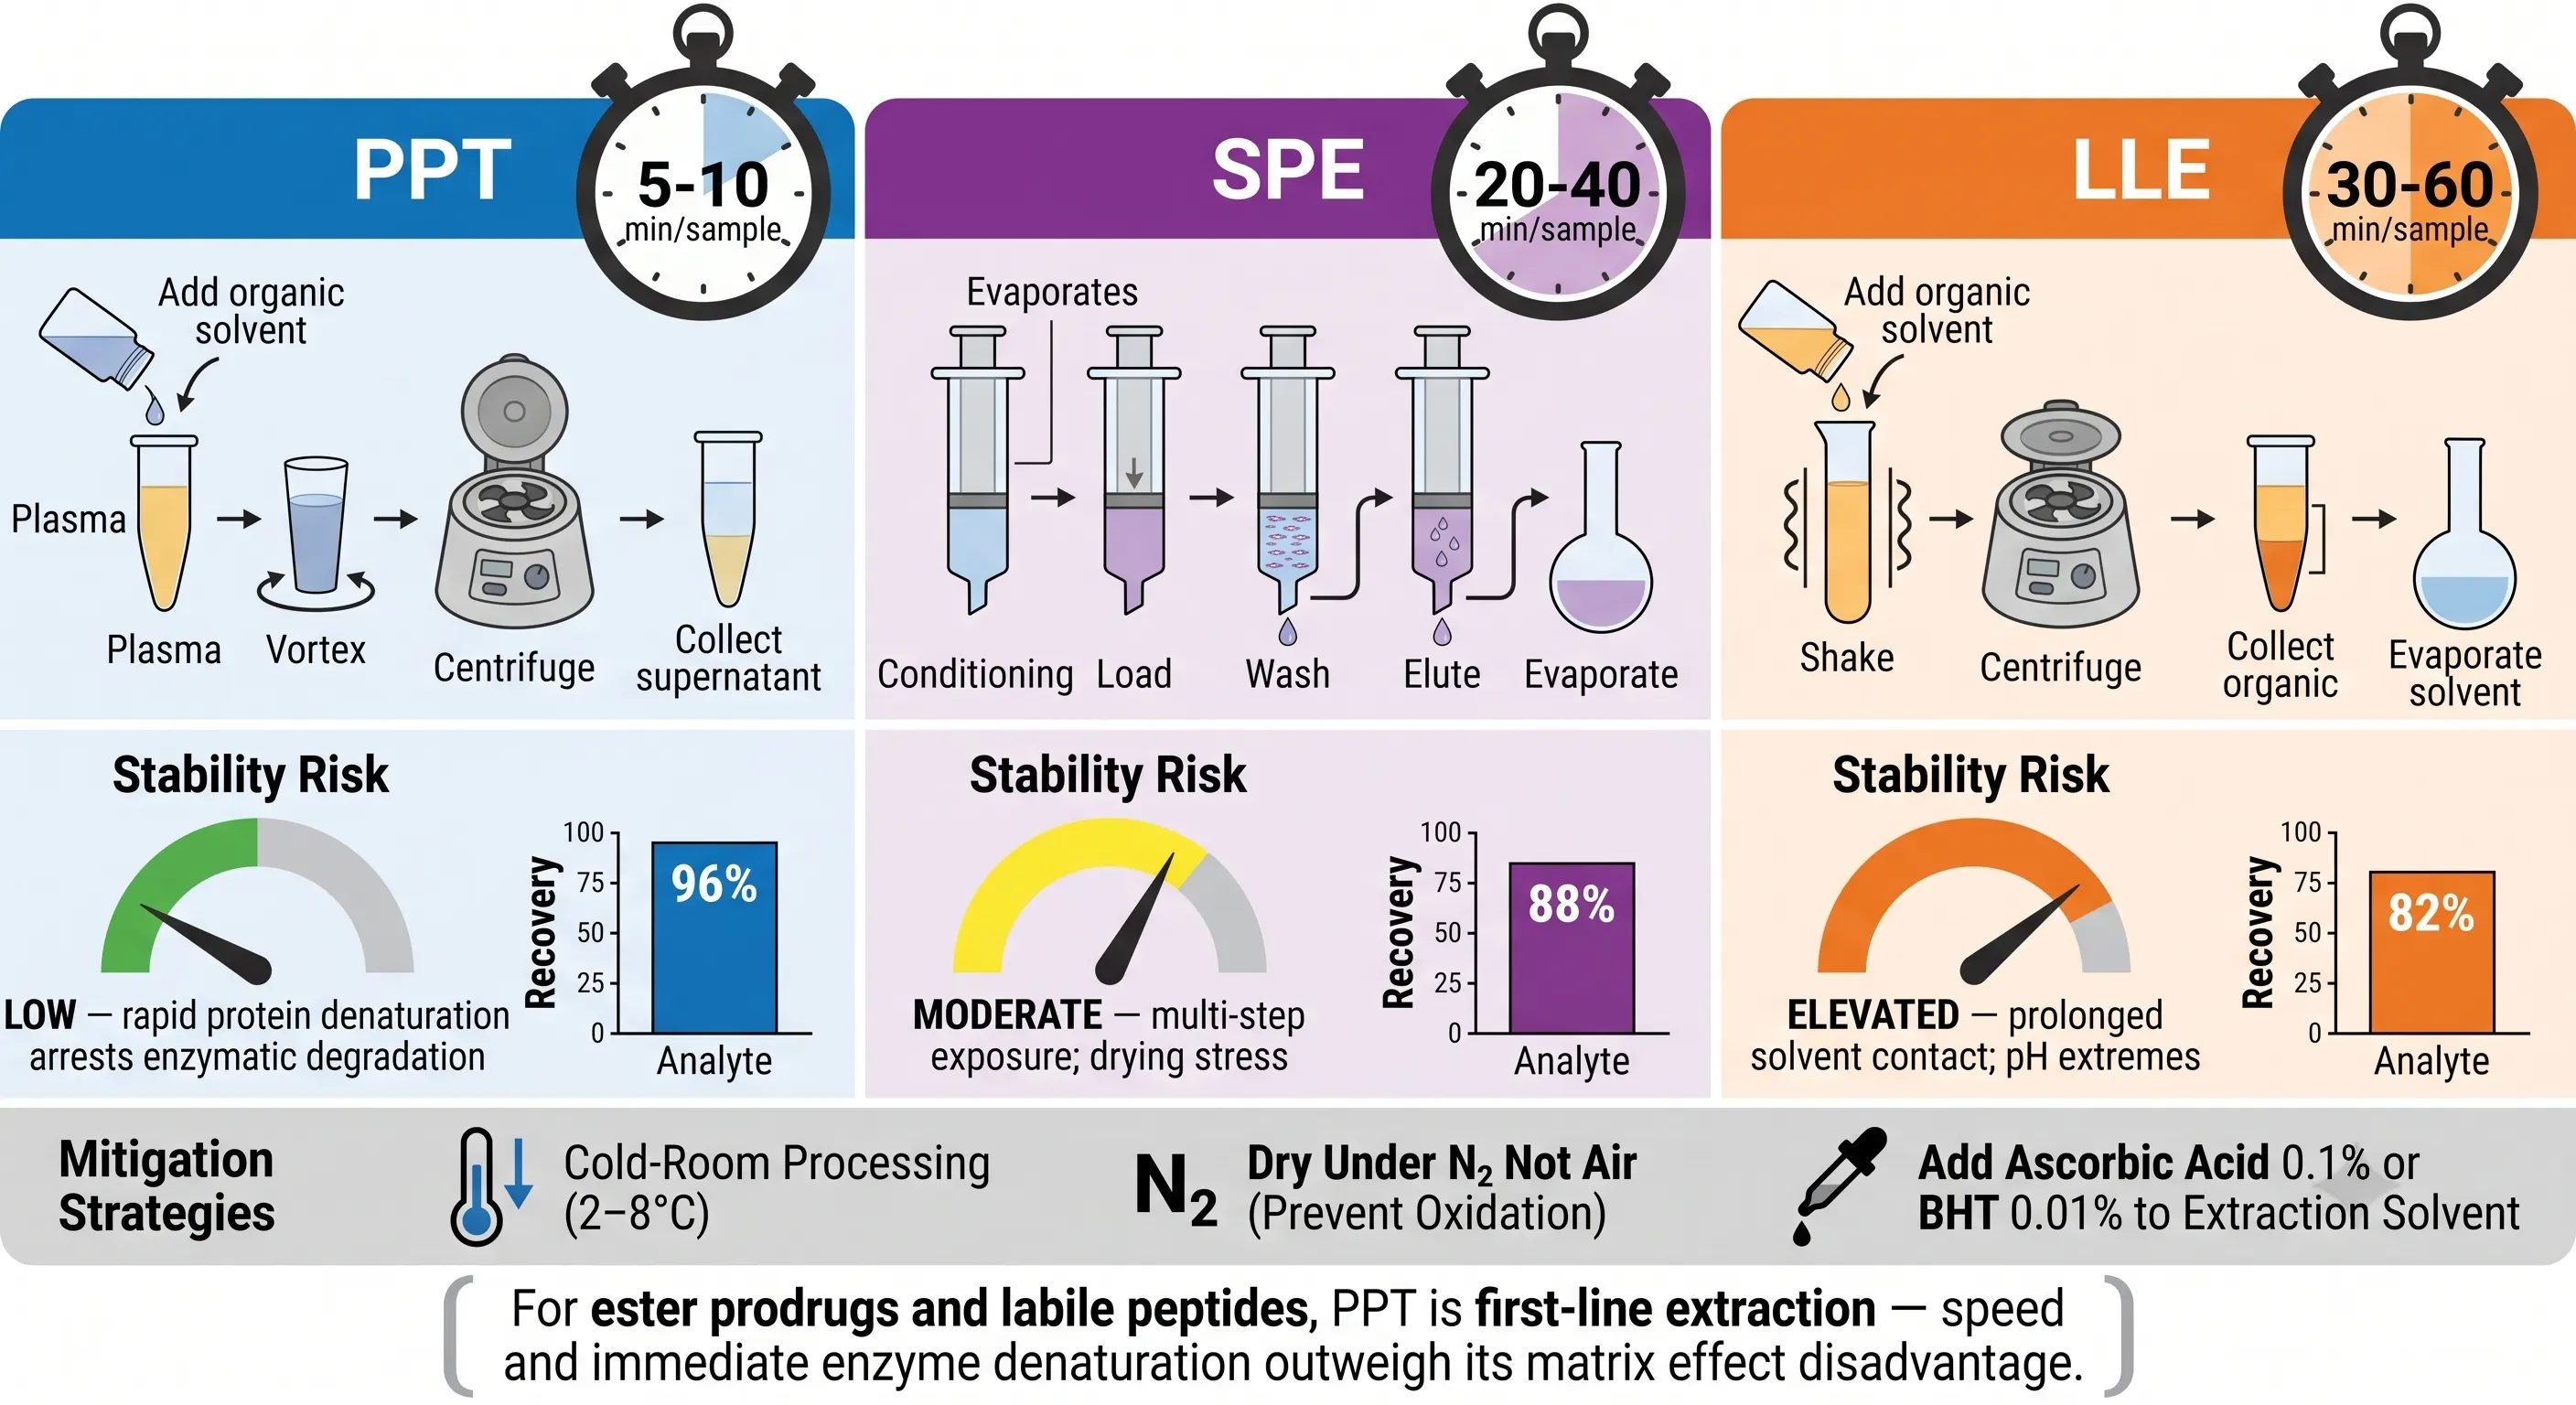 Figure 4: Extraction Stability — PPT vs SPE vs LLE for Labile Analytes
The three principal extraction techniques — protein precipitation (PPT), solid-phase extraction (SPE), and liquid-liquid extraction (LLE) — present different stability risk profiles. PPT is the fastest and most stabilization-friendly technique. Addition of acetonitrile or methanol (typically 3:1 v/v organic-to-plasma ratio) denatures plasma proteins and inactivates enzymes within seconds, effectively arresting enzymatic degradation. PPT takes 5-10 minutes per sample from solvent addition to supernatant collection. The disadvantage is extract cleanliness: PPT leaves residual phospholipids, salts, and other water-soluble matrix components that cause ion suppression in electrospray ionization. For unstable analytes where degradation is the primary analytical risk, PPT's speed advantage outweighs its matrix effect disadvantage — a slightly suppressed but stable signal is preferable to a clean but degraded signal.
SPE presents a moderate stability risk. The multi-step protocol — condition, load, wash, elute, evaporate, reconstitute — exposes the analyte to a series of solvents and pH conditions over 20-40 minutes per sample. The evaporation step is particularly risky for thermally labile or oxidation-prone analytes: heated nitrogen (typically 40-50°C) can accelerate degradation, and exposure to atmospheric oxygen during drying can oxidize thiols, catechols, and other redox-sensitive functional groups. Mitigations include cold-room processing (2-8°C), drying under nitrogen rather than air, addition of antioxidants (ascorbic acid 0.1% w/v or BHT 0.01% w/v) to the elution solvent, and avoiding complete dryness — leaving a small residual volume (5-10 µL) of organic solvent can prevent adsorptive and oxidative losses at the final drying stage.
LLE carries the highest stability risk due to prolonged solvent contact and pH extremes. LLE requires the analyte to be in its unionized form for efficient partitioning into the organic phase, which may require adjusting the aqueous matrix to a pH far from physiological — pH 9-11 for basic analytes or pH 2-4 for acidic analytes. This pH shift alone can hydrolyze ester, lactone, and amide bonds in labile analytes. The evaporation of large organic solvent volumes (2-5 mL) takes longer than SPE evaporation, prolonging thermal stress. For unstable analytes, LLE is generally the least favorable extraction technique unless the analyte's stability profile specifically contraindicates PPT (e.g., an analyte that coprecipitates with plasma proteins) and SPE is unavailable.
The extraction stability assessment is method-embedded rather than a standalone experiment: it is validated by the accuracy and precision of QC samples carried through the entire extraction procedure and compared to neat reference solutions injected directly. If extracted QCs at low and high concentration meet the ±15% accuracy criterion versus nominal, the extraction process — including all its solvents, pH shifts, and thermal stresses — is stability-validated by inference. If extracted QCs fail while unextracted solvent standards meet acceptance criteria, the extraction process is the root cause of the failure and each substep must be investigated individually.
Processed Sample Stability: Post-Extraction Integrity in Injection Vials
After extraction, the analyte enters a new chemical environment: the reconstitution solvent, typically a mixture of water, acetonitrile, methanol, and 0.1% formic acid. This solvent is chemically distinct from the biological matrix, and degradation pathways that were slow or absent in plasma — hydrolysis catalyzed by trace acid, oxidation accelerated by dissolved oxygen in organic solvents, photodegradation enhanced by the absence of light-scattering proteins — can become kinetically significant. Processed sample stability validates that the analyte survives in this post-extraction environment for the duration between extraction completion and LC-MS/MS injection.
Two distinct processed sample stability experiments are recognized in bioanalytical practice. Wet extract stability — also called autosampler stability — evaluates the extract in its reconstituted liquid form, sitting in a sealed (or resealed) injection vial in the autosampler tray at 4-10°C. The evaluation typically covers 24, 48, and 72 hours, with the extract re-injected at each time point and quantified against a freshly prepared calibration curve. Dried extract stability evaluates the dried-down extract (post-evaporation, pre-reconstitution) stored at -20°C or 4°C for days to weeks, then reconstituted and analyzed. Dried extract stability is relevant for batched workflows where multiple extraction batches are performed over a week or more and all dried extracts are stored until a single consolidated analytical run.
The three failure modes of processed sample stability are mechanistically distinct and require different mitigations. Solvent evaporation through an imperfectly sealed vial septum progressively concentrates both analyte and internal standard in the remaining volume, producing a false-positive stability result — both analyte and IS peak areas increase while their ratio remains constant, masking the concentration change. The mitigation is a pierceable silicone/PTFE mat seal that reduces evaporation to negligible levels, validated by monitoring the absolute IS peak area across time points — a constant IS area confirms no evaporative concentration has occurred. Adsorptive loss to the vial surface produces a false-negative result — the measured concentration declines as analyte molecules bind to the vial wall, while the IS may or may not adsorb to the same degree. The mitigation is surface-dependent: low-protein-binding polypropylene vials for hydrophobic analytes, silanized/deactivated glass vials for basic analytes, or the addition of a compatible blocking agent (0.1% BSA, 0.01% CHAPS) to the reconstitution solvent. Chemical degradation in the extract — hydrolysis of an ester prodrug in acidic reconstitution solvent, oxidation of a thiol in aerated methanol — produces a genuine loss of analyte that is confirmed by the appearance of a degradant peak in the chromatogram. The mitigation is reformulation of the reconstitution solvent (reduced acid concentration, addition of antioxidant, substitution of methanol with acetonitrile) or a procedural time limit on post-extraction storage.
The internal standard response ratio across time points is the diagnostic tool for distinguishing these failure modes. A constant ratio with increasing absolute areas → evaporation. A decreasing ratio with stable IS area → analyte-specific adsorption or degradation. An increasing ratio with stable analyte area → IS adsorption or degradation. A constant ratio with decreasing absolute areas → both analyte and IS adsorbing equally (rare but possible with structurally similar compounds).
Autosampler Stability: Surviving the Queue — 24-72h at 4-10°C
Autosampler stability is the final checkpoint before the detector. In a high-throughput bioanalytical laboratory running batches of 100-200 clinical samples, a single analytical run takes 12-24 hours. If the instrument fails at sample #87, the remaining samples sit in the autosampler tray — at 4°C or 10°C depending on the tray chiller setting — until the instrument is repaired and the batch is re-queued. If a data review the following morning identifies a calibration drift in the first 20 injections, the entire batch may need to be re-injected. Autosampler stability is the experimental demonstration that the analyte concentration measured after 24, 48, or 72 hours in the autosampler tray equals the concentration that would have been measured at t=0.
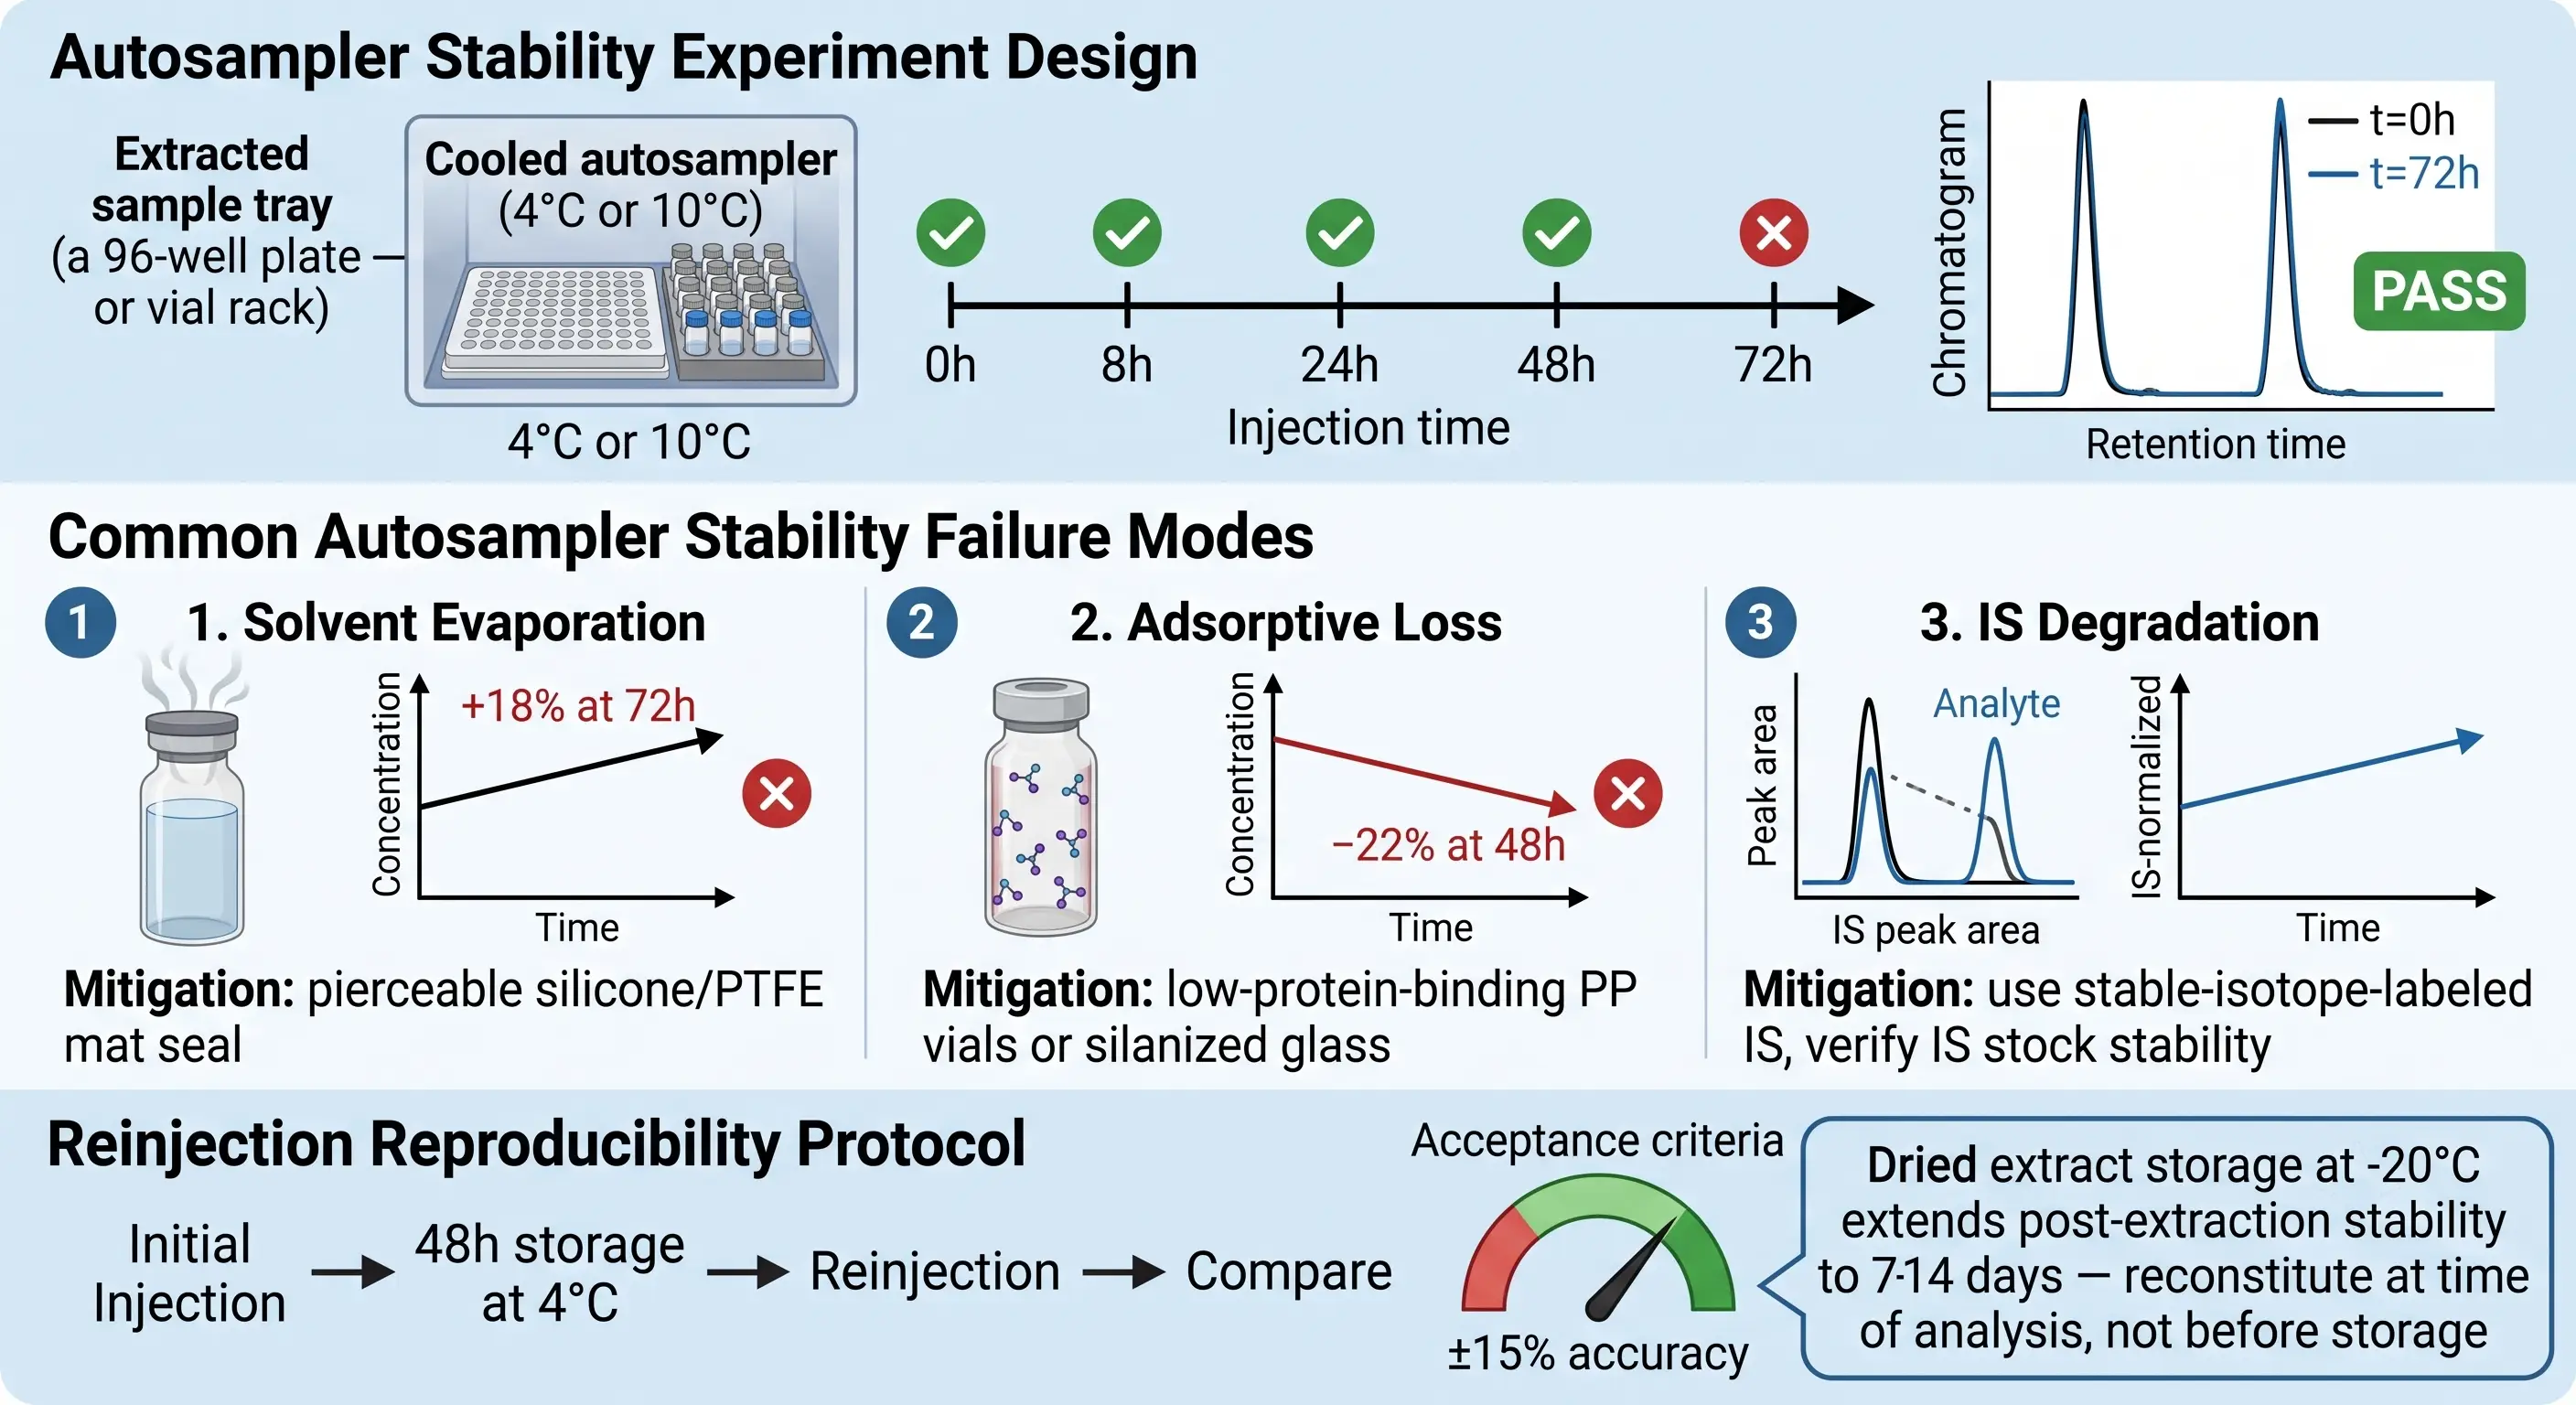 Figure 5: Processed Sample & Autosampler Stability — Post-Extraction Integrity Assessment
The autosampler tray temperature is an often-overlooked variable. Most autosamplers offer a Peltier-cooled tray with a setpoint range of 4°C to 20°C. A setting of 4°C provides maximum stability for most analytes — degradation kinetics approximately double for every 10°C increase, so a compound that degrades by 5% over 72 hours at 4°C may degrade by 20% over the same period at 20°C. However, 4°C operation carries a condensation risk in humid laboratory environments, and some autosampler trays have a minimum practical setpoint of 10°C due to Peltier capacity limitations. The stability evaluation must be conducted at the actual tray temperature used in routine operation — validating at 4°C and operating at 10°C is a regulatory gap if the 10°C condition was never tested.
Reinjection reproducibility is a related but distinct experiment from autosampler stability. Autosampler stability asks: "does the extract remain chemically stable in the tray?" Reinjection reproducibility asks: "if I inject the same vial twice, 48 hours apart, do I get the same answer?" The reinjection experiment involves: initial injection of extracted QCs at t=0, storage of the same vials in the autosampler at 4-10°C for 48-72 hours, reinjection against a freshly prepared calibration curve, and comparison of the two results. Acceptance criteria are the same as for all stability types: mean accuracy within ±15% of nominal (±20% at LLOQ) and ≥67% of replicates meeting the individual bias criterion. The reinjection reproducibility result is a composite readout — it reflects both chemical stability (has the analyte degraded?) and instrumental reproducibility (has the LC-MS system sensitivity drifted between runs?). A reinjection failure may be due to extract degradation, but it may also be due to a dirty ion source, a failing LC pump seal, or a calibration standard preparation error — the troubleshooting must distinguish between these possibilities before concluding that the extract is unstable.
Carryover from degraded extracts is a secondary but important concern. If an extract partially degrades during prolonged autosampler storage, the degradation products may co-elute or carry over into subsequent injections in ways that the original (fresh) extract did not. The autosampler stability evaluation should include a carryover assessment: a blank solvent injection immediately following the highest-concentration aged extract injection, with the acceptance criterion that the analyte peak area in the blank is <20% of the LLOQ response and that no new peaks exceeding this threshold appear in the aged extract chromatogram that were not present in the fresh extract chromatogram.
Experimental Design: A Timeline-Based Multi-Stage Stability Protocol
The practical challenge of sample handling stability is that the five stages — pre-analytical, bench-top, extraction, processed sample, and autosampler — form a serial chain, and a failure at any one stage confounds the interpretation of all subsequent stages. A well-designed multi-stage stability protocol isolates each stage's contribution by testing each condition independently while controlling for the variables introduced by upstream stages.
The experimental design template starts with the end in mind: define the maximum sample journey that any clinical sample will experience, then build a protocol that brackets each segment of that journey with an experimentally validated stability window. For a clinical study where: (a) blood is centrifuged within 30 minutes at 4°C at the clinical site, (b) plasma is shipped on dry ice to the bioanalytical laboratory, (c) samples are thawed and aliquoted over a 4-hour workday, (d) a 96-well PPT extraction takes 4 hours, (e) extracts may sit in the autosampler for up to 48 hours before injection — the corresponding stability protocol requires: ex vivo whole blood stability at 4°C for 60 minutes (bracketing the 30-minute target), bench-top stability at room temperature for 6 hours (bracketing the 4-hour workday), extraction stability via QC accuracy, processed sample stability for 72 hours at 4°C (bracketing the 48-hour autosampler residence), and reinjection reproducibility at 48 and 72 hours.
For the bench-top and processed sample stability experiments specifically, the design parameters are: QC samples at low (3× LLOQ) and high (80% of ULOQ) concentration levels, minimum 3 replicates per level per time point, freshly prepared calibration standards and freshly thawed QC samples as the t=0 reference, and a minimum of 3 time points (e.g., 0h, 6h, 24h for bench-top; 0h, 24h, 48h for processed sample). Laboratory temperature and humidity should be recorded at each time point — a bench-top stability experiment conducted at 21°C on a cool winter day may not represent the stability at 27°C on a hot summer day in a non-climate-controlled laboratory. The ICH M10 bioanalytical method validation guideline requires that stability be evaluated under conditions representing the maximum stress the samples will encounter, not the average or optimal conditions.
A common pitfall is the use of the same calibration curve for all time points in a multi-day stability experiment. If the calibration standards were prepared on Day 0 from a stock solution that itself has limited bench-top stability at room temperature, and the Day 3 time point samples are quantified against the Day 0 calibration curve, an apparent 15% decline in QC accuracy at Day 3 could reflect either QC degradation (bench-top stability failure) or calibrator degradation (stock solution stability failure). The solution is to prepare a fresh calibration curve at each time point from freshly thawed, independently validated stock solutions, ensuring that any observed change in QC accuracy is attributable to the sample stability condition and not to calibrator drift.
Stability Failure at Each Stage: Troubleshooting Root Causes
When a sample handling stability experiment fails — and at least one stage will, for at least some analytes — the troubleshooting logic follows the chronological workflow, starting at the earliest stage where a failure is observed and working forward. A pre-analytical failure (ex vivo degradation in whole blood) makes bench-top stability results uninterpretable because the "t=0" reference for bench-top stability was already degraded before the experiment began. The corrective action for each stage follows from its dominant degradation mechanism.
Pre-analytical failure (≥15% loss within the target blood-to-centrifuge window): Confirm the degradation mechanism — esterase-mediated hydrolysis, protease cleavage, phosphatase dephosphorylation, or red blood cell partitioning — through a combination of enzyme inhibitor spiking experiments and metabolite monitoring. Corrective actions in order of escalating intervention: reduce processing temperature (room temperature → wet ice → refrigerated centrifuge), shorten the processing window, add a specific enzyme inhibitor (dichlorvos for esterases, PMSF for serine proteases, sodium orthovanadate for phosphatases), or switch the anticoagulant (heparin → K₂EDTA for esterase-labile compounds).
Bench-top failure (≥15% loss at the target bench-top duration): First, distinguish chemical degradation from adsorptive loss — a monotonic concentration decline with no corresponding degradant peak in the chromatogram suggests adsorption, while a decline accompanied by a rising degradant peak confirms chemical degradation. For chemical degradation: reduce the bench-top temperature (room temperature → wet ice), shorten the validated bench-top window, or add a stabilizer to the thawed matrix. For adsorptive loss: switch to low-protein-binding tubes or add a non-specific blocking agent. For photodegradation: implement amber vials and aluminum foil protection as a procedural control — the method can be valid with this restriction if the light-protected stability passes.
Extraction failure (extracted QCs fail accuracy while unextracted solvent standards pass): Systematically test each substep. Spike analyte into blank matrix extract (post-extraction spike) to check for matrix effects versus extraction recovery. Process the analyte through each extraction substep individually — solvent exposure alone, pH adjustment alone, evaporation alone, reconstitution alone — to isolate the degradation step. If PPT causes degradation, switch from acetonitrile to methanol precipitation (or vice versa). If evaporation causes degradation, reduce the nitrogen temperature, shorten the drying time by reducing the extract volume, or add a protective agent (glycerol 1% as a keeper solvent).
Processed sample/autosampler failure (≥15% loss at 48-72h in the autosampler): Distinguish evaporation from adsorption from degradation using the IS response ratio diagnostic described above. For evaporation: upgrade the vial seal to a PTFE/silicone mat. For adsorption: switch vial material or add an organic modifier (1-5% isopropanol or acetonitrile) to the reconstitution solvent. For degradation: add an antioxidant, adjust the reconstitution solvent pH, switch the organic component, or implement a procedural time limit on post-extraction storage — "extracts must be injected within 24 hours of reconstitution" is a valid method restriction if the stability data supports 24-hour but not 48-hour storage.
The troubleshooting framework that ties the entire workflow together is provided by the stability-indicating method development approach: a method that has been designed from the outset to resolve the analyte from its degradation products, with forced degradation samples run alongside stability samples to confirm that any new chromatographic peaks in the stability samples correspond to known degradants and that the analyte peak is spectrally pure (no co-eluting degradant inflating the measured concentration). Without a stability-indicating method, a passing stability result — 98% accuracy at 24 hours — may be a false negative if a co-eluting degradant compensates for analyte loss, producing an apparently accurate total peak area that masks substantial analyte degradation.
Frequently Asked Questions
What is the difference between bench-top stability and processed sample stability?
Bench-top stability assesses analyte integrity in the biological matrix under laboratory conditions before extraction — typically room temperature and wet ice for 4-24 hours. It simulates the sample's journey from thawing through aliquot preparation to the start of extraction. Processed sample stability assesses analyte integrity after extraction — the extract sitting in an autosampler vial at 4-10°C for 24-72 hours, or as a dried extract stored at -20°C for later reconstitution. The distinction is operationally critical: a compound that is stable in plasma at room temperature for 24 hours may degrade in the final extract if the reconstitution solvent promotes hydrolysis, oxidation, or adsorption to the vial surface. Both must be independently validated per ICH M10, and the bench-top window must bracket the maximum time from sample thaw to extraction completion.
Which anticoagulant is best for bioanalytical sample handling of labile analytes?
K₂EDTA is generally the preferred anticoagulant for bioanalysis of labile small-molecule analytes. EDTA chelates divalent cations (Ca²⁺ and Mg²⁺), which inhibits metalloproteases and some esterases, providing partial stabilization against enzymatic degradation without the ion suppression risks associated with heparin. NaF/oxalate tubes inhibit glycolysis but have negligible effect on esterases and CYP/UGT enzymes. Sodium citrate causes systematic negative bias due to liquid dilution of the blood sample and requires a dilution factor correction. Heparin can cause LC-MS ion suppression and does not inhibit esterases. For ester prodrugs, K₂EDTA combined with a specific esterase inhibitor added at the point of collection provides the most robust stabilization. Critically, the anticoagulant used for clinical samples must match the anticoagulant used during method validation.
How should light-sensitive compounds be handled during bioanalytical bench-top processing?
Light-sensitive compounds require a two-tier protection strategy during bioanalytical handling. Stock solutions and working solutions should be prepared and stored in amber glass or amber polypropylene vials. During bench-top processing, sample exposure to ambient laboratory light should be limited to less than 2 hours, and samples should be kept away from direct window light or UV sources. Amber polypropylene tubes are adequate for standard bench-top handling (recovery 93-99%), while transparent glass tubes under direct sunlight can lose over 70% of photolabile analyte within 24 hours. Bench-top stability validation must include both normal laboratory lighting and light-protected conditions to quantify the magnitude of photodegradation and establish the maximum permissible light exposure window. If photodegradation exceeds 15% under normal light but is negligible under light-protected conditions, the method is valid with a procedural control: protect samples from light during all handling steps.
Why is protein precipitation (PPT) preferred over SPE and LLE for unstable analytes?
PPT is the first-line extraction technique for unstable analytes because of two properties: speed and immediate enzyme denaturation. Organic solvents (acetonitrile or methanol) added during PPT denature active enzymes in the biological matrix within seconds, arresting enzymatic degradation. PPT takes 5-10 minutes per sample, minimizing the time window for chemical degradation compared to SPE (20-40 minutes) or LLE (30-60 minutes). The tradeoff is poorer extract cleanliness — PPT leaves residual phospholipids and salts that can cause ion suppression in LC-MS/MS. For analytes where matrix effects are manageable and degradation is the primary concern, PPT's speed advantage outweighs its cleanup disadvantage. For analytes requiring both stabilization and cleanup, a hybrid PPT-SPE approach (PPT to stop degradation, followed by SPE for cleanup) is an effective compromise.
How long should autosampler stability be evaluated for a typical bioanalytical batch?
Per ICH M10-aligned best practices, autosampler stability should be evaluated for at least the maximum duration that extracted samples will sit in the autosampler tray at 4-10°C before injection. For a typical 96-well plate batch of 100-200 samples, a single analytical run takes 12-24 hours, so 24-hour autosampler stability is the minimum. However, practical contingencies demand longer evaluation: instrument failure requiring batch re-queuing the following day, a power outage over a weekend, or a decision to re-inject a batch after initial data review. A 48-72 hour evaluation at the intended autosampler temperature provides operational margin. Reinjection reproducibility should be demonstrated by re-injecting the same extracted samples after 24, 48, and 72 hours and comparing results to the initial injection against a fresh calibration curve.
What causes adsorptive loss during processed sample storage and how can it be prevented?
Adsorptive loss occurs when analyte molecules bind nonspecifically to the interior surface of autosampler vials during post-extraction storage, progressively reducing the effective concentration in solution. The mechanism is surface-dependent: hydrophobic analytes (logP > 5) adsorb to polypropylene vials via hydrophobic interactions, while basic/positively charged analytes adsorb to borosilicate glass vials via electrostatic interaction with surface silanol groups (SiO⁻). Adsorptive loss is concentration-dependent — it disproportionately affects low-concentration samples where the fraction lost to the surface represents a larger percentage of the total. Mitigations include: low-protein-binding polypropylene vials for hydrophobic analytes, silanized/deactivated glass vials for basic analytes, addition of a compatible organic modifier (1-5% isopropanol or acetonitrile) to the reconstitution solvent, or inclusion of a carrier protein or non-specific adsorption blocker (0.1% BSA or 0.01% CHAPS). The IS-normalized response ratio should remain constant across time points if adsorption affects both analyte and IS equally, but this cannot be assumed without experimental confirmation.
References
- ICH M10: Bioanalytical Method Validation and Study Sample Analysis. International Council for Harmonisation; 2022. https://database.ich.org/sites/default/files/M10_Guideline_Step4_2022_0524.pdf
- FDA Guidance for Industry: Bioanalytical Method Validation. U.S. Department of Health and Human Services; 2018. https://www.fda.gov/files/drugs/published/Bioanalytical-Method-Validation-Guidance-for-Industry.pdf
- van de Merbel NC, de Vries R. Aging of biological matrices and its effect on bioanalytical method performance. Bioanalysis. 2013;5(19):2393-2407. DOI: 10.4155/bio.13.226
- van de Merbel NC, Savoie N, Yadav M, et al. Stability: recommendation for best practices and harmonization from the Global Bioanalysis Consortium Harmonization Team. AAPS J. 2014;16(3):392-399. DOI: 10.1208/s12248-014-9573-z
- Niwa M, Kondo A, Shibutani E, et al. Handling unstable analytes: literature review and expert panel survey by the Japan Bioanalysis Forum Discussion Group. Bioanalysis. 2022;14(3):169-185. DOI: 10.4155/bio-2021-0229
- Goodman K, Mitchell M, Evans AM, et al. Assessment of the effects of repeated freeze thawing and extended bench top processing of plasma samples using untargeted metabolomics. Metabolomics. 2021;17(3):31. DOI: 10.1007/s11306-021-01782-7
- Anderson M. Ensuring biological sample integrity from collection to analysis for LC-MS workflows: case studies illustrating challenges in clinical trials. Bioanalysis. 2019;11(20):1859-1866. DOI: 10.4155/bio-2019-0176
- Njumbe Ediage E, Dillen L, Vroman A, Diels L, Kunze A, Snoeys J, Verhaeghe T. Development of an LC-MS method to quantify coproporphyrin I and III as endogenous biomarkers for drug transporter-mediated drug-drug interactions. J Chromatogr B. 2018;1073:80-89. DOI: 10.1016/j.jchromb.2017.12.008
- Li W, Jian W, Fu Y, editors. Sample Preparation in LC-MS Bioanalysis. Hoboken: Wiley; 2019. DOI: 10.1002/9781119274315
Related Services


