HRMS Discovery Workflows and Experimental Design
A metabolite that is missed at the data acquisition stage is gone forever — no post-acquisition software magic can recover a metabolite that was never ionized, never fragmented, or buried beneath background noise. Advanced MetID begins with experimental design, not data processing, and the quality ceiling of every metabolite profile is set by the incubation, sample preparation, and acquisition strategy chosen before the first injection.
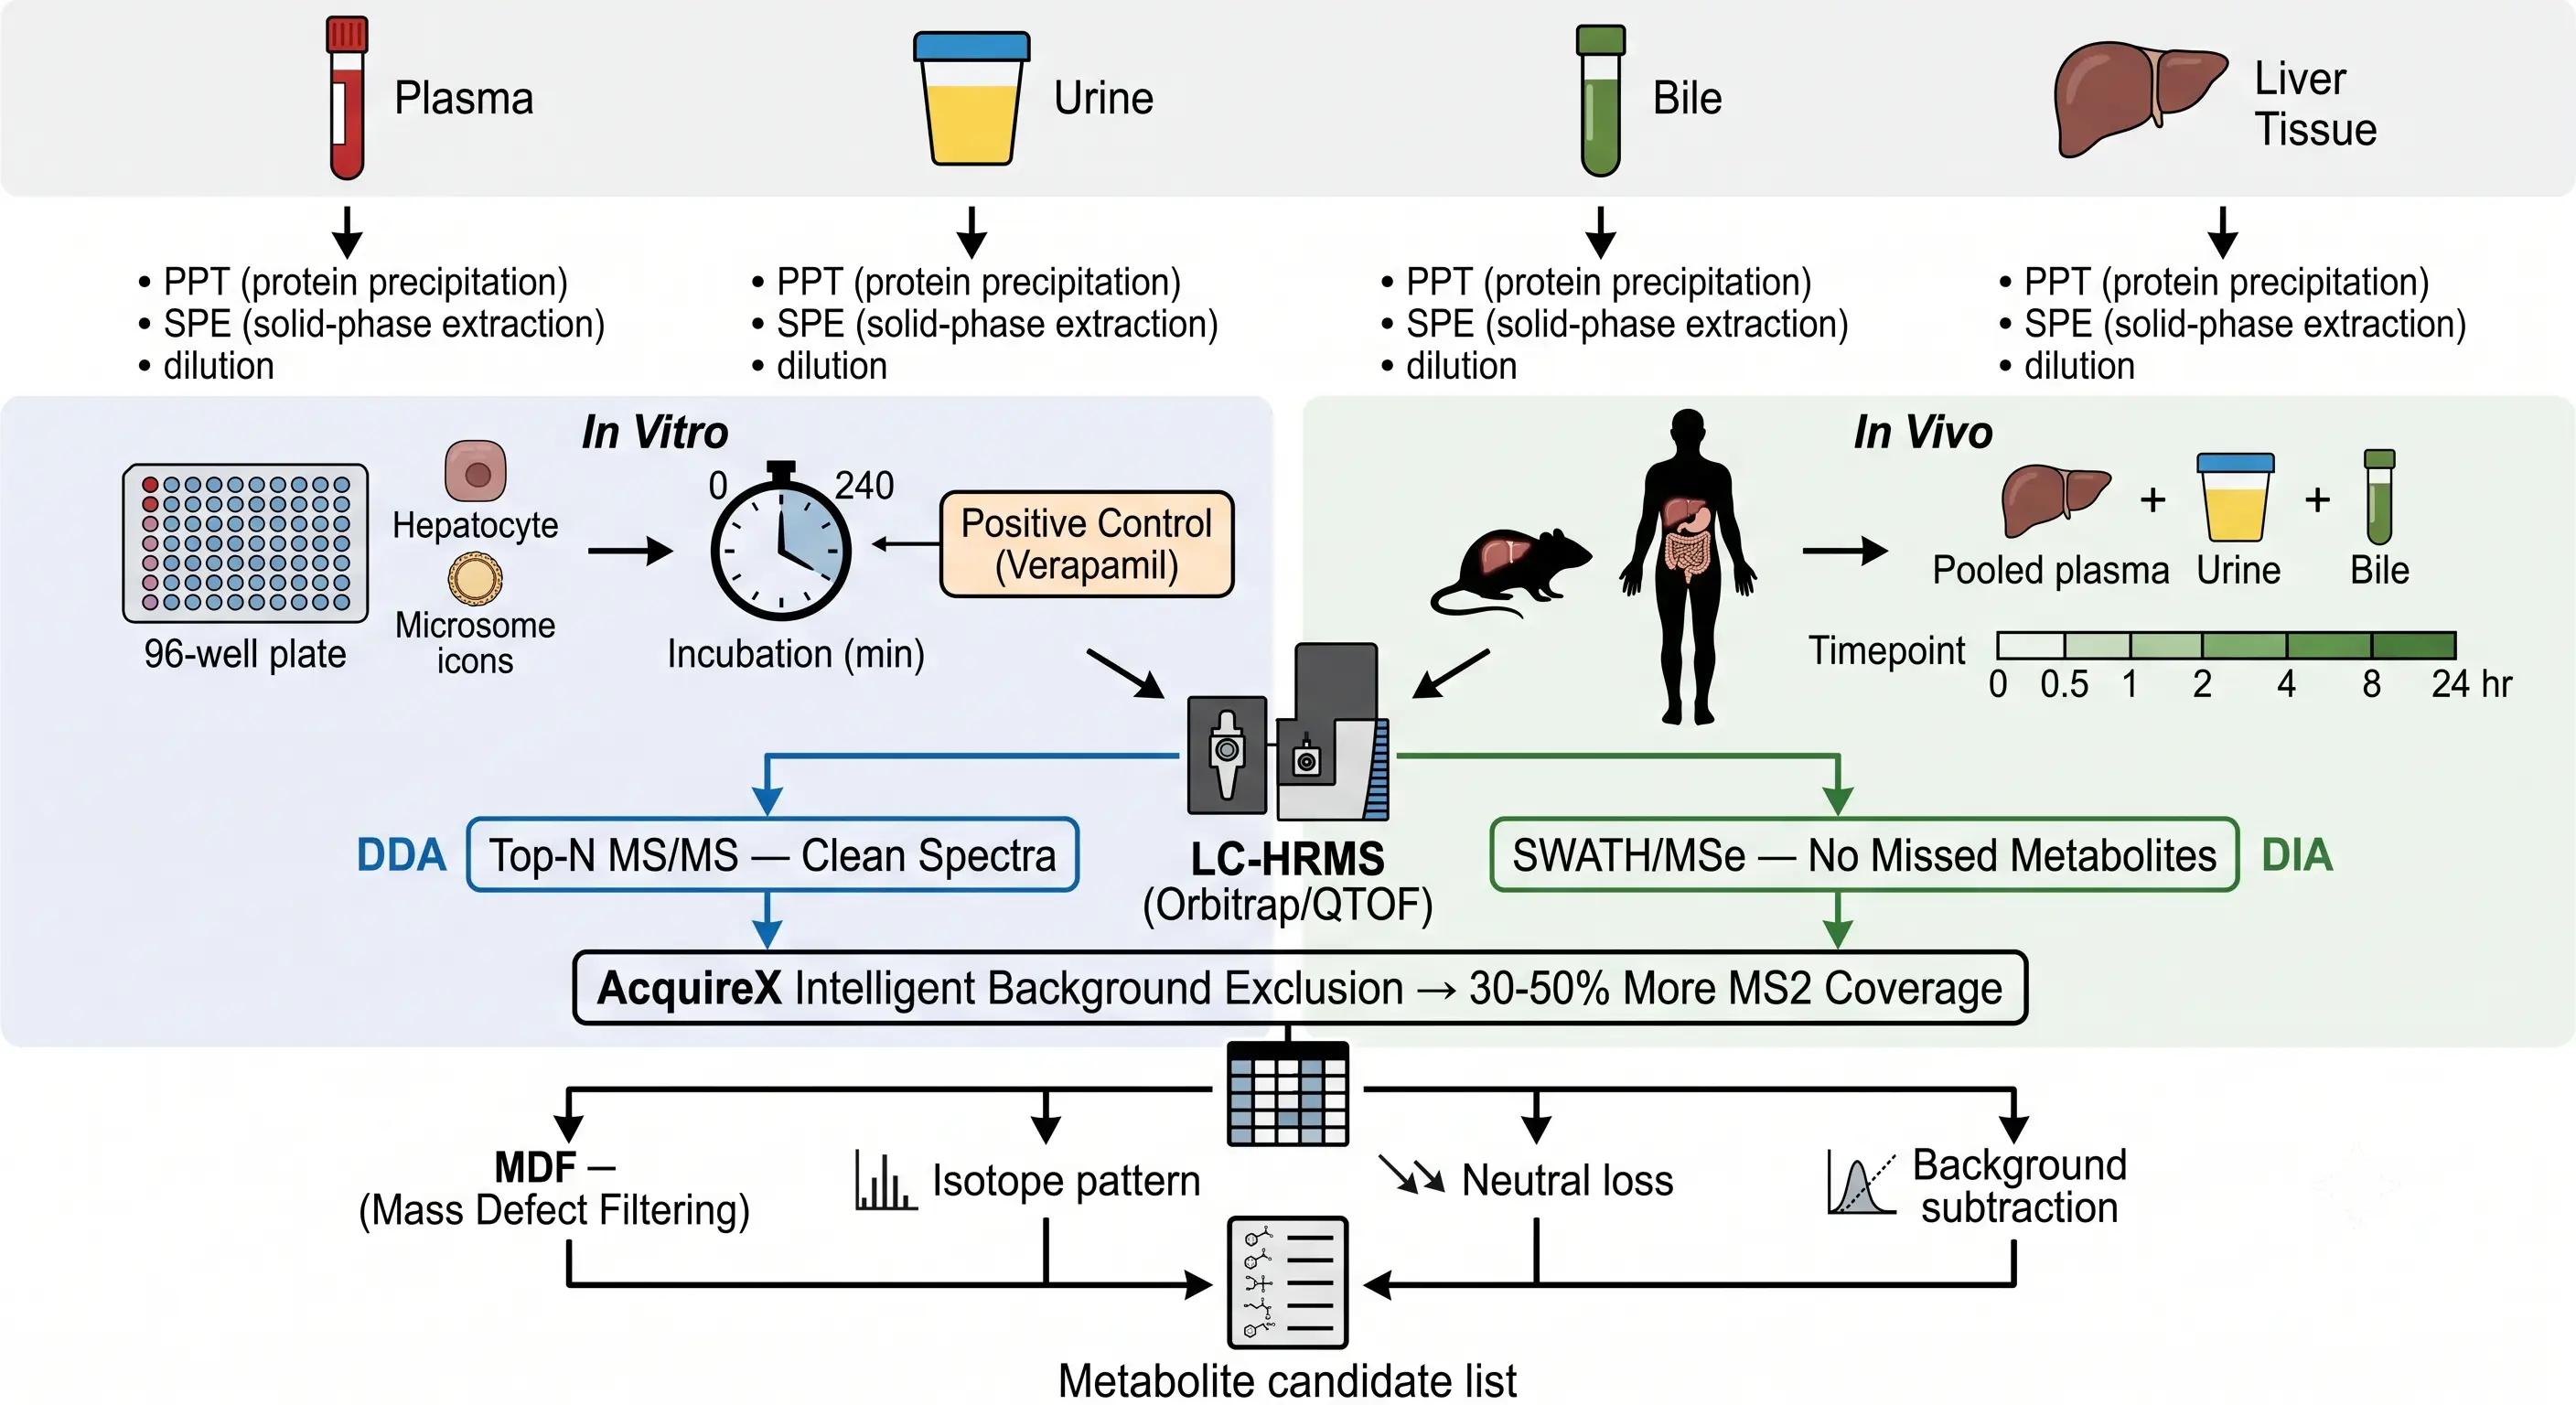 Figure 1: HRMS Discovery MetID Workflow — Experimental Design from Sample to Spectrum
Sample preparation is the first decision node and the most common source of systematic metabolite loss. Protein precipitation (PPT) with 2-3 volumes of acetonitrile or methanol is fast and broadly applicable but loses highly polar metabolites to the aqueous supernatant and non-specifically binds lipophilic metabolites to the precipitated protein pellet. Solid-phase extraction (SPE) provides cleaner extracts and the ability to fractionate by polarity, but SPE cartridge chemistry must be matched to the expected metabolite physicochemical space — a reversed-phase C18 cartridge will not retain Phase II sulfate conjugates or highly polar oxidative metabolites, requiring either mixed-mode sorbents or a complementary HILIC separation. For tissue homogenates and feces, an additional desalting or lipid-removal step is essential — phospholipids and bile acids in tissue extracts cause severe ion suppression that can render low-abundance metabolites invisible.
The incubation system determines which metabolites can be formed. Liver microsomes + NADPH + UDPGA provide CYP and UGT activity in a reproducible, high-throughput format and are the default discovery system, but they miss aldehyde oxidase, sulfotransferases, and all transporter-dependent processes. S9 fraction adds cytosol for broader enzyme coverage. Suspension hepatocytes (4-6 hour viability) provide the most complete in vitro metabolic system and are the standard for definitive human MetID — the Ahlqvist et al. 2025 AstraZeneca dataset, analyzing 120 compounds across pooled human hepatocyte incubations (1 million cells/mL, 4 µM substrate, 120 min), found that compounds averaged 3-8 metabolites each with oxidation dominating Phase I (50-60%) and glucuronidation as the most common Phase II pathway. Plated hepatocytes extend viability to 72 hours for low-turnover compounds. The key experimental control: one incubation condition should use substrate concentration at 1-10 µM (therapeutic range), not 50-100 µM — supra-pharmacological concentrations saturate high-affinity pathways and exaggerate low-affinity ones, distorting the metabolite profile in ways that mislead structural interpretation.
In vivo, each matrix reveals a different metabolite window. Plasma captures circulating metabolites. Urine concentrates renally cleared metabolites 10- to 1,000-fold and is enriched in Phase II conjugates. Bile is the primary reservoir for hepatobiliary metabolites and is often the richest matrix for MetID — a metabolite abundant in bile may be undetectable in plasma. Feces contains unabsorbed drug, biliary excretion products, and gut microbiome metabolites including unique reduction and deconjugation products absent from hepatocyte systems. For comprehensive in vivo MetID, all four matrices should be profiled; for focused discovery MetID, pooled plasma from the Cmax timepoint plus a later timepoint captures the circulating metabolite profile relevant to MIST.
The MS acquisition strategy determines what is detected and how well it can be identified. Data-dependent acquisition (DDA, Top-N) produces clean MS2 spectra ideal for structural elucidation but biases toward the most abundant precursors — the fewest and lowest-abundance metabolites are least likely to trigger MS2. Data-independent acquisition (DIA, SWATH/MSe) fragments everything, ensuring no metabolite goes un-fragmented, but produces complex chimeric spectra where fragment ions from multiple co-eluting precursors are superimposed, requiring computational deconvolution. The recommended strategy combines both: one DIA injection for unbiased detection followed by confirmatory DDA injections. Intelligent background exclusion (AcquireX on Thermo platforms) improves DDA coverage by 30-50%: MS1 features present in a blank or control injection are added to an exclusion list, and the instrument's MS2 duty cycle is directed toward lower-abundance drug-related peaks that would otherwise be skipped. Multiple collision energies (e.g., 20, 35, 50 eV) and polarity switching in a single run maximize information content per injection.
The underlying analytical platform that makes all HRMS-based MetID possible is LC-MS/MS single drug quantification — the parent drug's chromatographic retention, MS2 fragmentation pattern, and MRM behavior serve as the reference frame against which every metabolite is identified and characterized.
Tandem MS Fragmentation Interpretation and Annotated Spectra
The mass spectrometer proposes; the analyst decides. Software will generate a list of candidate metabolites with mass errors, formula matches, and fragmentation scores — but confident structural assignment still requires an experienced analyst to interpret the MS2 spectrum, trace fragment ions back to the parent structure, distinguish real biotransformation evidence from artifacts, and recognize when the data are insufficient for a definitive assignment. MS2 fragmentation interpretation is the core intellectual skill of MetID, and it is not automatable with current technology.
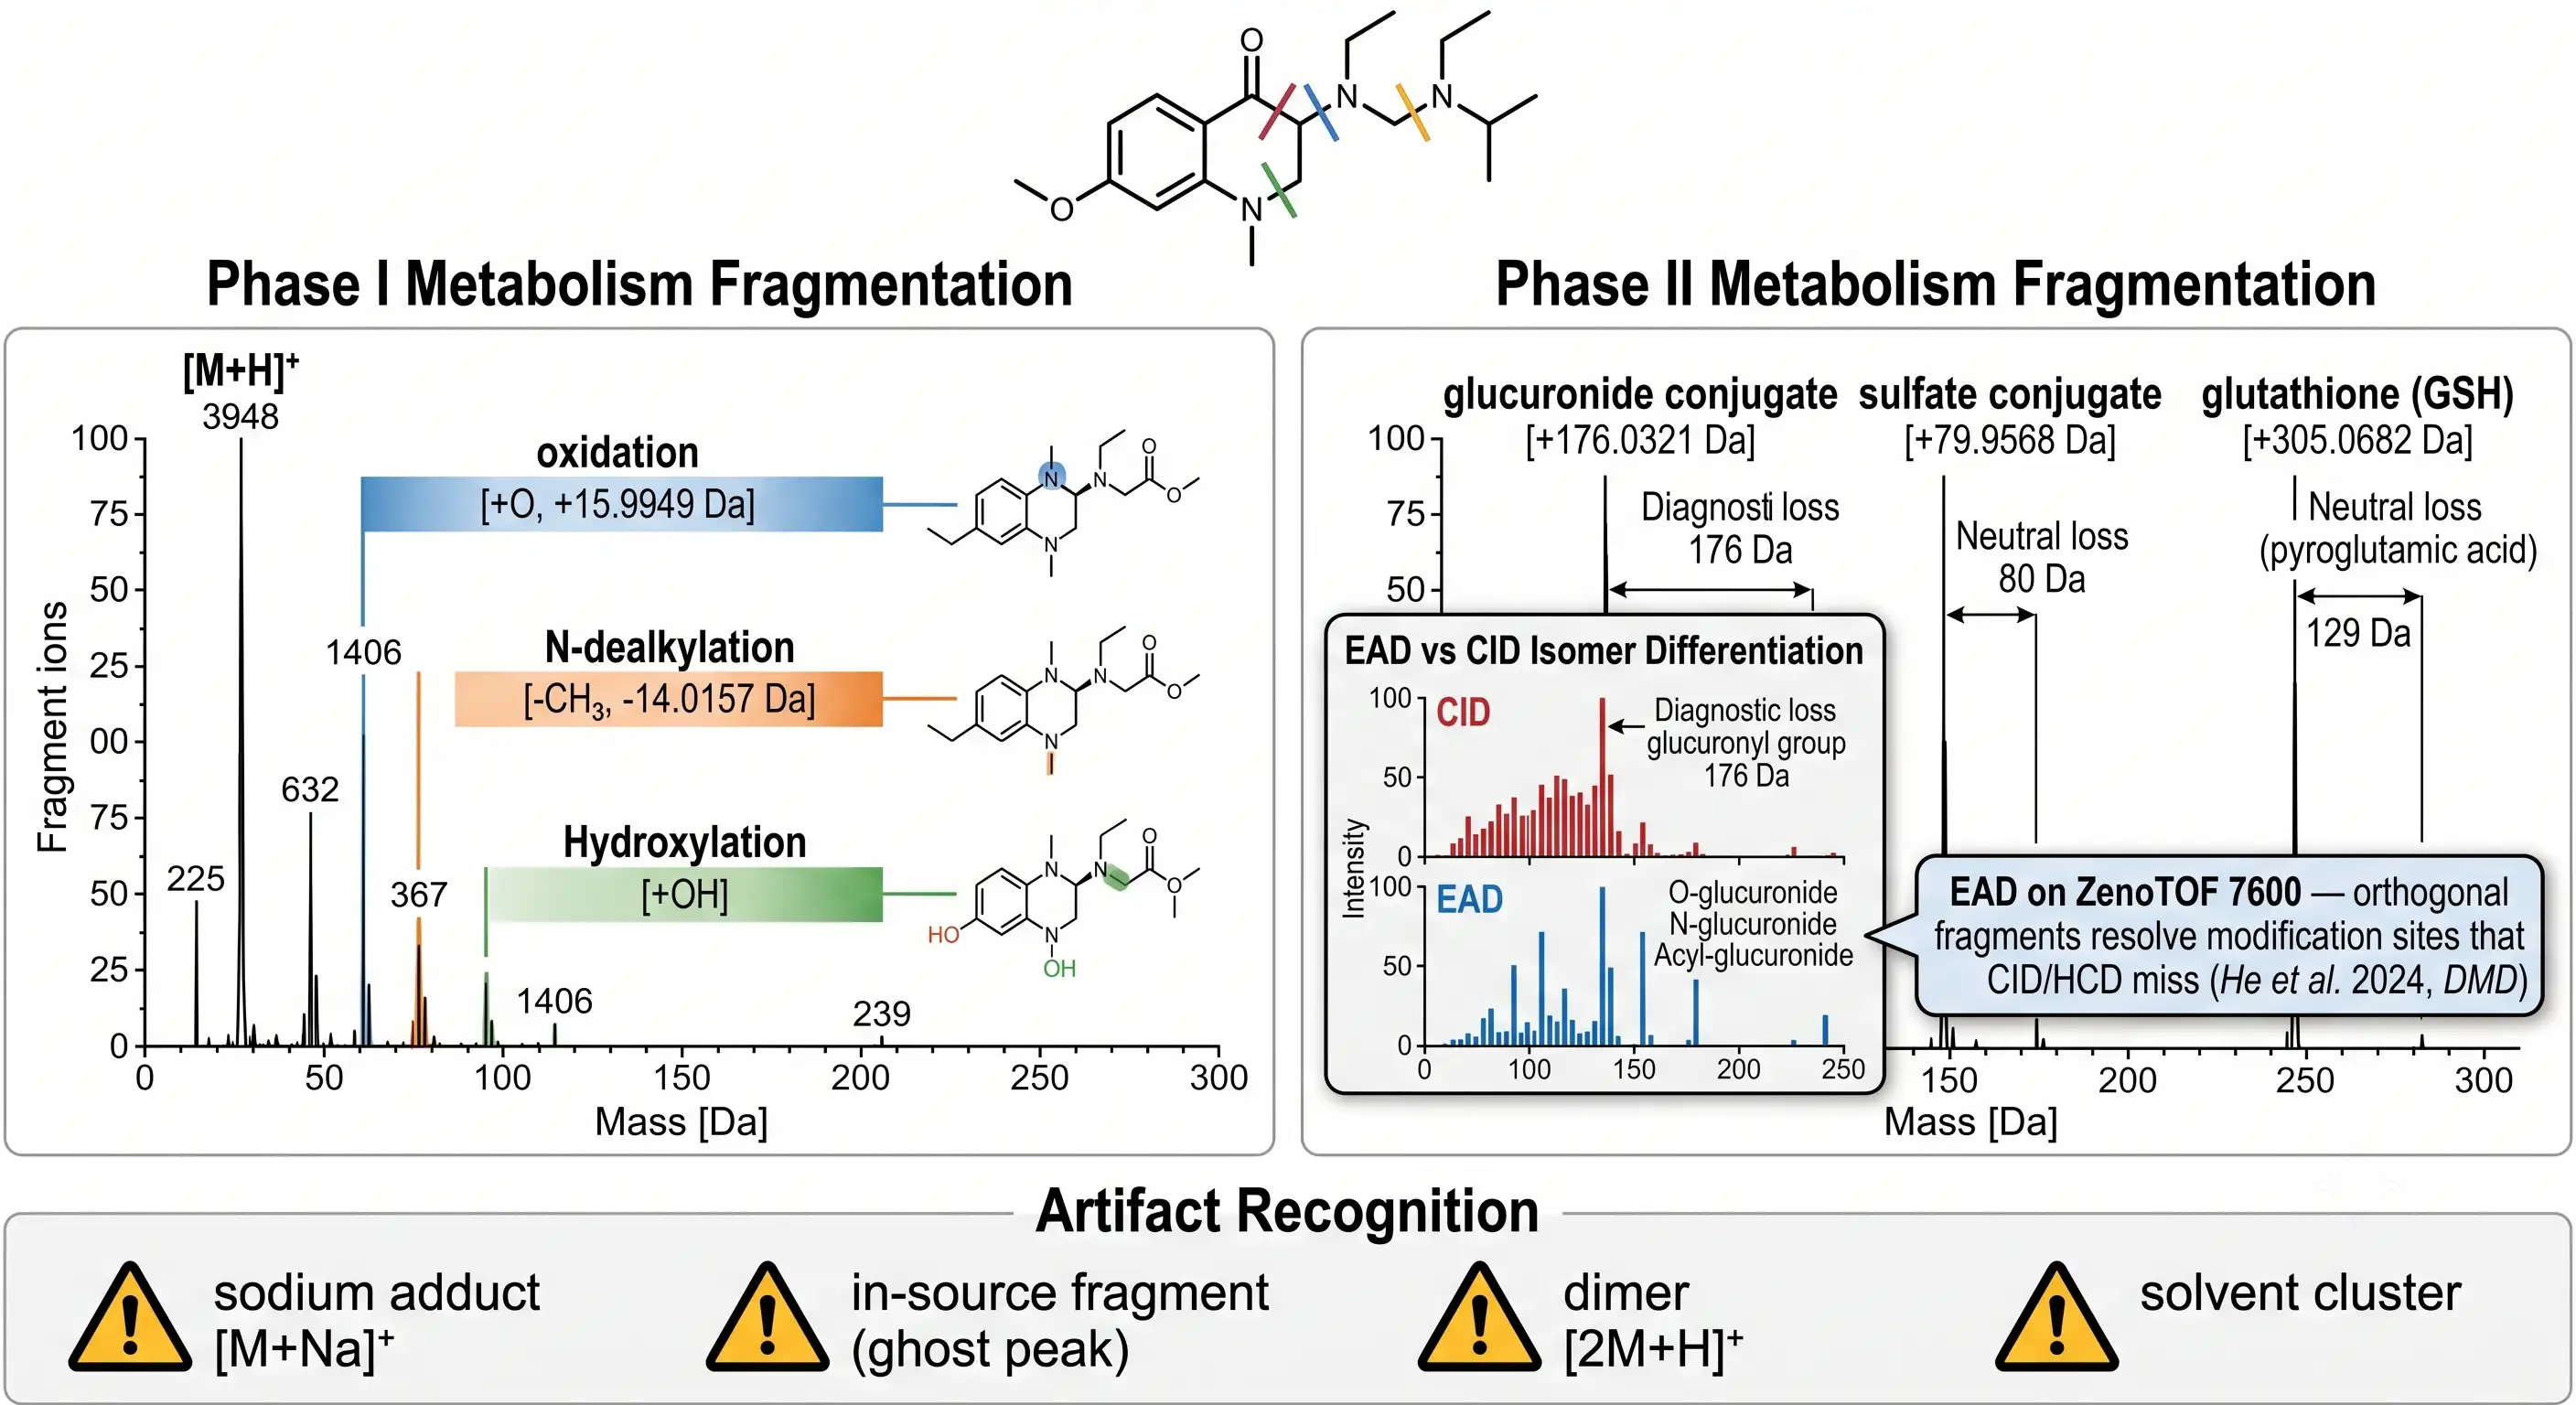 Figure 2: MS2 Spectral Annotation — Fragment Logic for Phase I and Phase II Metabolites
Phase I metabolite fragment interpretation follows a logical subtraction logic: the parent drug's MS2 fragmentation pattern is the reference, and every metabolite's fragmentation is compared against it. If a fragment ion that was present in the parent spectrum shifts by a specific mass in the metabolite spectrum, the modification is on the portion of the molecule that produced that fragment. If a fragment ion is unchanged, the modification is on a different portion of the molecule. This is how site-of-metabolism assignment works — but it requires that the parent fragmentation is well-understood. A parent drug whose MS2 spectrum collapses everything into a single dominant fragment ion is a poor candidate for confident site-of-metabolism determination by MS2 alone.
The key mass shifts and their diagnostic interpretation: +O (+15.9949 Da) indicates mono-oxidation — hydroxylation (aliphatic or aromatic), N-oxidation, or S-oxidation; the exact site is distinguished by fragment ion shifts, not by the parent mass shift alone. +2O (+31.9898 Da) indicates di-oxidation or, in some cases, oxidative deamination. −CH2 (−14.0157 Da) indicates N- or O-demethylation. −C2H4 (−28.0313 Da) indicates N-deethylation or di-demethylation. Phase II conjugates produce larger, diagnostic mass shifts: +176.0321 Da (glucuronide), +79.9568 Da (sulfate), +305.0682 Da (glutathione, often followed by further metabolism to cysteinyl-glycine and cysteine conjugates), +42.0106 Da (acetyl), +57.0215 Da (glycine). Each conjugate also produces a characteristic neutral loss in MS2: −176 Da (glucuronyl), −80 Da (SO3 from sulfate), −129 Da (pyroglutamic acid from GSH), −42 Da (ketene from acetyl). If you see the parent mass shift but not the characteristic neutral loss, the conjugate assignment is unconfirmed — the mass match alone has too many isobaric possibilities.
Artifact recognition is as important as metabolite recognition. Sodium adducts ([M+Na]+ at M + 21.9819 Da) and potassium adducts ([M+K]+ at M + 37.9553 Da) are non-covalent artifacts, not metabolites. In-source fragmentation — where labile conjugates (N-oxides, sulfates, some glucuronides) fragment in the ion source rather than the collision cell — can produce fragment ions that masquerade as metabolites. A peak that has identical retention time and identical peak shape to the parent drug but a mass shift consistent with a known adduct or in-source fragment is an artifact, not a metabolite. The diagnostic test: if the "metabolite" peak area ratio to parent is identical across different collision energies and source conditions, it is an in-source fragment; if the ratio changes, it may be a genuine metabolite.
EAD (electron-activated dissociation) is the most important advance in metabolite structural elucidation since the Orbitrap. CID/HCD fragmentation is collision-based: the weakest bonds break first. For glucuronide conjugates, the labile glycosidic bond always breaks before the drug scaffold, producing a dominant neutral loss of 176 Da but no information about whether the glucuronidation occurred at an alcohol (O-glucuronide), amine (N-glucuronide), or carboxylic acid (acyl-glucuronide). EAD fragmentation is electron-based and radical-driven — it preserves conjugation bonds while fragmenting the drug scaffold, producing unique fragment ions diagnostic of the attachment site. Three independent 2024 studies confirmed this capability: He et al. (DMD 2024) showed EAD on the ZenoTOF 7600 successfully localized modification sites for all 12 vepdegestrant metabolites including three O-glucuronides and three Phase I metabolites that CID/HCD failed to resolve. Yao et al. (RCM 2024, Bristol Myers Squibb) demonstrated EAD's ability to narrow the conceptual "box" for glucuronide and GSH adduct modification sites. Tang et al. (IJMS 2024, Genentech) showed that EED (electronic excitation dissociation) differentiated all three common isomeric glucuronide types — acyl-, N-, and O-glucuronides — of darunavir, GDC-0810, and GDC-0919 without derivatization. When the parent MS2 spectrum shows only the neutral loss of the conjugate with no scaffold fragmentation, EAD is no longer optional — it is the only technique that can localize the modification site.
Stable Isotope Labeling and Quantitative Metabolite Analysis
In a complex biological matrix, distinguishing drug-related metabolites from endogenous compounds is the fundamental MetID challenge. Stable isotope labeling solves this by encoding the drug with a mass tag that all its metabolites inherit — if it contains the isotope pattern, it came from the drug. This is the only detection strategy that is independent of the metabolite's structure, making it uniquely capable of finding unusual, non-enzymatic, or unexpected metabolites that rule-based prediction and mass defect filtering both miss.
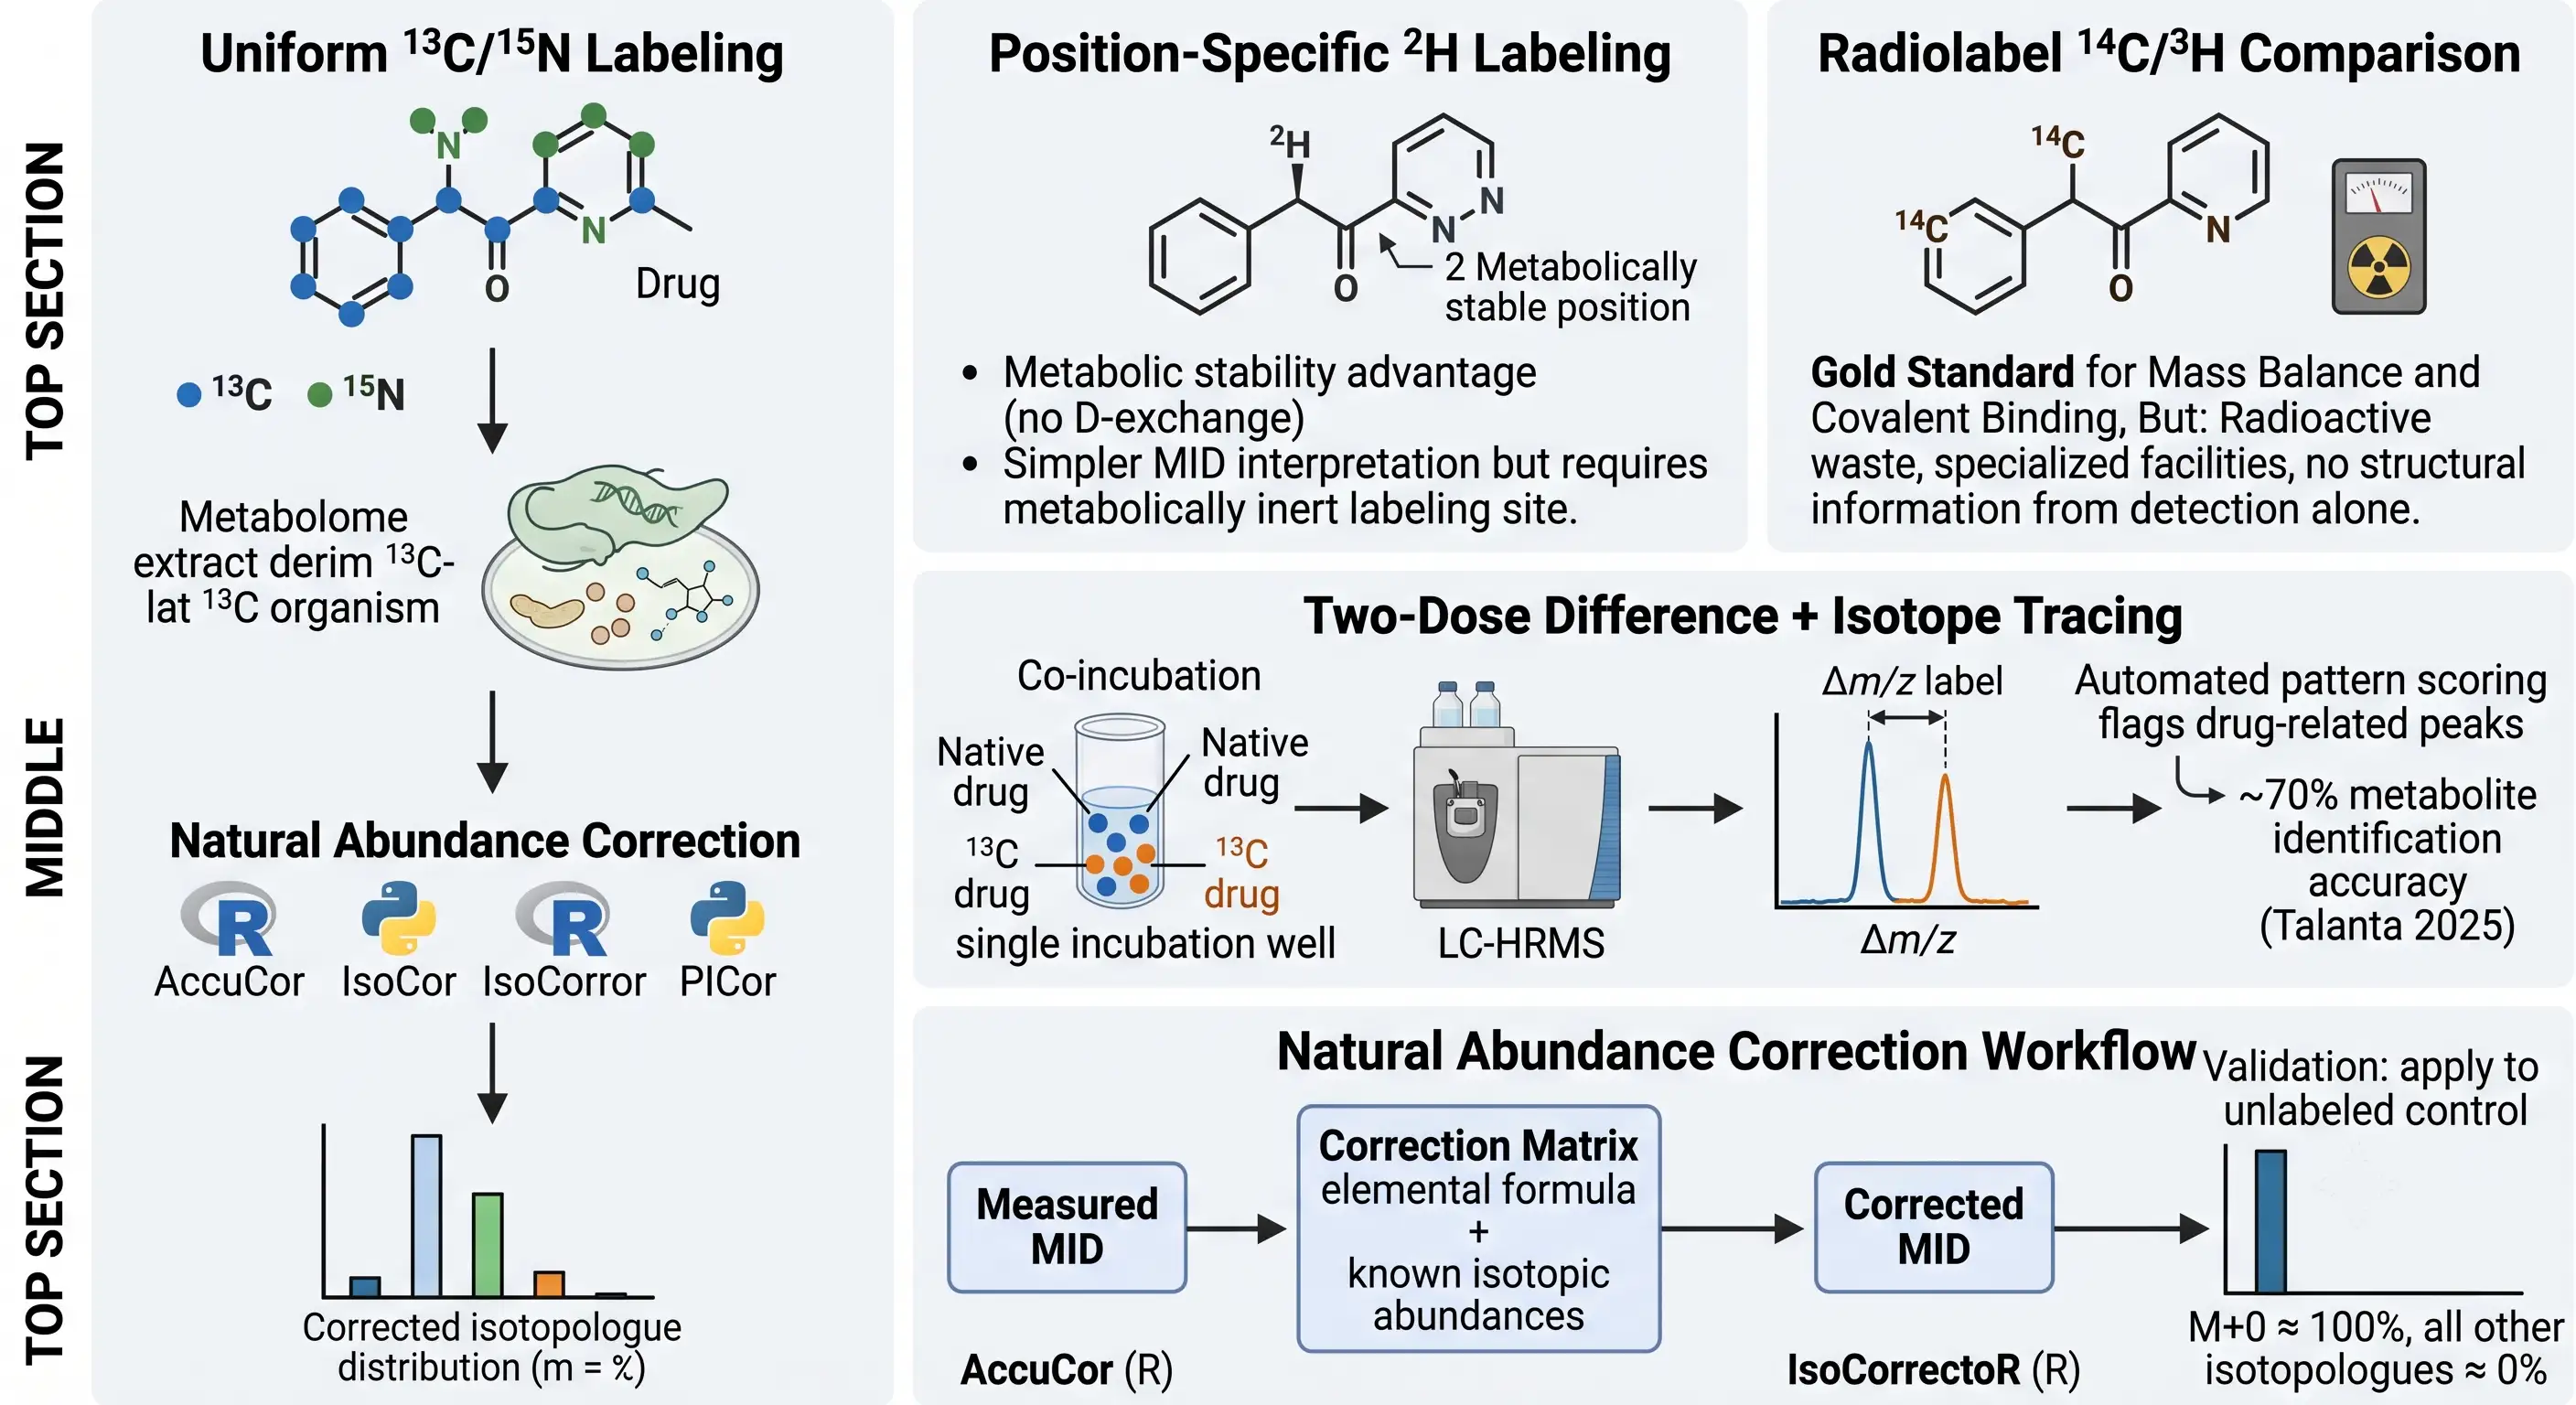 Figure 3: Stable Isotope Labeling Strategies for Drug Metabolite Tracking
Three labeling strategies are used in DMPK, each with distinct trade-offs. Uniform 13C/15N labeling — biosynthetic incorporation of heavy isotopes throughout the drug molecule by feeding 13C-glucose and 15N-ammonium salts to a producing organism — is the most comprehensive approach. Every carbon and nitrogen in the drug is labeled, so every metabolite — regardless of which part of the molecule is modified — retains the isotopic signature. The limitation is practical: biosynthetic access is required, and for synthetic small molecules, this means commissioning a custom fermentation batch from a specialist CRO, at significant cost and lead time. Position-specific 2H labeling — chemical incorporation of deuterium at a metabolically stable position — is simpler, cheaper, and compatible with standard synthetic chemistry. The risk: if metabolism occurs at or adjacent to the labeled position, the deuterium may be lost through metabolic deuterium exchange or through cleavage of the C-D bond, and the metabolite becomes invisible to isotope tracking.
The two-dose difference + stable isotope tracing (SIT) method provides a pragmatic middle ground for drug metabolite identification. Native drug and isotope-labeled drug (typically 13C or 15N) are co-incubated in the same sample at different concentrations (e.g., 10 µM native + 1 µM labeled). Drug-related metabolites appear as characteristic doublet peaks in the mass spectrum — two peaks separated by the exact mass difference of the isotopic label, with the native peak being the larger of the two. Automated pattern-scoring algorithms in Compound Discoverer and MetabolitePilot flag these doublets as drug-related, distinguishing them from single-peak endogenous matrix components. Published validation studies have reported ~70% metabolite identification accuracy with isotope tracing approaches, outperforming mass defect filter, dose-response, and OPLS-DA methods individually — though combining all four methods provides the most comprehensive coverage.
Natural abundance correction is the computational step that separates quantitative isotope tracing from qualitative pattern matching. Naturally occurring heavy isotopes (13C ~1.1%, 15N ~0.37%, 2H ~0.015%, 18O ~0.2%) produce a baseline signal at M+1, M+2, etc. in every mass spectrum, regardless of whether labeled drug was administered. If this natural background is not mathematically removed, isotopic enrichment is systematically overestimated. The modern "skewed" correction method uses a matrix-based deconvolution — Corrected MID = CM−1 × Measured MID — where CM is constructed from the elemental formula of each metabolite and the known natural abundances of each element. The critical input parameters: correct molecular formula (including derivatization reagents for GC-MS), tracer isotopic purity from the certificate of analysis (commercial tracers are typically ≥98-99 atom%, not 100%), and instrument mass resolution (for high-resolution Orbitrap data, resolution-dependent correction is required). Four software packages implement this correction: AccuCor (R, supports 13C/2H/15N on Orbitrap platforms), IsoCor (Python, corrects for both natural abundance and tracer impurity), IsoCorrectoR (R, handles MS and MS/MS data), and PICor (Python, supports simultaneous 13C + 15N dual-isotope experiments). Validation protocol: apply the correction to an unlabeled control sample — a correct correction should yield M+0 ≈ 100% with all other isotopologues ≈ 0%.
For quantitative metabolite analysis where authentic standards are available, drug metabolite quantification by LC-MS/MS using stable isotope-labeled internal standards (SIL-IS) remains the gold standard for correcting matrix effects, recovery variations, and ion suppression — 13C/15N-labeled IS are preferred over 2H-labeled IS to avoid deuterium-related retention time shifts on reversed-phase columns.
Identification Confidence, Scoring Systems, and Software Integration
A metabolite peak list without confidence levels is a list of hypotheses, not a list of identifications. Regulators, journal reviewers, and downstream project teams all need to know how strong the structural evidence is for each reported metabolite — and the five-level Metabolite Standards Initiative (MSI) framework, established in 2007 and refined in 2014, remains the universal language for expressing that evidence. What has changed in 2024-2025 is the emergence of quantitative, automated alternatives that address the framework's long-standing subjectivity problem.
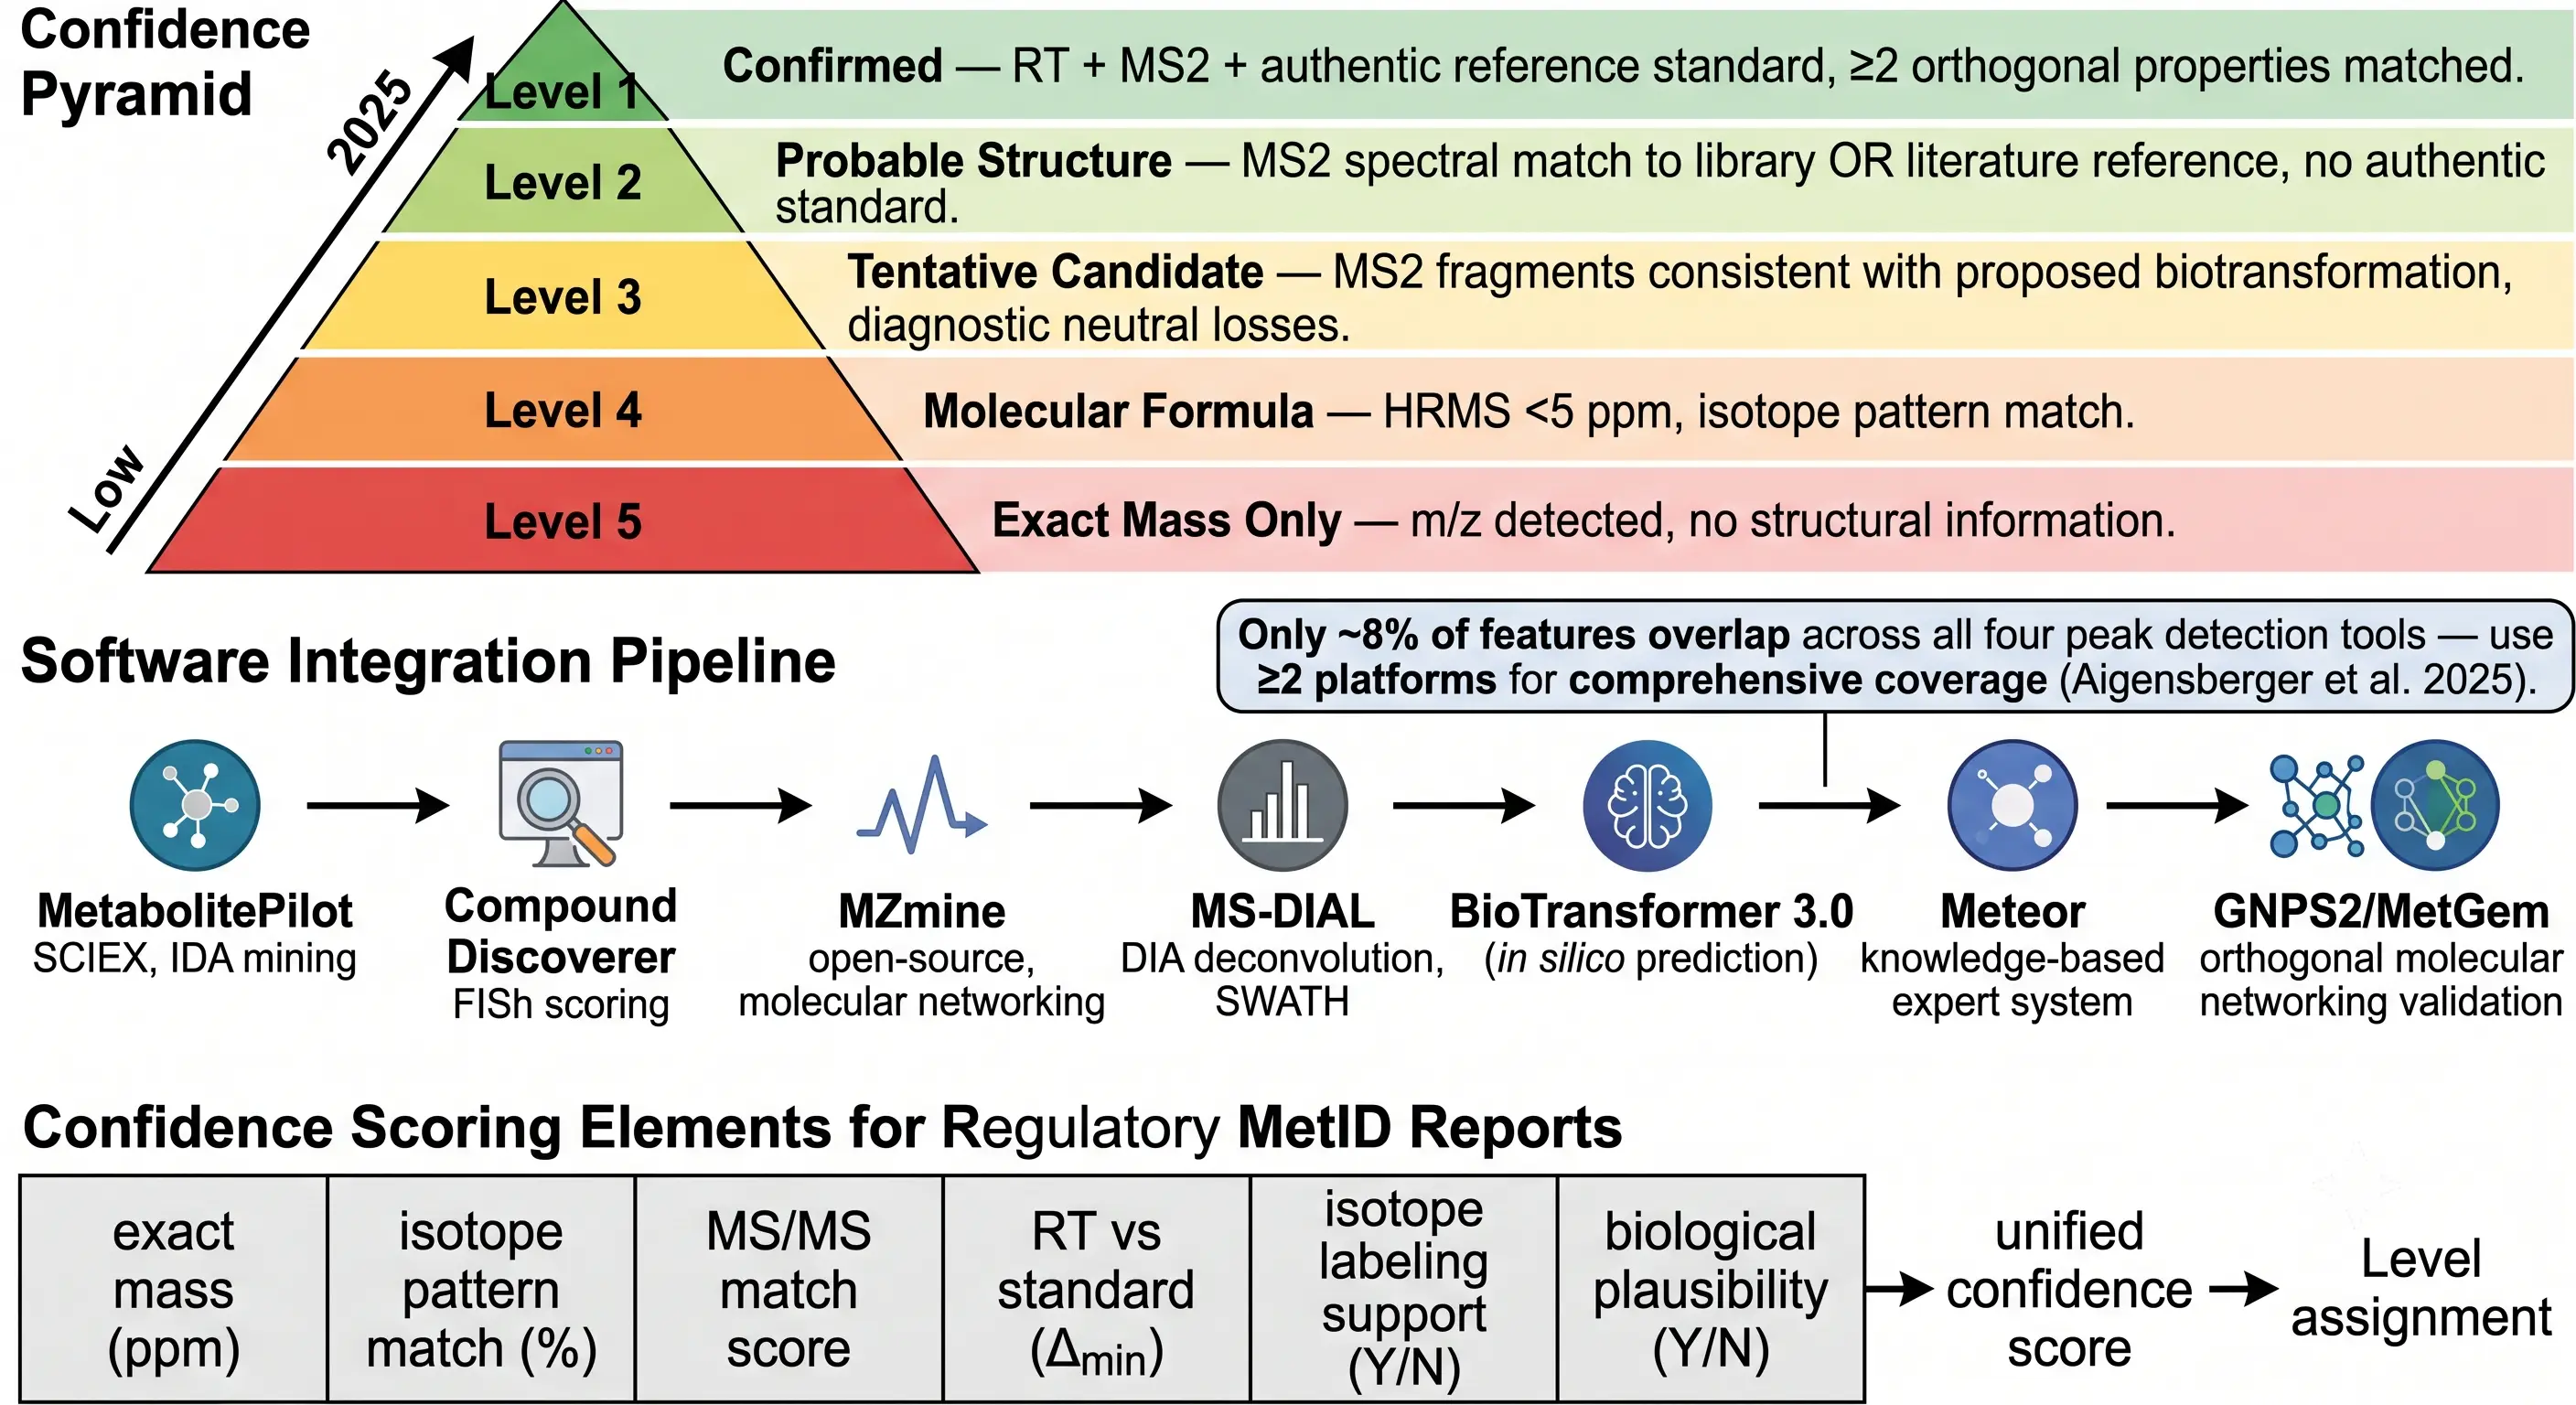 Figure 4: Identification Confidence Framework — MSI Levels, Scoring Systems, and Multi-Software Integration
The MSI framework is a five-tier evidence hierarchy, not a score. Level 5 (Exact Mass): an m/z was detected — no structural information. Level 4 (Molecular Formula): accurate mass (<5 ppm on HRMS) plus isotope pattern match yields unequivocal formula — screening-level identification only. Level 3 (Tentative Candidate): MS2 fragmentation is consistent with a proposed biotransformation on the parent structure — the discovery MetID workhorse. Level 3 is sufficient for lead optimization and candidate differentiation but insufficient for regulatory MIST decisions, because a single MS2 spectrum is often consistent with multiple isomeric structures. Level 2 (Probable Structure): MS2 spectral match to a library (mzCloud, MassBank, in-house database) or to a literature reference, diagnostic evidence from orthogonal techniques (ion mobility CCS, EAD fragment pattern, NMR for isolated metabolites) — substantially higher confidence and generally acceptable for regulatory metabolite profiling when a reference standard is unavailable. Level 1 (Confirmed): matching retention time and MS2 spectrum against an authentic reference standard analyzed under identical analytical conditions, with ≥2 orthogonal properties matched — the regulatory gold standard.
The 2025 "Identification Probability" framework by Metz et al. (Analytical Chemistry) addresses the MSI framework's critical weakness: a Level 3 assignment means "the proposed structure is consistent with the data" but says nothing about how many other structures are also consistent with the same data. Identification Probability = 1/N, where N is the number of compounds in a defined reference database (e.g., HMDB with >248,000 compounds) that match the experimental feature within user-defined measurement precision windows (mass, retention time, CCS). A metabolite with only one database match has Identification Probability = 1.0; a metabolite with 50 equally plausible matches has Identification Probability = 0.02. This framework is computable, automated, and transferable across laboratories — a significant step toward making metabolite identification confidence a quantitative metric rather than a curator's judgment call.
The scoring elements that feed into MetID confidence are unified across platforms even though the software implementations differ. Exact mass accuracy (ppm or mDa error) is the first filter — <3 ppm on a modern Orbitrap or QTOF eliminates most false molecular formulas. Isotope pattern match score (typically ≥80% for acceptance) confirms the elemental composition and can detect halogenated metabolites through their characteristic isotope envelopes. MS2 fragment match score — whether from library search (cosine similarity ≥0.7), FISh scoring (in silico fragment annotation), or manual interpretation — is the most discriminating evidence for structural assignment. Retention time is underutilized: a metabolite is always more polar than the parent (except for some acyl glucuronides and N-oxides where the effect can be non-monotonic), and metabolites of the same biotransformation class cluster in retention time space. Isotope labeling support provides a binary confirmation that the metabolite is drug-derived. Biological plausibility — whether the proposed biotransformation is consistent with the known metabolic pathways of the drug's chemical class — adds a qualitative weight that experienced MetID analysts apply routinely but that no software captures automatically.
The software integration strategy matters because no single platform captures everything. A 2025 cross-platform comparison by Aigensberger et al. (Analytica Chimica Acta) evaluated XCMS, Compound Discoverer, MS-DIAL, and MZmine on identical LC-HRMS datasets and found that only ~8% of features overlapped across all four peak-picking algorithms. MS-DIAL showed the greatest similarity to manual integration, but the key finding is that using only one platform guarantees missing metabolites. The practical pipeline: one vendor-integrated commercial platform aligned with your MS instrument (Compound Discoverer for Thermo Orbitrap, featuring automated FISh scoring and mzCloud library integration; MetabolitePilot for SCIEX QTOF, with parallel predicted/unexpected metabolite mining algorithms) for primary processing, plus one open-source platform for orthogonal validation (MZmine for flexible preprocessing and GNPS2 molecular networking integration; MS-DIAL for DIA/SWATH data deconvolution where it outperforms all other tools). In silico prediction tools — BioTransformer 3.0 (free, rule-based) and Meteor (commercial, knowledge-based expert system incorporating curated literature metabolism rules) — fill the gap when experimental MS2 data are inconclusive by predicting which biotransformations are mechanistically plausible for the specific chemical structure, narrowing the candidate list for manual review.
Once metabolites are identified and structurally characterized, downstream metabolite tracking maps the sequential biotransformation cascades — each metabolite in the pathway is a node, and the complete pathway picture is essential for understanding whether a metabolite is a primary product or a secondary product that will accumulate or disappear depending on the relative kinetics of each enzymatic step.
Regulatory Expectations, Reporting Best Practices, and Case Studies
The regulatory purpose of MetID is MIST — Metabolites in Safety Testing — and the MIST question is binary: is every human metabolite present at >10% of total drug-related exposure adequately covered by exposure in at least one preclinical toxicology species? The FDA MIST guidance (Revision 2, March 2020) and ICH M3(R2) provide the framework, but the operational challenge is translating an HRMS metabolite profile into a regulatory submission that reviewers can audit, understand, and sign off on.
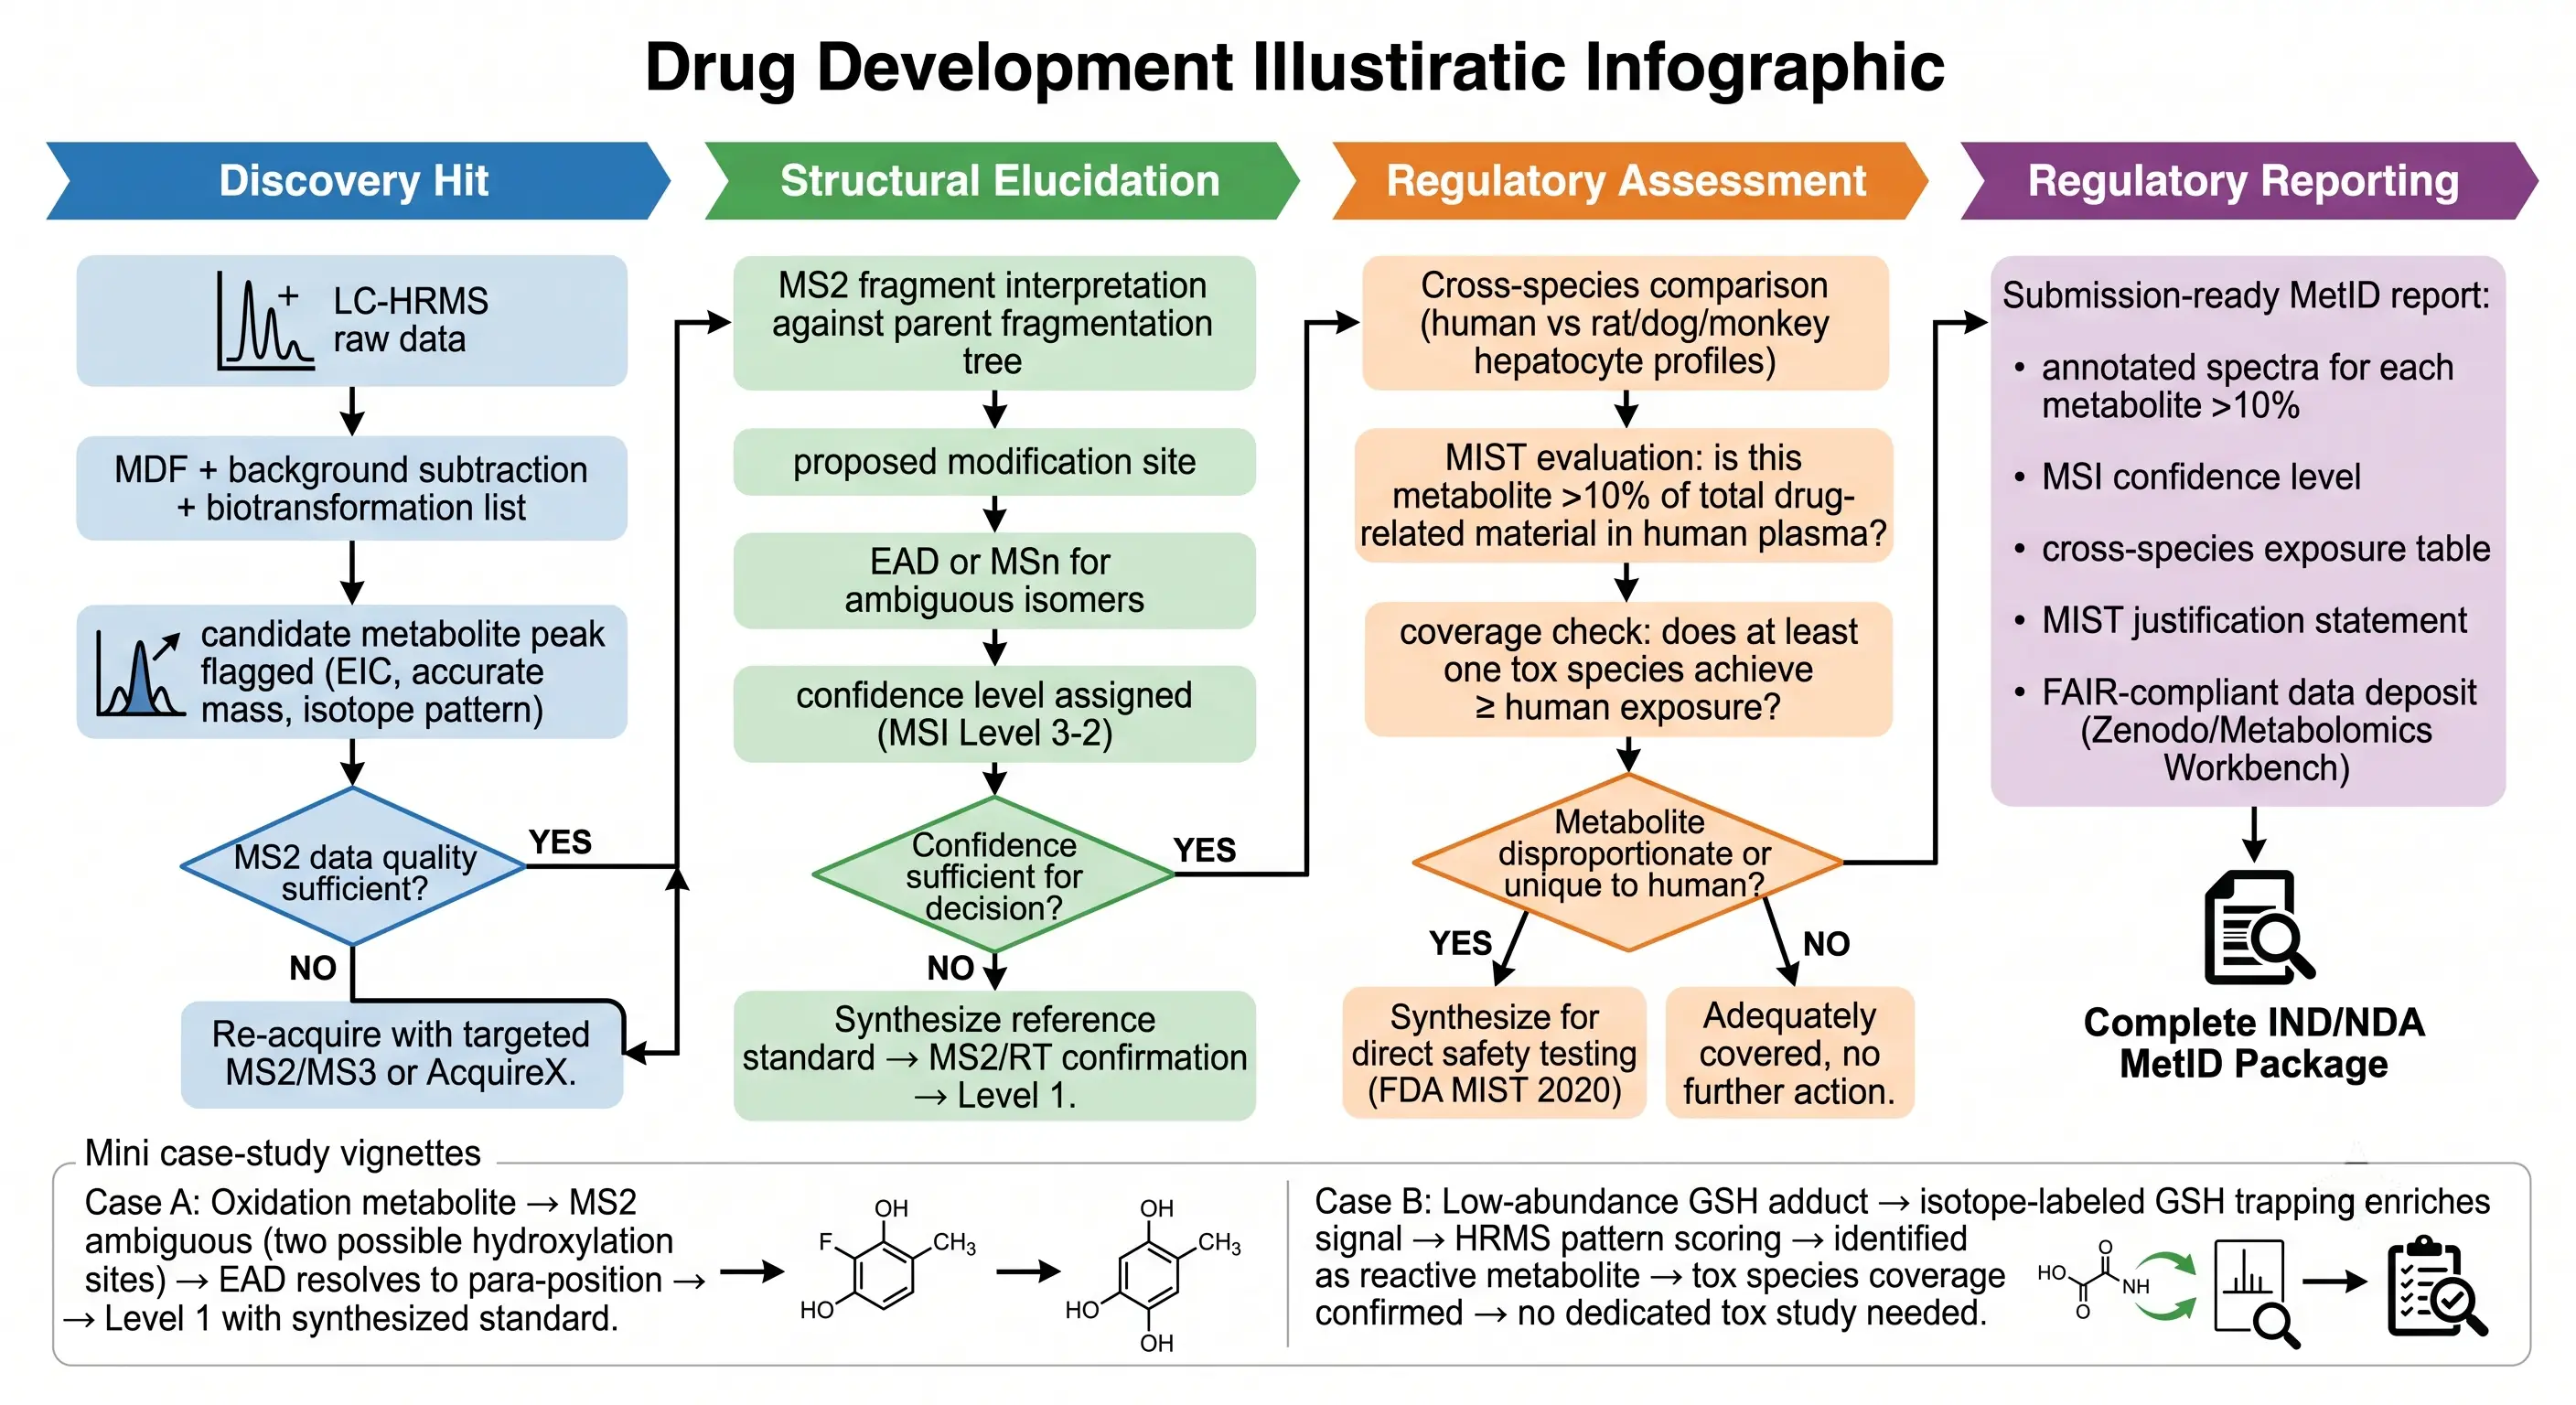 Figure 5: From Discovery HRMS Hit to Regulatory MetID Report — A Practical Decision Tree
The regulatory MetID workflow has four phases. Phase 1 — Discovery: LC-HRMS data from human hepatocyte incubation (and later, human in vivo samples) is processed through MDF, background subtraction, and biotransformation list matching to generate a candidate metabolite list. Every peak is assigned a preliminary MSI confidence level. Metabolites that appear to exceed the 10% threshold based on UV or MS peak area are flagged for priority structural characterization. Phase 2 — Structural Elucidation: flagged metabolites undergo detailed MS2 (and, where necessary, MS3 or EAD) analysis against the parent fragmentation reference frame. The modification site is localized to a specific atom or region of the molecule. If the data are insufficient for a definitive assignment at Level 2 or better — common for isomeric metabolites where multiple modification sites are equally compatible with the MS2 data — EAD or MSn is performed, or the decision is made to synthesize the metabolite standard. Phase 3 — Cross-Species Comparison: the same MetID workflow is executed on hepatocyte incubations (and, when available, in vivo samples) from rat, dog, and monkey. Each metabolite's exposure is compared across species — if any tox species achieves exposure ≥ the human exposure, the metabolite is "covered." Phase 4 — Regulatory Reporting: for each metabolite >10% of total drug-related material in human plasma, the submission contains: (a) annotated MS2 spectrum with fragment ion assignments; (b) MSI confidence level with justification; (c) cross-species exposure table (AUC ratio or peak area ratio); (d) a MIST conclusion statement (covered/not covered); and (e) if not covered, a plan for metabolite synthesis and dedicated safety testing or a scientific justification for waiver.
Two common scenarios illustrate the decision logic. Scenario A — Oxidation metabolite, MS2 ambiguous. A +O metabolite (M+16) is detected in human hepatocytes at ~15% of parent peak area. MS2 shows the parent's core fragments all shifted by +16, confirming the modification is on the core scaffold, but two aromatic positions are equally possible hydroxylation sites. CID at multiple energies shows the same fragment pattern — both isomers are CID-indistinguishable. EAD produces a unique fragment ion at one position, localizing the hydroxylation to the para position. The metabolite is synthesized (or isolated from a scaled-up incubation), and its RT and MS2 match confirms Level 1. Rat and dog hepatocytes form the same metabolite at comparable exposure — covered. Scenario B — Low-abundance reactive metabolite. A GSH conjugate is detected at ~3% of parent peak area in a GSH trapping assay but is not detected in standard (non-trapping) hepatocyte incubation. The GSH adduct is confirmed by isotope-labeled GSH (1:1 unlabeled/[13C2,15N]-GSH, Δ3.0037 Da doublet pattern) and characteristic neutral loss of pyroglutamic acid (129 Da). At 3%, it is below the 10% MIST threshold and does not trigger dedicated safety testing — but the structural alert (the site of GSH conjugation reveals an electrophilic center) is communicated to medicinal chemistry for scaffold redesign. This metabolite would have been missed entirely without the GSH trapping step, illustrating why reactive metabolite screening is a complementary workflow to standard MetID, not a replacement.
The CYP-mediated DDI assessment connects directly to MetID because reaction phenotyping — determining which CYP isoform(s) metabolize the drug — requires knowing which metabolites are formed and in what proportion. A metabolite that accounts for 40% of total clearance and is exclusively formed by CYP3A4 makes the parent drug a CYP3A4 DDI victim; the same metabolite formed equally by CYP3A4 and CYP2D6 makes the parent largely insensitive to CYP3A4 inhibition. MetID data is the input to reaction phenotyping, and its accuracy determines the accuracy of the DDI risk classification.
FAIR data principles — Findable, Accessible, Interoperable, Reusable — are increasingly expected for regulatory MetID datasets. The Ahlqvist et al. 2025 AstraZeneca dataset on Zenodo (120 compounds, full metabolite transformation schemes, public domain) sets the standard for what FAIR MetID data looks like: machine-readable formats, documented experimental conditions, publicly accessible repository, and permissive reuse licensing. For internal drug development programs, the equivalent is a MetID data management plan that specifies: where raw data files are stored, what processed data formats are archived, what metadata fields are recorded for each incubation and each metabolite, and how the data will be retrievable for regulatory inspection five years after submission.
The foundational overview — covering in vitro and in vivo MetID data generation, LC-HRMS data processing with mass defect filtering, the MSI confidence framework, reactive metabolite detection via GSH and cyanide trapping, cross-species metabolite comparison, and MetID trend analysis for medicinal chemistry — is covered in our metabolite identification in drug discovery guide, which should be read before this advanced article.
Frequently Asked Questions
What is the difference between DDA and DIA acquisition for metabolite identification, and which should I use?
Data-dependent acquisition (DDA, also called Top-N) selects the most abundant precursor ions in each MS1 survey scan for sequential MS2 fragmentation — it produces clean, easily interpretable MS2 spectra ideal for structural elucidation, but biases detection toward high-abundance metabolites and may miss low-abundance or co-eluting species. Data-independent acquisition (DIA, including SWATH and MSe) fragments all precursors within defined m/z windows without pre-selection, ensuring no metabolite goes un-fragmented, but produces complex chimeric spectra requiring computational deconvolution. The recommended strategy for comprehensive MetID uses one DIA injection for unbiased detection followed by confirmatory DDA injections. Intelligent background exclusion workflows like AcquireX (Thermo) improve DDA coverage by 30-50% by funneling MS2 time away from background ions and toward lower-abundance drug-related peaks. For regulated MetID supporting regulatory submissions, DDA with background exclusion provides the best balance of coverage and spectral quality.
How does electron-activated dissociation (EAD) improve metabolite structural elucidation compared to CID?
EAD generates product ions through electron-based radical-driven fragmentation, which is mechanistically orthogonal to the collision-based vibrational excitation used by CID/HCD. CID preferentially breaks the weakest bonds — for glucuronide conjugates, this means the labile glycosidic bond is cleaved first, losing the entire glucuronyl moiety as a neutral loss (176 Da) without providing information about the attachment site. EAD preserves conjugation bonds while fragmenting the drug scaffold, producing unique fragment ions that reveal whether the glucuronidation occurred at an alcohol (O-glucuronide), amine (N-glucuronide), or carboxylic acid (acyl-glucuronide). In a 2024 DMD study by He et al., EAD on the ZenoTOF 7600 successfully identified 12 phase I metabolites and glucuronides of vepdegestrant — CID/HCD failed to identify modification sites for three O-glucuronides and three phase I metabolites that EAD resolved. EAD is recommended when MS2 spectra show only the neutral loss of the conjugate without scaffold fragmentation, when multiple isomeric conjugation products are possible, or when the modification site has direct structure-activity relationship or toxicity implications.
What stable isotope labeling strategies are used for drug metabolite tracking and how does natural abundance correction work?
Three labeling strategies are used in DMPK. Uniform 13C/15N labeling biosynthetically incorporates heavy isotopes throughout the drug molecule by feeding labeled precursors to a producing organism — this is the most comprehensive approach because every metabolite retains the isotopic signature, but requires biosynthetic access. Position-specific 2H labeling chemically incorporates deuterium at a metabolically stable position — simpler and cheaper but the labeling site must survive metabolism or the label is lost. The two-dose difference + stable isotope tracing (SIT) method co-incubates native and isotope-labeled drug in the same sample, producing characteristic isotope doublet peaks in the mass spectrum (Δm/z = label mass difference) that automated pattern scoring algorithms flag as drug-related. Natural abundance correction is necessary because naturally occurring heavy isotopes (13C ~1.1%, 15N ~0.37%, 2H ~0.015%) create a background signal that overlaps with the tracer signal. The modern skewed correction method uses a matrix-based deconvolution: Corrected MID = CM−1 × Measured MID, where CM is constructed from the elemental formula and known isotopic abundances. Software packages include AccuCor (R), IsoCor (Python), IsoCorrectoR (R, handles MS/MS data), and PICor (Python, handles dual 13C+15N labeling). Validation requires applying the correction to an unlabeled control: a correct correction yields M+0 approximately 100%, with all other isotopologues near 0%.
How are the five MSI metabolite identification confidence levels applied in drug development?
The five-level Metabolite Standards Initiative (MSI) framework is the universal language for communicating structural evidence strength. Level 5 (Exact Mass): an m/z was detected but no structural information is available — insufficient for any decision. Level 4 (Molecular Formula): accurate mass (<5 ppm on HRMS) plus isotope pattern match provides an unequivocal molecular formula — useful for screening but not for regulatory MetID. Level 3 (Tentative Candidate): MS2 fragmentation is consistent with a proposed biotransformation on the parent structure — the workhorse of discovery MetID, sufficient for lead optimization and candidate differentiation, but not for regulatory MIST decisions. Level 2 (Probable Structure): MS2 spectral match to a library or literature reference, or diagnostic evidence from orthogonal techniques — provides higher confidence but still lacks definitive authentication. Level 1 (Confirmed): retention time plus MS2 spectrum match to an authentic reference standard analyzed under identical conditions — the regulatory gold standard required for metabolites that approach or exceed the 10% MIST threshold. A 2025 Analytical Chemistry perspective by Metz et al. introduced "Identification Probability" = 1/N, where N is the number of database compounds matching the experimental feature within defined precision windows — a quantitative, automated alternative to qualitative level assignment that enables cross-laboratory comparability.
Which software platforms are used for metabolite identification and how do they compare?
The MetID software landscape divides into commercial vendor-integrated platforms and open-source tools. MetabolitePilot (SCIEX) excels at IDA data with parallel mining algorithms for predicted and unexpected metabolites. Compound Discoverer (Thermo) integrates natively with Orbitrap data and features automated FISh (Fragment Ion Search) scoring that matches experimental MS2 fragments against in silico predicted fragment structures — a 2024 application note demonstrated detection of 8 expected plus 1 unexpected clozapine-GSH conjugate using FISh scoring on an Orbitrap Exploris 240. MZmine (open-source) provides the most flexible preprocessing pipeline (ADAP chromatogram building, isotope grouping, alignment) and integrates with GNPS2 for molecular networking without vendor lock-in. MS-DIAL (open-source) was purpose-built for DIA/SWATH deconvolution and, in a 2025 cross-platform comparison by Aigensberger et al., showed the greatest similarity to manual integration among all tools — but across all four platforms (XCMS, Compound Discoverer, MS-DIAL, MZmine), only ~8% of features overlapped, underscoring that no single tool captures all metabolites. BioTransformer 3.0 provides free in silico biotransformation prediction. Meteor (Lhasa Limited) is a knowledge-based expert system incorporating literature-derived metabolism rules. Best practice: one commercial platform for primary processing, one open-source tool (MZmine or MS-DIAL) for orthogonal validation, and in silico prediction for metabolite structures that evade rule-based detection.
What are the FDA MIST requirements for metabolite structural characterization in regulatory submissions?
The FDA Safety Testing of Drug Metabolites guidance (MIST, Revision 2, March 2020), aligned with ICH M3(R2), requires structural characterization of any human metabolite present at >10% of total drug-related exposure (based on AUC pooling) at steady state. If this metabolite is not adequately covered by exposure in at least one toxicology species, further safety evaluation is warranted. Structural characterization must proceed to at least MSI Level 2 (probable structure with MS2 spectral evidence) and, for metabolites approaching or exceeding the 10% threshold, Level 1 (confirmed with authentic reference standard). The guidance recommends: (1) in vitro metabolic profiling (hepatocytes, microsomes from human and tox species) before first-in-human dosing; (2) early in vivo human metabolite identification using Phase I SAD samples to flag disproportionate metabolites; (3) definitive quantitative comparison of human vs tox species exposure for each metabolite >10% in MAD studies; (4) synthesis and direct safety testing of the isolated metabolite if tox species coverage is inadequate. The MIST assessment should be completed before Phase III. Key reporting elements include annotated MS2 spectra for each metabolite >10%, MSI confidence level, cross-species exposure table (human, rat, dog, monkey), and a justification statement explaining why each metabolite is either adequately covered or requires further safety evaluation. The practical consequence is that MetID must generate regulatory-submission-quality data — not just discovery-quality screening data — for any metabolite that approaches the 10% threshold.
How do I handle metabolites that appear only in human hepatocytes and not in preclinical species?
Human-specific or disproportionate metabolites represent the highest-risk MIST scenario. The workflow is: (1) confirm the observation is not an artifact — repeat the hepatocyte incubation in a second human donor and verify the metabolite is reproducible; (2) quantify the metabolite using peak area ratio or, ideally, a synthesized standard with a calibration curve, to determine whether it exceeds the 10% total drug-related material threshold; (3) if the metabolite exceeds 10% and is absent in rat and dog hepatocytes, test additional tox species — minipig, monkey, or rabbit — to identify any species that forms the metabolite at adequate exposure; (4) if no standard tox species provides coverage, two options exist: synthesize the metabolite for direct administration in a dedicated animal safety study (Approach 2 per FDA MIST), or use a transgenic mouse model expressing the human enzyme(s) responsible for metabolite formation if the metabolic pathway is known; (5) if the metabolite is pharmacologically inactive and structurally similar to adequately covered metabolites, a scientific justification for waiving dedicated safety testing may be considered, but this requires close consultation with regulatory reviewers. The key operational lesson: run cross-species hepatocyte MetID as early as lead optimization, not after candidate selection — discovering a human-specific metabolite at the IND stage leaves no time for de novo metabolite synthesis and safety testing without delaying the program.
References
- ICH M3(R2): Guidance on Nonclinical Safety Studies for the Conduct of Human Clinical Trials and Marketing Authorization for Pharmaceuticals. International Council for Harmonisation; 2009. https://database.ich.org/sites/default/files/M3_R2__Guideline.pdf
- U.S. Food and Drug Administration. Safety Testing of Drug Metabolites: Guidance for Industry (Revision 2). FDA; 2020. https://www.fda.gov/media/72279/download
- Ahlqvist M, Karlsson IB, Ekdahl A, et al. Metabolite identification data in drug discovery, part 1: data generation and trend analysis. Mol Pharm. 2025;22(12):6788-6802. DOI: 10.1021/acs.molpharmaceut.5c00738
- He Y, Hou P, Long Z, et al. Application of electro-activated dissociation fragmentation technique to identifying glucuronidation and oxidative metabolism sites of vepdegestrant by LC-HRMS. Drug Metab Dispos. 2024;52(8):831-842. DOI: 10.1124/dmd.124.001661
- Yao M, Tong N, Baghla R, Ruan Q. Advancing structural elucidation of conjugation drug metabolites in metabolite profiling with novel electron-activated dissociation. Rapid Commun Mass Spectrom. 2024;38(19):e9890. DOI: 10.1002/rcm.9890
- Tang Y, Chen Z, Chen L, Liang X, Dean B, Zhang D. Identification of isomeric glucuronides by electronic excitation dissociation tandem mass spectrometry. Int J Mass Spectrom. 2024;507:117372. DOI: 10.1016/j.ijms.2024.117372
- Metz TO, Chang CH, Gautam V, et al. Introducing "identification probability" for automated and transferable assessment of metabolite identification confidence in metabolomics and related studies. Anal Chem. 2025;97(1):1-11. DOI: 10.1021/acs.analchem.4c04184
- Magny R, Lefrère B, Mégarbane B, et al. Application of a molecular networking approach using LC-HRMS combined with the MetWork webserver for clinical and forensic toxicology. Heliyon. 2024;10(17):e36735. DOI: 10.1016/j.heliyon.2024.e36735
- Aigensberger M, Bueschl C, Castillo-Lopez E, et al. Modular comparison of untargeted metabolomics processing steps. Anal Chim Acta. 2025;1336:343491. DOI: 10.1016/j.aca.2024.343491
Related Services


