What Is Mass Balance and Why Does It Matter?
Mass balance is the practical application of the law of conservation of mass to pharmaceutical forced degradation studies. At its simplest, it answers one question: does the sum of the remaining API and all degradation products account for the total drug substance that was present before stress was applied? If a forced degradation condition destroys 15% of the parent drug, then the analytical method should detect degradant peaks whose combined response corresponds to that 15% loss — plus or minus the margin of analytical variability.
The concept is deceptively simple, but its centrality to regulatory submissions cannot be overstated. Mass balance is the primary evidence that an analytical method is truly stability-indicating — capable of separating, detecting, and quantifying every species that matters for product quality — and is assessed across every stress condition in forced degradation studies. When the mass balance equation reconciles API loss with degradant growth, the stability-indicating method is validated as fit for purpose. A method that reports 15% API loss but only detects 5% worth of degradant peaks is not seeing everything — and what it misses could be a toxic degradant accumulating at levels above ICH Q3B qualification thresholds.
Regulatory expectations are unambiguous. Every IND, NDA, and ANDA submission must include a mass balance assessment for forced degradation studies. FDA deficiency letters to ANDA applicants frequently cite unexplained mass imbalance — "Please explain the mass imbalance of the stressed samples" is among the most common analytical deficiencies in first-cycle reviews (Marden et al., AAPS J, 2024). The 2025 consolidated ICH Q1 Step 2 draft elevates forced degradation to a dedicated chapter (Section 2) and reinforces mass balance as a narrative assessment: the expectation is not a specific number, but a scientifically reasoned explanation of where the mass went.
At Creative Proteomics DMPK, mass balance is calculated, corrected, and reported as a standalone analytical deliverable — not an afterthought appended to the forced degradation chromatogram package. Every stress condition includes a documented mass balance assessment with detector-level justification.
The Mass Balance Equation: Basic Formula, MW Correction, and Response Factor Determination
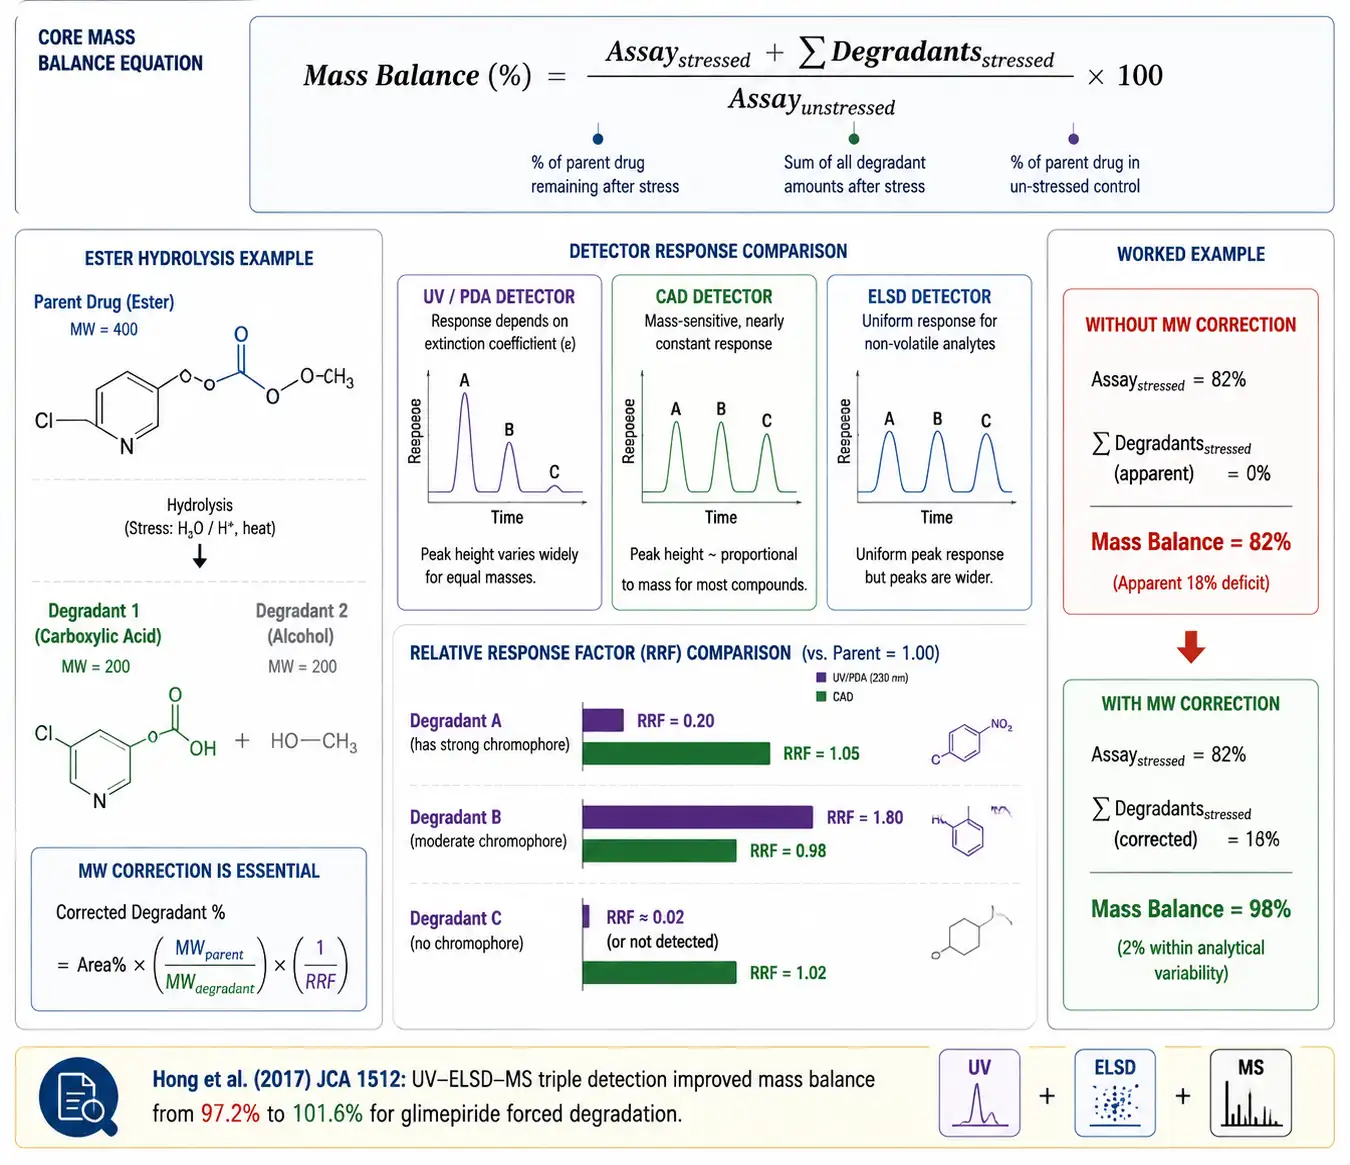 Figure 1: The Mass Balance Equation — Basic Formula, MW Correction, and Response Factor Determination
The mathematical expression of mass balance takes several forms, each appropriate for different analytical scenarios. Understanding when and why to escalate from the basic formula to corrected variants is essential for accurate regulatory reporting.
Basic formula. The simplest expression is:
Mass Balance (%) = (Assaystressed + ΣDegradantsstressed) / Assayunstressed × 100
where Assaystressed is the API content measured after stress (as a percentage of label claim or initial concentration), ΣDegradantsstressed is the sum of all degradation product peak areas (expressed as area% relative to the unstressed API peak area), and Assayunstressed is the API content before stress. This formula assumes two things: that all degradants have approximately the same detector response as the parent drug, and that degradation does not substantially change molecular weight — assumptions that fail in many real-world situations.
Molecular weight correction. When a degradation reaction changes the molecular weight of the analyte by more than approximately 10%, area% alone becomes misleading. The classic scenario is ester or amide hydrolysis, where a parent drug of MW 400 cleaves into a carboxylic acid of MW 200 and an alcohol of MW 200. A 15% molar loss of parent produces approximately 7.5 area% of the acid degradant (because each mole of parent yields one mole of acid at half the mass). Without correction, mass balance would suggest a 7.5% deficit where none actually exists.
Corrected Degradant (%) = Area%degradant × (MWparent / MWdegradant) × (1 / RRF)
where RRF is the relative response factor of the degradant versus the parent. If the RRF has not been experimentally determined, it should be assumed as 1.0 and this assumption explicitly documented.
Relative response factor (RRF) determination. Different compounds absorb UV light with profoundly different efficiencies. A degradation product that has lost the parent drug's chromophore — for example, a saturated aliphatic fragment cleaved from an aromatic ring system — may have an extinction coefficient 50- to 100-fold lower than the parent. Using uncorrected UV peak areas, such a degradant appears nearly invisible, creating an apparent mass balance deficit. Conversely, a degradant that retains the chromophore in a smaller molecular framework may have a higher per-mass response, creating an apparent excess.
The most practical solution is orthogonal detection: placing a mass-sensitive detector (charged aerosol detection, CAD; or evaporative light scattering detection, ELSD) in series with UV/PDA. Because CAD and ELSD response is approximately uniform for equal masses of non-volatile analytes regardless of chemical structure (RRF range typically 0.8-1.2 for CAD), the mass detector provides a structure-independent reference. Comparing the UV peak area ratio to the CAD peak area ratio for each degradant yields an experimentally determined UV RRF without requiring purified impurity standards. Hong et al. (2017) demonstrated this approach for glimepiride forced degradation: applying CAD-derived RRFs shifted mass balance from 97.2% to 101.6%, and MS detection revealed a non-chromophoric byproduct (4-methylcyclohexylamine) that UV had entirely missed (J Chromatogr A, 1512:61-70).
When to apply each correction. For screening and early development, the basic formula with area% is acceptable, provided the limitations are documented. For formal stability-indicating method validation and regulatory submissions where mass balance falls outside 95-105%, apply MW correction for all degradants with MW differing from parent by more than 10%, and apply RRF correction using experimentally determined values (CAD/ELSD or external standard method). The combined MW + RRF correction resolves the large majority of apparent mass balance failures attributable to quantitation artifacts.
Acceptance Criteria: The 95-105% Debate and Why ICH Does Not Specify a Hard Number
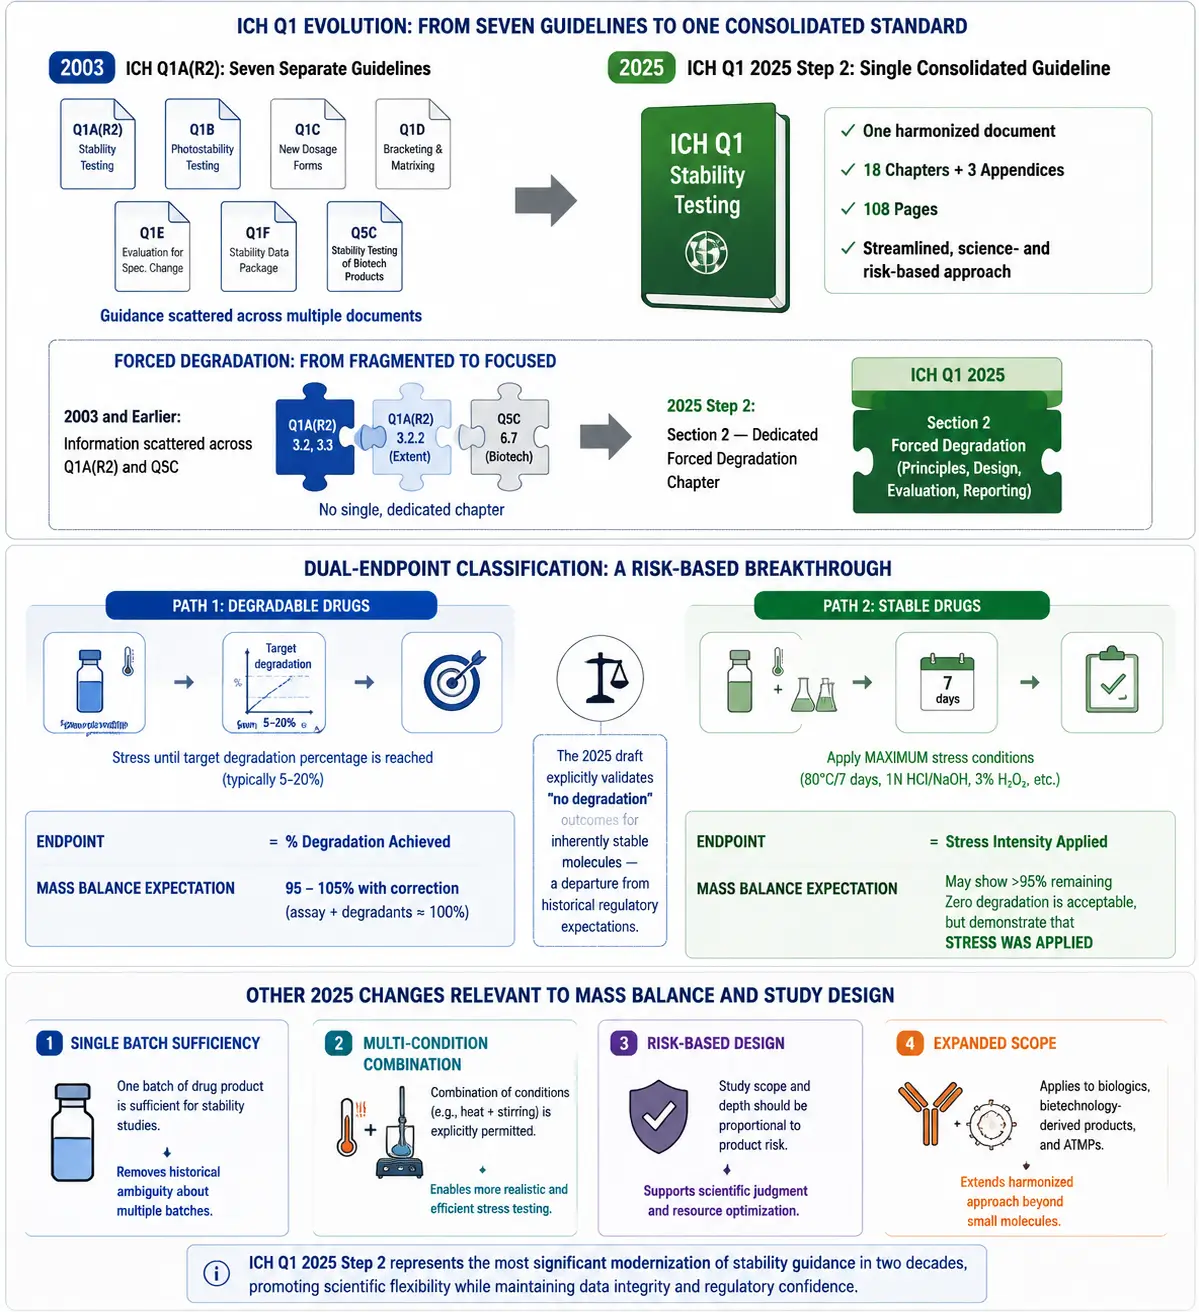 Figure 2: ICH Q1 2025 Step 2 — Dual-Endpoint Classification and Its Impact on Mass Balance
Industry consensus recognizes 95-105% as the ideal mass balance window, with 97-103% as the operational range achievable for well-characterized small molecules using corrected calculations. But ICH Q1A(R2) — and the 2025 consolidated draft — deliberately avoid specifying a hard numeric limit. This is not an oversight. It reflects a regulatory principle: mass balance is a scientific assessment, not a pass/fail test.
There are at least four scientifically legitimate reasons mass balance may fall outside 95-105%:
Non-UV-active degradants. Carbon dioxide, formic acid, formaldehyde, and small aliphatic fragments have no or negligible UV chromophores. CAD or ELSD can detect them, but these detectors are not always part of the analytical workflow — and even CAD misses volatile species.
Volatile degradants. Low-molecular-weight aldehydes, amines, and organic acids formed during oxidative or thermal stress may evaporate during sample preparation, particularly if heating or vacuum concentration is involved. Headspace GC-MS captures these, but the data sits in a separate analytical track from LC-UV mass balance.
Response factor divergence. Even with MW correction, a degradant with an RRF of 0.05 versus the parent will be drastically underestimated unless the RRF is measured and applied. CAD improves this but does not eliminate the problem — CAD response falls off for semi-volatile compounds.
Stoichiometric artifacts. Oxidation adds oxygen mass (+16 or +32 Da per oxygen atom incorporated). GSH trapping adds +305 Da via the glutathione moiety. When a degrader carries more mass than the parent it derived from, mass balance can exceed 100% unless stoichiometry is accounted for (see Layer 3 & 4 below).
The 2025 ICH Q1 Step 2 draft introduces a dual-endpoint classification that fundamentally reframes how mass balance should be interpreted. For degradable drugs — those that show meaningful degradation under stress — the endpoint is the target degradation percentage (typically 5-20%), and mass balance assessment follows the conventional framework. For stable drugs — those that resist degradation even under severe conditions — the endpoint is the stress intensity itself. If a drug withstands 1N HCl at 80°C for 7 days with negligible degradation, the mass balance "result" is simply that >95% remains, and that is a valid and complete answer. The 2025 draft explicitly validates "no degradation" outcomes for inherently stable molecules — a significant departure from the historical expectation that some degradation must be generated.
When mass balance falls outside 90-110% despite correction, the regulatory expectation is a documented scientific justification: explain the probable cause(s), describe the orthogonal experiments performed to identify the missing mass, estimate the worst-case quality risk of the unexplained fraction, and state whether any unknown degradant exceeds ICH Q3B identification thresholds. A well-written justification is almost always accepted by reviewers — but silence about an unexplained deficit is almost never accepted.
Layer 1 — Detection Gaps: When Degradants Are Invisible to UV
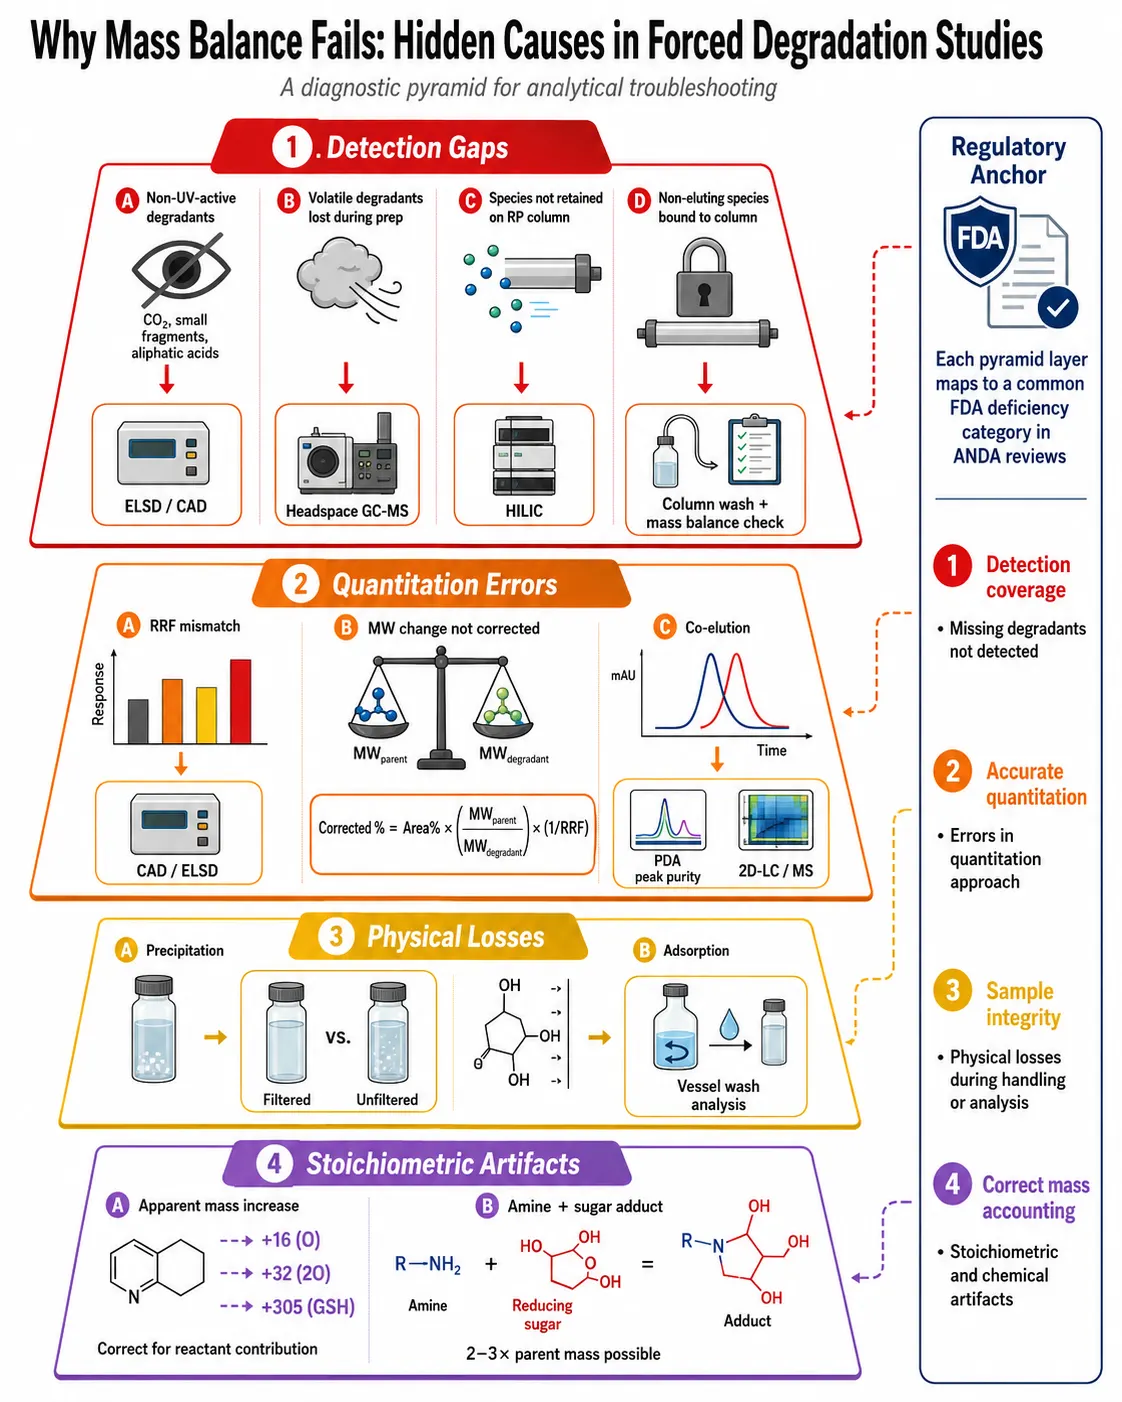 Figure 3: The Four-Layer Mass Balance Troubleshooting Framework
The most common and impactful cause of mass balance failure is the simplest: degradants form, but the detector cannot see them. The UV detector — the workhorse of pharmaceutical HPLC analysis — is inherently selective: it detects only compounds that absorb light at the chosen wavelength, and with widely varying efficiency depending on the chromophore. When an API with an extinction coefficient of 30,000 M-1cm-1 degrades into fragments whose extinction coefficients are zero (no chromophore) or 200 (weak isolated carbonyl), the UV chromatogram shows API loss with little or no corresponding degradant growth. This is not a sample problem — it is a detection problem.
Non-UV-active degradants. Four classes of degradation products routinely escape UV detection: (1) carbon dioxide and small inorganic fragments from decarboxylation; (2) small organic acids (formic, acetic, oxalic) from side-chain oxidation; (3) saturated aliphatic amines and alcohols cleaved from larger frameworks; and (4) sugars and polyols from glycosidic drug hydrolysis. The recommended tool for capturing these is CAD or ELSD placed in series with UV — a single injection provides both chromophore-dependent (UV) and mass-dependent (CAD) chromatograms. Discrepancies between the UV and CAD total peak inventories directly reveal non-UV-active species.
Volatile degradants. Low-molecular-weight aldehydes (formaldehyde, acetaldehyde), amines (methylamine), and organic acids produced under oxidative or thermal stress can evaporate during sample preparation, particularly if the workflow involves evaporation to dryness or heating. These species may be present in the stressed sample but absent from the injected solution. Headspace GC-MS is the definitive tool for identifying volatile degradants: the stressed sample is heated in a sealed vial and the headspace gas is sampled directly onto the GC column. For regulatory submissions where volatile loss is suspected, TGA coupled with IR or MS detection can also quantify evolved gases from the solid stressed sample.
Polar, non-retained degradants. Very polar degradation products — small carboxylic acids, amino acids, sugars — may elute in or near the solvent front on reversed-phase columns and be discounted as "void volume noise." Switching to HILIC (hydrophilic interaction liquid chromatography) or using an ion-pairing reversed-phase method captures these species. A related problem is non-eluting degradants: polymeric or highly hydrophobic species that bind irreversibly to the column stationary phase. These can be detected by performing a strong-solvent column wash after each injection and comparing wash peak areas between stressed and unstressed runs.
Layer 2 — Quantitation Errors: Response Factors, MW Changes, and Co-Elution
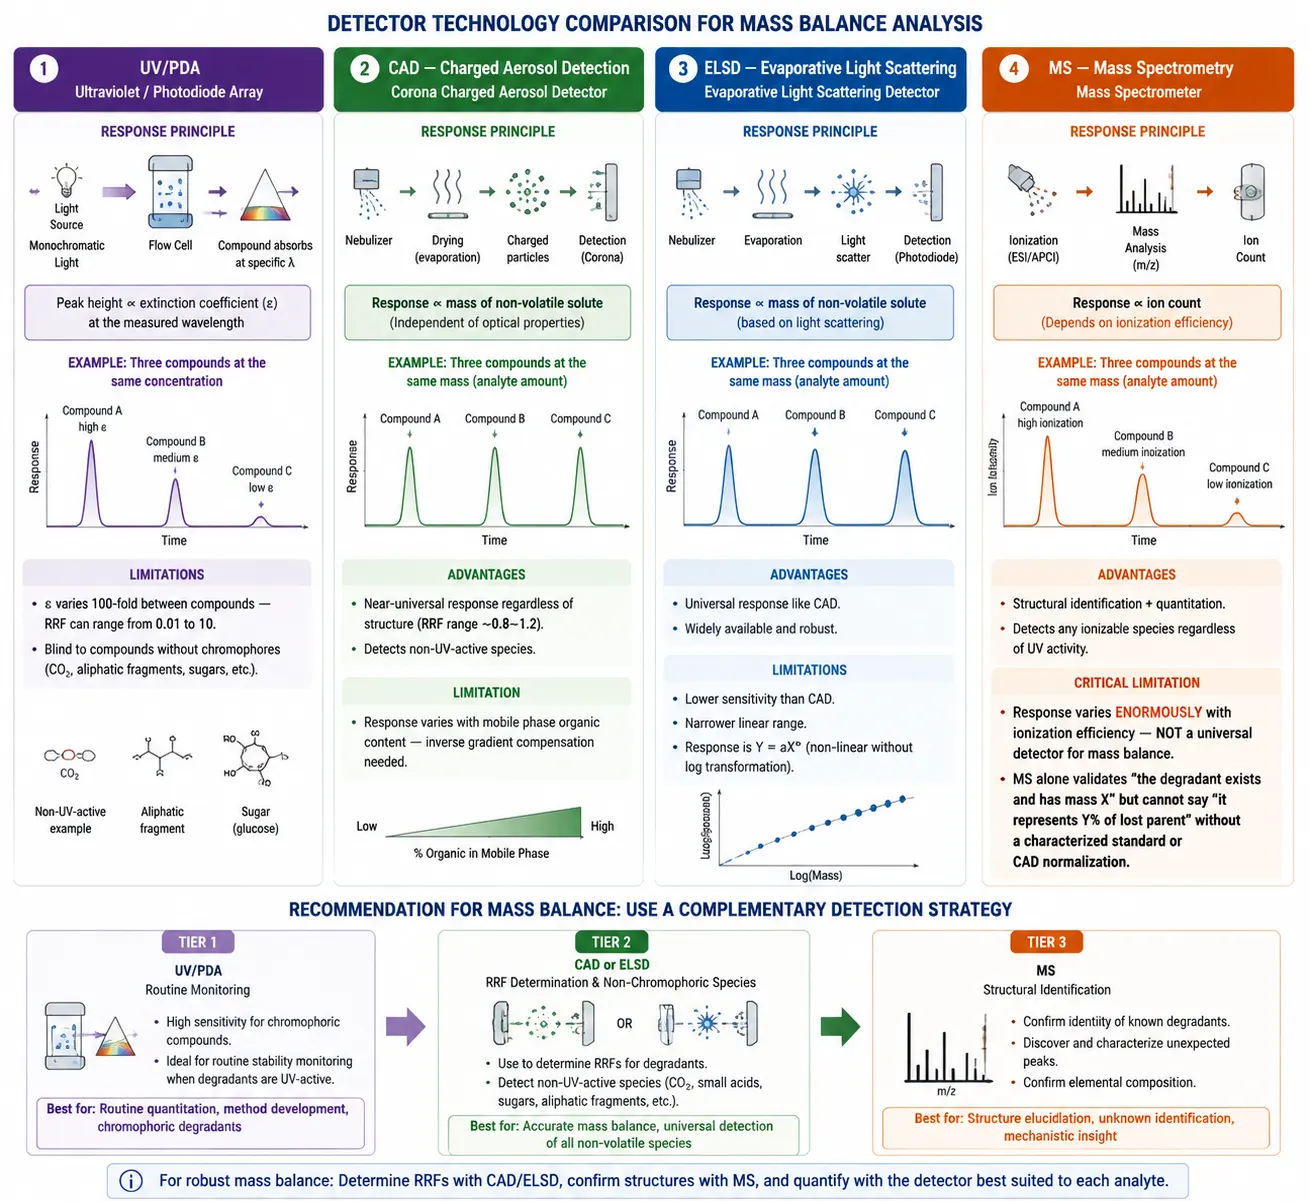 Figure 4: Detection Technology Comparison — UV, CAD, ELSD, and MS for Accurate Degradant Quantitation
Even when all degradation products are detected, inaccurate quantitation can produce significant mass balance errors. Layer 2 addresses the gap between "I can see the degradant peak" and "the peak area correctly represents the amount of degradant."
Response factor differences. When the degradant retains a chromophore but with a different molar absorptivity than the parent, the UV peak area per unit mass differs between the two species. Industry data spanning hundreds of pharmaceutical compounds show that UV RRFs for degradation products commonly fall between 0.2 and 5.0 relative to the parent — meaning a degradant present at equal concentration can appear as a peak 5 times larger or 5 times smaller than the parent peak. For regulatory submissions, ICH Q2(R2) recommends that RRFs outside 0.8-1.2 should be applied in impurity calculations, and the same principle extends to mass balance.
The three practical approaches to obtaining RRFs are: (1) purified degradant standard — isolate or synthesize the degradant, prepare a calibration curve, and calculate RRF = slopedegradant / slopeparent (gold standard but resource-intensive); (2) CAD/ELSD ratio method — use the mass detector signal as a universal quantitation reference, comparing UV area/CAD area ratios between parent and degradant (Hong et al., 2017); (3) qNMR offline quantitation — quantitative 1H NMR of the stressed sample provides a truly universal mass reference independent of chromatography, albeit with lower throughput.
MW change not accounted for. Discussed in the mass balance equation section above, the MW correction is mathematically straightforward but operationally requires that the degradant structure be known or at least its molecular weight determined by LC-MS. For unknown degradants where structural elucidation has not been performed, the MW is unknown and the correction cannot be applied — this should be explicitly stated as a source of mass balance uncertainty. When degradant identity is needed for MW correction, degradant structural elucidation by HRMS provides the molecular formula and fragmentation data required to determine MW and apply the correction.
Co-elution. The most insidious quantitation error occurs when a degradant co-elutes with the API peak or with another degradant. In the co-elution-with-API scenario, the API peak area appears falsely elevated (it contains hidden degradant), while the degradant sum is falsely low (the hidden degradant is not counted). This produces a misleadingly "good" mass balance. PDA peak purity analysis — comparing UV spectra at the peak front, apex, and tail — detects co-elution when the co-eluting species has a different chromophore, but fails when spectra are similar. Orthogonal confirmation by LC-MS extracted ion chromatograms or separation on a column with different selectivity (e.g., phenyl-hexyl vs C18) provides stronger evidence that the API peak is truly homogeneous.
Layer 3 & 4 — Physical Losses and Stoichiometric Artifacts
When detection gaps are ruled out (Layer 1) and quantitation is corrected (Layer 2), the remaining mass balance discrepancies typically arise from physical sample behavior or chemical stoichiometry — issues that exist in the vial, not in the chromatogram.
Layer 3: Physical losses. Acidic and alkaline forced degradation samples are neutralized before HPLC injection to protect the column and match the mobile phase pH. Neutralization can precipitate poorly soluble degradants — a compound that was soluble in 1N HCl may be completely insoluble at pH 7. The precipitate either settles or is removed by filtration, removing degradant mass from the analytical sample. The diagnostic test is straightforward: compare peak areas between filtered and unfiltered aliquots of the same neutralized sample, and separately dissolve any visible precipitate in a strong solvent for independent analysis. A second physical loss mechanism is adsorption to container surfaces — hydrophobic degradants, peptides, and metal-chelating species can bind to glass or plastic vial walls, reducing solution concentration over time. Rinsing the empty vial with strong organic solvent and analyzing the wash identifies adsorbed species.
Layer 4: Stoichiometric artifacts. This is the most subtle cause of mass balance anomalies and the most commonly overlooked. When a degradation reaction incorporates mass from a reactant — oxygen from H2O2 (+16 Da for one O, +32 Da for two O), glutathione from GSH trapping (+305 Da), or a reducing sugar from an excipient (Maillard adduction, which can produce adducts 2-3x the parent drug mass) — the degradation product has a greater mass than the parent drug it replaced. A 10% molar loss of parent to an oxidation product with +32 Da mass gain produces approximately 10.8 area% of the oxidation degradant (assuming similar RRF), causing mass balance to appear to be 100.8% — a slight excess that often goes uninvestigated. For Maillard adducts, the effect is far more dramatic: a drug-lactose adduct with approximately 3x parent mass can produce 30 area% of adduct from 10% parent loss, yielding an apparent mass balance of 120%.
The correction is to account for the reactant mass contribution in the mass balance equation. For oxidation: if one mole of parent (+O) produces one mole of mono-oxidized degradant, the expected degradant mass yield per mole of parent consumed is (MWparent + 16) / MWparent. This factor divides the apparent degradant response to calculate the parent-equivalent mass lost. For excipient adducts, structural characterization of the adduct is necessary to determine the stoichiometric relationship and apply the correct mass factor.
Baertschi et al. (2013) formalized these concepts as Absolute Mass Balance Deficit (AMBD) and Relative Mass Balance Deficit (RMBD) — quantitative metrics that normalize mass balance against the extent of degradation, distinguishing between a small absolute deficit in a highly degraded sample (which may be acceptable) and a large relative deficit in a mildly degraded sample (which demands investigation) (Trends Anal Chem, 49:126-136).
Regulatory Documentation: Building the Mass Balance Narrative for IND/NDA Submissions
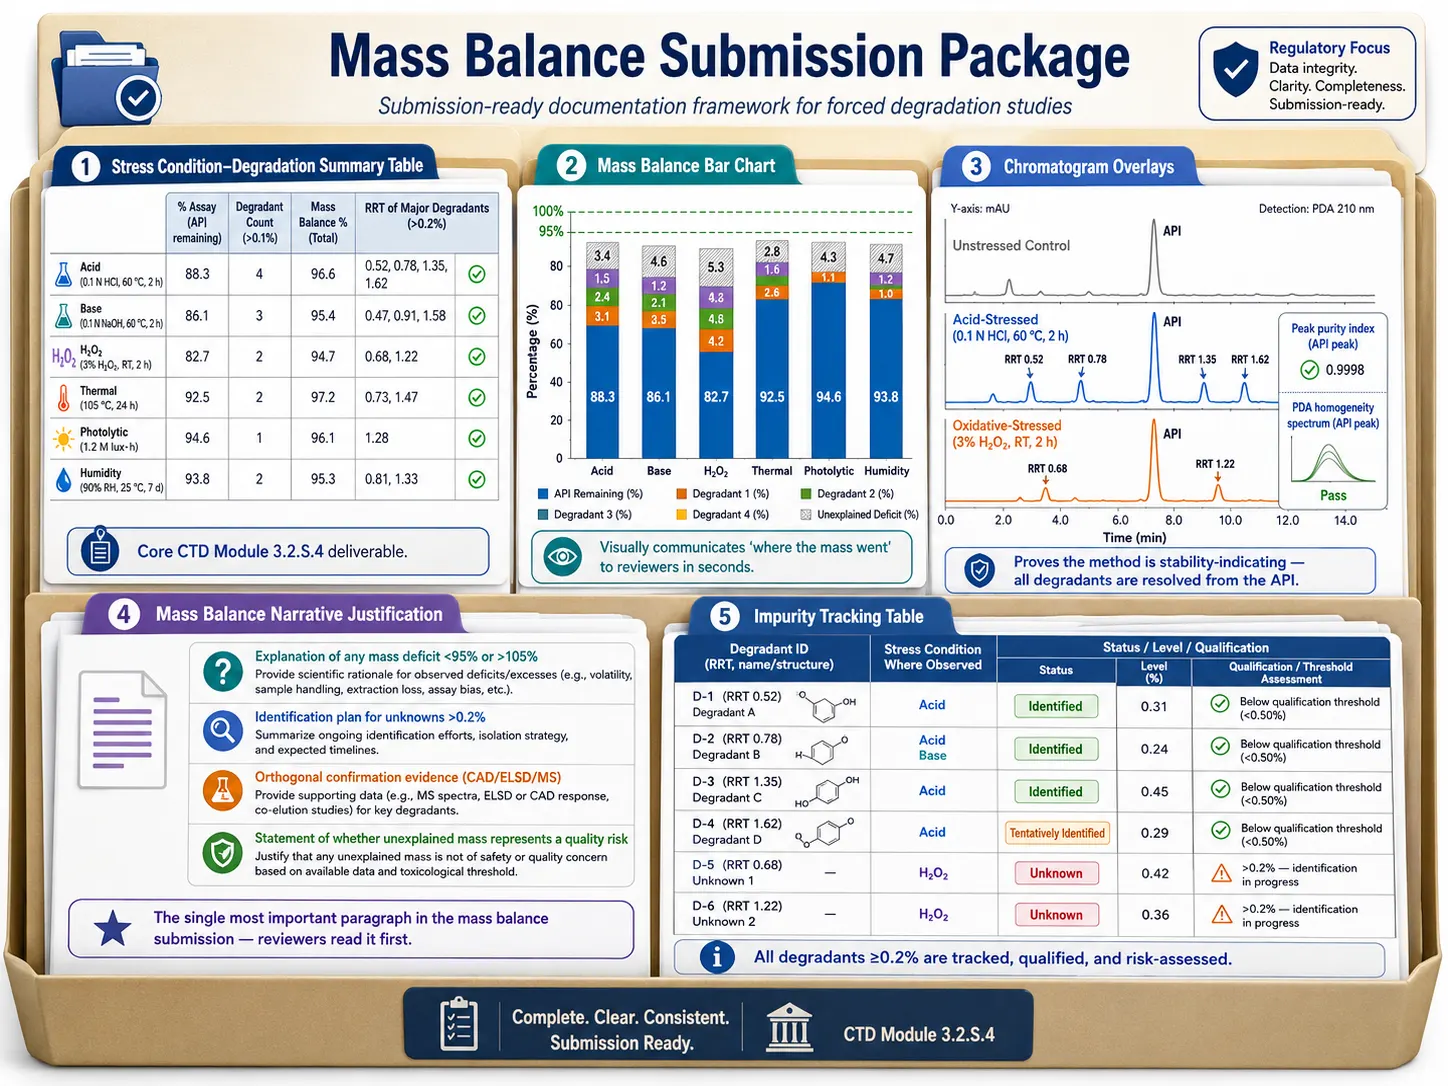 Figure 5: Mass Balance Regulatory Documentation Package for IND/NDA Submissions
A mass balance assessment in a regulatory submission is more than a table of numbers — it is a narrative argument that the analytical method is fit for purpose and that unexplained mass deficits pose no risk to product quality. The same mass balance logic extends from forced degradation into short-term and long-term stability programs, and the specificity demonstration underlying mass balance is a cornerstone of method validation under ICH M10 bioanalytical method validation. The following six components constitute a complete mass balance documentation package for CTD Module 3.2.S.4 (drug substance) or 3.2.P.5 (drug product).
1. Stress condition-degradation summary table. A matrix with stress conditions as rows and columns for: % assay remaining, number of new degradant peaks, sum of degradants (area%), mass balance (%), RRT of major degradants, and peak purity pass/fail. This is the regulatory reviewer's first stop: it provides a complete overview in a single view. Any stress condition showing mass balance outside 90-110% should be flagged with a footnote referencing the justification narrative.
2. Mass balance bar chart by stressor. A grouped bar chart with X-axis = stress conditions and Y-axis = percentage (0-100%). For each condition: a blue bar for API remaining, stacked colored bars for individual degradants (identified), and a gray hatched bar for the unexplained fraction. A dashed green reference line at 95% and 100% provides immediate visual context. This graphic communicates "where the mass went" to the reviewer in seconds and is often the single most impactful figure in the mass balance section.
3. Chromatogram overlays. Overlay the unstressed control chromatogram with each stressed-condition chromatogram at consistent Y-axis scaling. Annotate new degradant peaks with RRT values. Highlight the API peak with its PDA peak purity index. This visual package simultaneously demonstrates: (a) that degradation has occurred, (b) that degradants are resolved from the API, and (c) that the API peak remains spectrally pure. For critical degradants, include LC-MS extracted ion chromatograms as orthogonal confirmation that each chromatographic peak represents a single chemical species.
4. Mass balance justification narrative. This paragraph — arguably the most important in the submission — explains every mass balance deviation. For each stressed sample where mass balance falls outside 95-105%, the narrative must address: the magnitude and direction of the deviation, the most probable cause (supported by experimental evidence), the orthogonal techniques employed to search for missing mass, the worst-case estimate of any unidentified degradant level, and a statement of whether the unexplained fraction poses a quality risk. The 2024 Marden et al. review provides example justification language that has been accepted across multiple regulatory agencies.
5. Impurity tracking table. A comprehensive degradant inventory: each degradant is assigned an identifier (RRT or code), the stress condition(s) where it appears, its identity (chemical name or "unknown"), its level as a percentage of parent, its ICH Q3B qualification status, and whether a reference standard is available. Unknown degradants above the identification threshold (typically 0.1-0.2% depending on daily dose) must have an identification plan or a toxicological risk assessment.
6. Orthogonal confirmation evidence. If CAD, ELSD, or headspace GC-MS was used to investigate mass balance gaps, include the orthogonal chromatograms and a short interpretation. The demonstration that you looked for the missing mass — even if you did not find it — carries significant weight with reviewers.
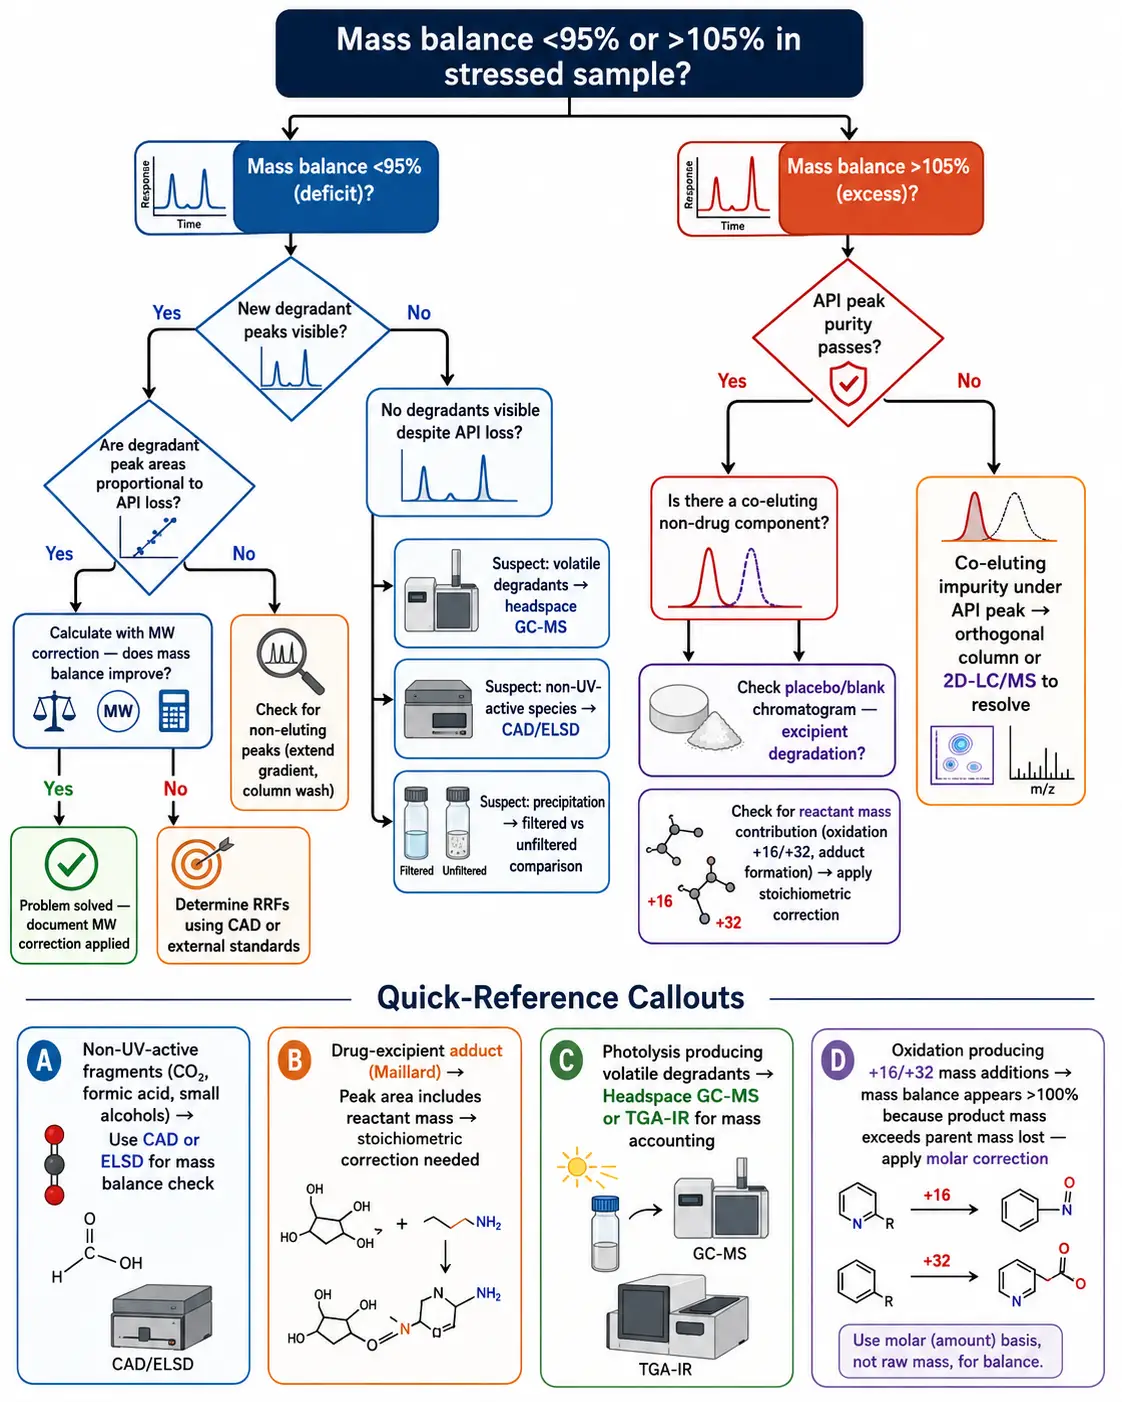 Figure 6: Mass Balance Troubleshooting Decision Tree
Frequently Asked Questions
What is the formula for calculating mass balance in forced degradation studies?
The basic formula is Mass Balance (%) = (Assaystressed + ΣDegradantsstressed) / Assayunstressed × 100. For hydrolysis products where MW changes significantly, apply MW correction: Corrected Degradant (%) = Area% × (MWparent / MWdegradant) × (1 / RRF). When relative response factors (RRFs) differ substantially from 1.0 — as they do for most degradation products — RRF correction using CAD or external standards is essential for accurate mass balance, particularly for regulatory submissions where uncorrected values may fall well outside the 95-105% window even though the actual mass balance is near 100%.
What is the acceptable mass balance range in forced degradation studies?
Industry consensus targets 95-105%, with 97-103% considered the operational working range for routine small-molecule forced degradation studies when MW and RRF corrections are applied. However, ICH Q1 does not specify a hard numeric limit — regulators expect a scientific narrative explaining any deviation. Values below 90% or above 110% typically trigger targeted investigation using orthogonal detection techniques (CAD, ELSD, headspace GC-MS). Values in the 90-95% and 105-110% ranges are often accepted with a documented justification. Extreme deviations (>20% deficit) can be acceptable when the cause is well understood — for example, decarboxylation quantitatively producing CO2, which is undetectable by LC but stoichiometrically accounted for.
Why does ICH not specify a fixed mass balance acceptance limit?
Mass balance can legitimately fall outside any fixed window for scientifically valid and unavoidable reasons: non-UV-active degradants invisible to standard detectors, volatile species lost during sample preparation, large response factor divergences between parent and degradant, and stoichiometric artifacts from adduct formation or oxidation. A rigid numeric limit — say, 90-110% — would force sponsors to either mask legitimate analytical gaps with unjustified corrections or report false compliance. ICH therefore requires a reasoned scientific narrative rather than a pass/fail test: explain where the mass probably went, describe what orthogonal experiments were done to search for it, and justify why any residual uncertainty poses no product quality risk. The 2025 consolidated ICH Q1 draft reinforces this narrative-based approach.
How do I address mass balance deficit when no new degradant peaks appear?
This is the single most common mass balance scenario and almost always points to detection gaps (Layer 1 of the troubleshooting framework). Degradants may lack chromophores — use CAD or ELSD in series with UV to detect non-UV-active species; be volatile — use headspace GC-MS to capture species lost during sample preparation; co-elute with the API peak — use PDA peak purity analysis and orthogonal column confirmation to check for hidden co-elution; or be irreversibly retained on the column — perform a strong-solvent column wash after each injection and compare stressed vs unstressed wash chromatograms. If all orthogonal approaches fail to find the missing mass, document the investigation, estimate the maximum possible level of any single undetected degradant, and provide a toxicological risk assessment. Regulatory reviewers accept well-documented "unable to close mass balance" conclusions far more readily than unexplained silence about a visible deficit.
What does the ICH Q1 2025 Step 2 draft change about mass balance expectations?
The 2025 draft consolidates seven previous ICH stability guidelines (Q1A-F and Q5C) into a single 108-page document with 18 chapters. The most consequential change for mass balance is the introduction of a dual-endpoint classification for forced degradation: degradable drugs are stressed until a target degradation percentage (5-20%) is reached, while stable drugs are stressed until sufficient stress intensity is applied — even zero degradation is a valid and complete result. This formally resolves the historical regulatory ambiguity about what constitutes "adequate" stress for inherently stable molecules. Other relevant changes include explicit endorsement of single-batch forced degradation (reducing material burden), permission for multi-condition combinations (e.g., heat + stirring), a risk-based approach to study design, and expanded scope to include biologics and ATMPs. The forced degradation content, previously scattered across Q1A and Q5C, is now consolidated in a dedicated Section 2.
When should I apply molecular weight correction in mass balance calculations?
MW correction should be applied whenever a degradation reaction changes the molecular weight of the parent by more than approximately 10%. The most common scenario is hydrolysis (ester or amide cleavage), where the parent drug (typically MW 300-500) cleaves into two fragments each with roughly half the molecular weight. Without MW correction, each mole of degradant appears as only half the peak area that a mole of parent would produce, creating an apparent 50% mass balance deficit where the chemistry is stoichiometrically perfect. MW correction is also essential for dimerization/oligomerization products (MW = 2x or 3x parent) and for oxidation products where multiple oxygen atoms are incorporated. The formula is: Corrected Degradant (%) = Measured Area% × (MWparent / MWdegradant) × (1 / RRF). The MW of each degradant must be known — typically from LC-MS analysis — for the correction to be applied. If the degradant structure is unknown, MW cannot be determined and the inability to apply this correction must be documented as a source of uncertainty in the mass balance assessment.
References
- Marden S, Campbell JM, Adams N, Coelho R, Foti C, Franca JR, Hostyn S, Huang Z, Ultramari M, Zelesky T, Baertschi SW. Mass Balance in Pharmaceutical Stress Testing: A Review of Principles and Practical Applications. AAPS J. 2024;26(5):96. DOI: 10.1208/s12248-024-00961-3
- Baertschi SW, Pack BW, Hoaglund Hyzer CS, Nussbaum MA. Assessing mass balance in pharmaceutical drug products: New insights into an old topic. Trends Anal Chem. 2013;49:126-136. DOI: 10.1016/j.trac.2013.06.006
- Hong P, Phoebe AD, Jones MD. Study of relative response factors and mass balance in forced degradation studies with liquid chromatography/photo-diode array detector/evaporative light scattering detector/mass spectrometry system. J Chromatogr A. 2017;1512:61-70. DOI: 10.1016/j.chroma.2017.07.001
- Zelesky T, Baertschi SW, Foti C, et al. Pharmaceutical Forced Degradation (Stress Testing) Endpoints: A Scientific Rationale and Industry Perspective. J Pharm Sci. 2023;112(12):2948-2964. DOI: 10.1016/j.xphs.2023.09.003
- ICH Q1A(R2): Stability Testing of New Drug Substances and Products. International Council for Harmonisation; 2003. https://database.ich.org/sites/default/files/Q1A%28R2%29%20Guideline.pdf
- ICH Q1 Draft Guideline: Stability Testing of Drug Substances and Drug Products (Step 2). International Council for Harmonisation; 2025. https://www.ich.org/page/quality-guidelines
- Baertschi SW, Alsante KM, Reed RA, eds. Pharmaceutical Stress Testing: Predicting Drug Degradation. 2nd ed. London: Informa Healthcare; 2011.
- Alsante KM, Ando A, Brown R, et al. The role of degradant profiling in active pharmaceutical ingredients and drug products. Adv Drug Deliv Rev. 2007;59(1):29-37. DOI: 10.1016/j.addr.2006.10.006
- Campbell JM, Foti C, Wang C, Adams N, Allain LR, Araujo G, Azevedo R, Franca JR, Hicks SR, Hostyn S, Jansen PJ, Kotoni D, Kuemmell A, Marden S, Rullo G, Santos ACO, Sluggett GW, Zelesky T, Baertschi SW. Assessing the Relevance of Solution Phase Stress Testing of Solid Dosage Form Drug Products: A Cross-Industry Benchmarking Study. J Pharm Sci. 2022;111(2):298-305. DOI: 10.1016/j.xphs.2021.06.012
- U.S. Food and Drug Administration. Guidance for Industry: ANDAs: Stability Testing of Drug Substances and Products, Questions and Answers. FDA; 2014. https://www.fda.gov/regulatory-information/search-fda-guidance-documents/andas-stability-testing-drug-substances-and-products-questions-and-answers
Related Services


